Food Texture Market Analysis North America, Europe, APAC, South America, Middle East and Africa - US, Canada, China, Germany, UK - Size and Forecast 2024-2028

Food Texture Market Analysis North America, Europe, APAC, South America, Middle East and Africa - US, Canada, China, Germany, UK - Size and Forecast 2024-2028

Published: Apr 2024 173 Pages SKU: IRTNTR77853

Market Overview at a Glance

$4.15 B
Market Opportunity
4.57%
CAGR
4.15
YoY growth 2023-2024(%)

Food Texture Market Size 2024-2028

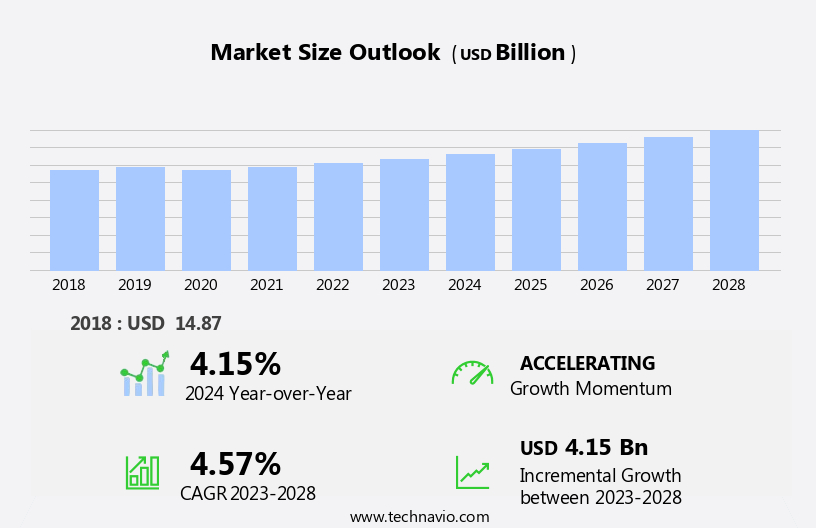
The food texture market size is forecast to increase by USD 4.15 billion, at a CAGR of 4.57% between 2023 and 2028.

  • The market is experiencing significant growth due to the increasing demand for food products with extended shelf lives. This trend is driven by the evolving consumer preferences for convenience and longer product durability. Furthermore, strategic alliances among market companies are shaping the competitive landscape, as companies collaborate to innovate and expand their offerings. Another key factor influencing the market is the rising demand for clean-label and natural ingredients in food products. Consumers are increasingly seeking healthier and more natural food options, leading to a growing demand for texturizers derived from natural sources.
  • This trend presents both opportunities and challenges for market participants. While the shift towards natural ingredients offers potential for differentiation and increased consumer appeal, it also requires significant investment in research and development to source and produce these alternatives. Companies must navigate this challenge effectively to remain competitive and meet evolving consumer demands.

What will be the Size of the Food Texture Market during the forecast period?

Food Texture Market Size

Explore in-depth regional segment analysis with market size data - historical 2018-2022 and forecasts 2024-2028 - in the full report.  
Request Free Sample

The market continues to evolve, driven by advancements in emulsion stability analysis, texture-based product design, and the exploration of food ingredient interactions. Starch gelatinization kinetics, particle size distribution, and mastication simulation are integral to understanding the behavior of food systems. Instrumental texture analysis, employing data analysis techniques, texture modification techniques, and strategies, shear force measurement, texture perception models, and rheological properties measurement, provide valuable insights into food structure and mouthfeel attributes. Rheometer calibration and consumer acceptability testing are crucial components of the texture analysis process. Sensory panel selection, sensory data analysis, water holding capacity, and sample preparation protocols are essential considerations for mouthfeel characterization.

Viscoelasticity determination, texture profile analysis, food microstructure imaging, and sensory evaluation methods contribute to the comprehensive understanding of food texture. Optimal processing parameters, sensory attribute mapping, and consumer texture preference are essential factors in food product development. The ongoing research and development in this field aim to provide innovative solutions for enhancing food texture and improving consumer satisfaction. The continuous unfolding of market activities and evolving patterns reflect the dynamic nature of the market.

How is this Food Texture Industry segmented?

The food texture industry research report provides comprehensive data (region-wise segment analysis), with forecasts and estimates in "USD billion" for the period 2024-2028, as well as historical data from 2018-2022 for the following segments.

  • Product
    • Cellulose derivatives
    • GPG
    • Starch
    • Others
  • Source
    • Natural
    • Synthetic
  • Type
    • Gelling Agents
    • Emulsifiers
    • Stabilizers
    • Thickeners
    • Others
  • Application
    • Bakery
    • Dairy
    • Confectionery
    • Meat Products
    • Beverages
  • Geography
    • North America
      • Canada
      • Mexico
    • Europe
      • France
      • Germany
      • UK
    • Middle East and Africa
      • UAE
    • APAC
      • China
      • India
      • Indonesia
      • Japan
      • Malaysia
      • South Korea
      • Thailand
    • South America
      • Brazil
    • Rest of World (ROW)

By Product Insights

The cellulose derivatives segment is estimated to witness significant growth during the forecast period.

The market is experiencing significant advancements, with a focus on emulsion stability analysis, texture-based product design, and food ingredient interactions. Cellulose derivatives, derived from natural sources and modified to enhance thickening, gelling, stabilizing, and emulsifying properties, are driving growth in this sector. Methylcellulose, carboxymethylcellulose (CMC), hydroxypropyl methylcellulose (HPMC), and microcrystalline cellulose (MCC) are commonly used cellulose derivatives in food applications. Their utilization in dairy, bakery, sauces, dressings, confectionery, and meat products improves texture, mouthfeel, shelf-life stability, and consumer acceptability. Starch gelatinization kinetics and particle size distribution are also crucial factors influencing food texture. Mastication simulation, compressive strength testing, gel strength analysis, and fat crystallization behavior are essential techniques for understanding texture properties.

Instrumental texture analysis, data analysis techniques, and texture modification strategies are employed to optimize processing parameters and sensory attribute mapping. Consumer texture preference is a critical consideration in food product development, and sensory evaluation methods are used to assess mouthfeel characterization, viscoelasticity determination, texture profile analysis, and food microstructure imaging. Rheological properties measurement and rheometer calibration ensure accurate texture analysis. Sensory panel selection and sensory data analysis are integral to consumer acceptability testing. Water holding capacity and sample preparation protocols are essential considerations in food texture research.

Food Texture Market Size

Request Free Sample

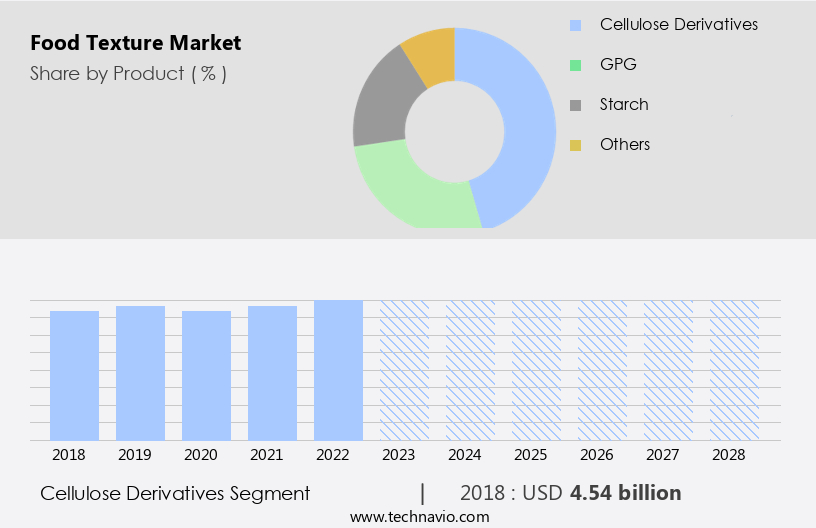
The Cellulose derivatives segment was valued at USD 4.54 billion in 2018 and showed a gradual increase during the forecast period.

Regional Analysis

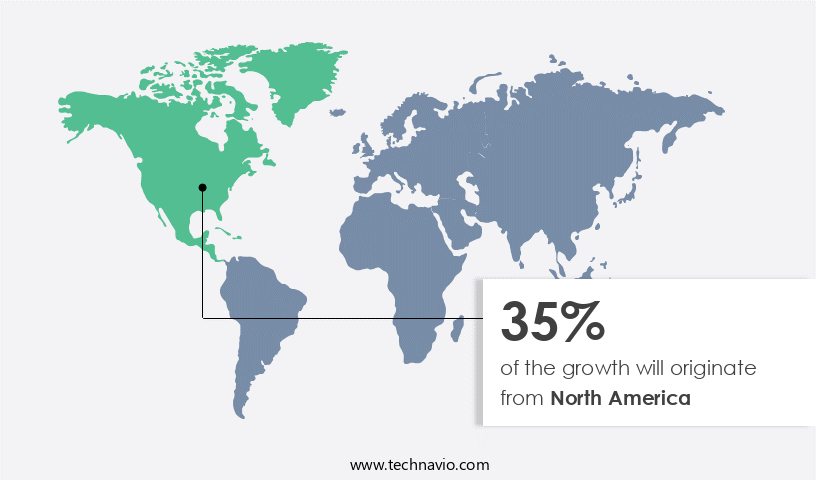
North America is estimated to contribute 35% to the growth of the global market during the forecast period.Technavio's analysts have elaborately explained the regional trends and drivers that shape the market during the forecast period.

Food Texture Market Share by Geography

 Request Free Sample

The market in North America is experiencing steady growth due to increasing consumer preference for healthier food options, leading to a higher demand for fat replacers, emulsifiers, and other functional ingredients. This trend is particularly prominent in the US market. However, the use of unhealthy food texture products may hinder market growth. companies such as Archer Daniels Midland Co., Cargill Inc., and Ingredion Inc. Are expanding their production capacities to meet the growing demand for food texture products. These capacity expansions could accelerate market growth in North America during the forecast period. Texture-based product design plays a crucial role in food product development, with food ingredient interactions and starch gelatinization kinetics being essential considerations.

Instrumental texture analysis, including techniques such as compressive strength testing, gel strength analysis, and shear force measurement, are used to evaluate food texture properties. Mouthfeel attributes, including viscoelasticity determination and texture profile analysis, are also essential in food texture research. Texture modification techniques and strategies, such as particle size distribution, mastication simulation, and protein network formation, are employed to optimize food texture. Rheological properties measurement and rheometer calibration are essential for understanding the behavior of food textures. Consumer acceptability testing, sensory panel selection, and sensory data analysis are crucial in ensuring consumer texture preference and optimal processing parameters. Water holding capacity and sample preparation protocols are also essential aspects of food texture research.

Food microstructure imaging and sensory evaluation methods provide valuable insights into food texture characteristics, enabling companies to develop innovative and high-quality food texture products. Overall, the market in North America is expected to continue growing as companies invest in research and development to meet the evolving consumer demand for healthier and more innovative food products.

Market Dynamics

Our researchers analyzed the data with 2023 as the base year, along with the key drivers, trends, and challenges. A holistic analysis of drivers will help companies refine their marketing strategies to gain a competitive advantage.

The market continues to evolve, with ongoing research focusing on the impact of ingredient ratios and rheological properties in shaping desirable textures for various food applications. Consumer perception plays a significant role in the food texture landscape, as sensory attributes such as mouthfeel, viscosity, and elasticity are increasingly prioritized. Instrumental techniques and methods for evaluating food texture changes are essential in understanding the correlations between instrumental and sensory assessments. Microstructural characteristics and optimal processing conditions are also critical factors in achieving desired textures. As food microstructure and sensory texture continue to intertwine, techniques for improving food texture stability and understanding consumer preferences become increasingly important. Ingredient interactions and moisture content also significantly influence texture formation, while rheological models and predictive analyses help in measuring food texture changes during storage and in different food matrices. Temperature's impact on food texture stability is also a significant consideration, highlighting the intricate relationship between food composition and texture properties.

What are the key market drivers leading to the rise in the adoption of Food Texture Industry?

  • The surge in demand for food texture solutions that enhance the shelf stability of food products serves as the primary market driver. The market experiences significant growth due to the increasing demand for food products with extended shelf-life and desirable textures. Consumers' preference for convenient, ready-to-eat options intensifies the need for food items that maintain their freshness and sensory appeal. Texture-modifying ingredients, including stabilizers, gums, and emulsifiers, play a crucial role in enhancing food products' structural integrity and moisture retention properties. These ingredients help delay spoilage and preserve food quality during storage. Emulsion stability analysis, particle size distribution, and starch gelatinization kinetics are essential factors in texture-based product design. Mastication simulation, compressive strength testing, gel strength analysis, and fat crystallization behavior are other critical considerations in ensuring the desired texture and stability of food products.
  • Food ingredient interactions are also vital in creating the optimal texture and preserving the food's freshness. By focusing on these factors, food manufacturers can produce high-quality, texturally appealing, and longer-lasting food items that meet consumers' expectations.

What are the market trends shaping the Food Texture Industry?

  • The emergence of strategic alliances among market companies represents a significant market trend. This development reflects the increasing recognition of the benefits derived from collaborative business relationships.
  • The market experiences significant growth due to the increasing number of strategic alliances among companies. These collaborations enable companies to combine their expertise, resources, and technologies, resulting in the development of innovative texture-enhancing solutions. By partnering with other companies, firms can access a broader range of ingredients, processing techniques, and market insights, leading to the creation of superior food texture-modifying products. Moreover, strategic alliances facilitate entry into new distribution channels and market segments, expanding market reach and penetration. With competition intensifying and the demand for texture-enhanced food products continuing to rise, these collaborations are essential for driving innovation, market expansion, and overall growth within the market.
  • Instrumental texture analysis, data analysis techniques, texture modification techniques, and rheological properties measurement play crucial roles in enhancing food texture. companies employ texture perception models and shear force measurement to ensure the desired mouthfeel attributes are achieved. These strategies contribute to the development of harmonious and immersive food textures that cater to diverse consumer preferences and market demands.

What challenges does the Food Texture Industry face during its growth?

  • The food industry faces significant growth challenges due to escalating consumer preferences for clean-label and natural ingredients in food products. 
  • The market experiences significant growth due to the increasing consumer preference for clean-label and natural ingredients. With health consciousness on the rise, consumers are becoming more discerning about the ingredients in their food, leading to a demand for minimally processed, recognizable ingredients with simple and transparent labels. This trend necessitates food manufacturers to reformulate their products, replacing synthetic or chemically modified texture agents with natural alternatives. However, finding suitable natural substitutes that can replicate the functionality and performance of synthetic ingredients while maintaining the desired texture, stability, and sensory attributes is a challenge for food formulators.
  • To address this challenge, advanced technologies such as rheometer calibration, consumer acceptability testing, texture analyzer setup, sensory panel selection, sensory data analysis, and sample preparation protocols are employed. These techniques enable food manufacturers to evaluate the water holding capacity, mouthfeel characterization, and viscoelasticity determination of their formulations accurately. By utilizing these methods, food formulators can ensure the development of textured food products that meet consumer preferences while maintaining product quality and functionality.

Exclusive Customer Landscape

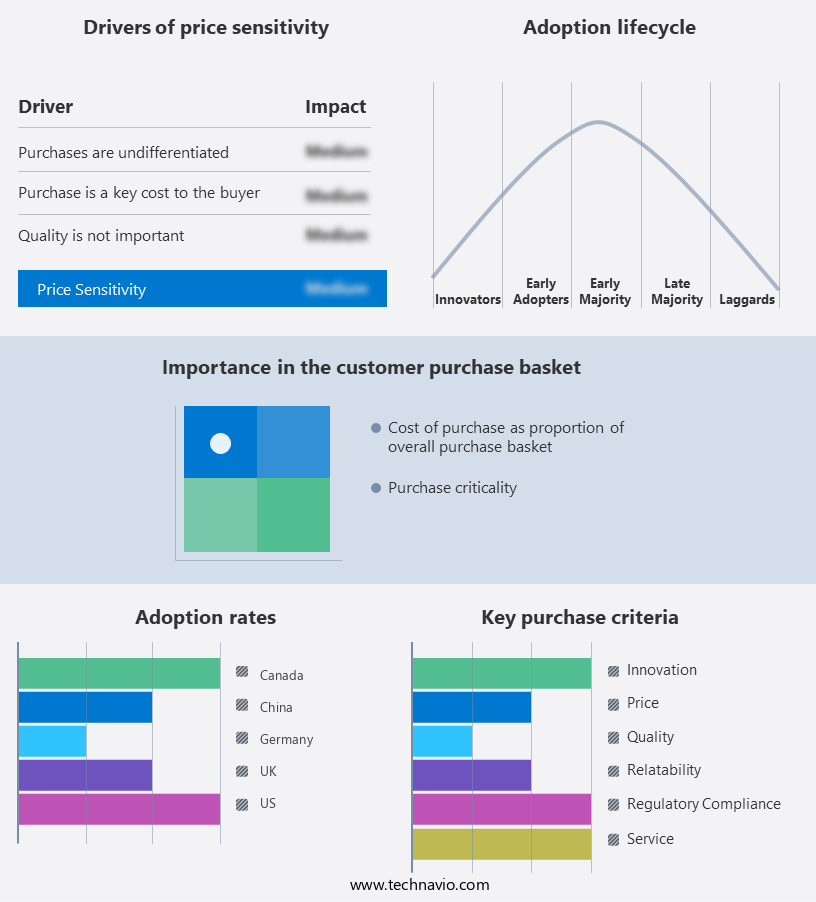
The food texture market forecasting report includes the adoption lifecycle of the market, covering from the innovator's stage to the laggard's stage. It focuses on adoption rates in different regions based on penetration. Furthermore, the food texture market report also includes key purchase criteria and drivers of price sensitivity to help companies evaluate and develop their market growth analysis strategies.

Food Texture Market Share by Geography

 Customer Landscape

Key Companies & Market Insights

Companies are implementing various strategies, such as strategic alliances, food texture market forecast, partnerships, mergers and acquisitions, geographical expansion, and product/service launches, to enhance their presence in the industry.

Ajinomoto Co. Inc. - This company specializes in providing innovative food texturizing solutions for various industries, including Soups, Beverages, Bakery, Confectionery, Dairy, Meat, Poultry and Seafood, Plant-Based Proteins, Ready Meals, Sauces, Dressings and Condiments, and Savory Snacks. Their offerings enhance product quality and consumer experience by addressing texture-related challenges.

The industry research and growth report includes detailed analyses of the competitive landscape of the market and information about key companies, including:

  • Ajinomoto Co. Inc.
  • Archer Daniels Midland Co.
  • Ashland Inc.
  • CP Kelco US Inc.
  • Deosen Biochemical (Ordos) Ltd.
  • Estelle Chemicals Pvt. Ltd.
  • Fiberstar Inc.
  • Ingredion Inc.
  • International Flavors and Fragrances Inc
  • JELU WERK J. Ehrler GmbH and Co. KG
  • Jungbunzlauer Suisse AG
  • Kerry Group Plc
  • Koninklijke DSM NV
  • Levapan S.A.
  • Riken Vitamin Co. Ltd.
  • Royal Avebe
  • SELECTAROME
  • Tate and Lyle PLC
  • Willy Benecke GmbH
  • Cargill Inc.

Qualitative and quantitative analysis of companies has been conducted to help clients understand the wider business environment as well as the strengths and weaknesses of key industry players. Data is qualitatively analyzed to categorize companies as pure play, category-focused, industry-focused, and diversified; it is quantitatively analyzed to categorize companies as dominant, leading, strong, tentative, and weak.

Recent Development and News in Food Texture Market

  • In January 2024, Danish food company, Arla Foods, announced the launch of its new line of textured vegetable proteins, named "Vegi-Tex," to cater to the growing demand for plant-based alternatives in the food industry (Arla Foods Press Release, 2024). This expansion marks a strategic move to diversify its product portfolio and tap into the burgeoning plant-based food market.
  • In March 2024, Ingredion Incorporated, a leading global provider of ingredient solutions, entered into a strategic partnership with Meatless Farm, a UK-based producer of plant-based meat alternatives, to develop innovative textured plant proteins for various food applications (Ingredion Incorporated Press Release, 2024). This collaboration aims to leverage Ingredion's texturizing expertise and Meatless Farm's market knowledge to create high-quality, sustainable plant-based products.
  • In May 2024, DuPont Nutrition & Biosciences, a leading global biotech company, announced a significant investment of USD100 million in its texturized soy protein production facility in the United States (DuPont Nutrition & Biosciences Press Release, 2024). This expansion is expected to increase the company's production capacity by 50%, solidifying its position as a key player in the textured protein market.
  • In April 2025, the European Commission approved the use of plant-based textured proteins derived from pea and soy in the production of meat alternatives, paving the way for a more diverse and sustainable food industry in Europe (European Commission Press Release, 2025). This regulatory approval is expected to boost the growth of the textured protein market in Europe, as it opens up new opportunities for companies to develop and market innovative plant-based products.

Research Analyst Overview

  • The market is characterized by a significant focus on optimizing food material rheology through advanced techniques such as emulsion droplet size analysis and rheological characterization. Texture optimization strategies employ experimental design methods to understand the impact of processing technology on gel network properties and product formulation. Consumer acceptance studies and sensory descriptive analysis play a crucial role in texture-based quality control. Instrumental texture profile and shear stress measurement are essential tools for quality assurance protocols. Viscoelastic food structure analysis is a key trend, with researchers exploring protein denaturation effects on compressive force profile and mouthfeel evaluation. Sensory attribute scaling and panel training are integral to consumer preference mapping.
  • Statistical data analysis is employed to understand the relationship between sensory perception and food microstructure. Furthermore, starch granule morphology and fat crystal polymorphism are essential factors influencing texture perception science. The market is continually evolving, with ongoing research in texture sensory evaluation and sensory panel training to enhance the overall consumer experience.

Dive into Technavio's robust research methodology, blending expert interviews, extensive data synthesis, and validated models for unparalleled Food Texture Market insights. See full methodology.

Market Scope

Report Coverage

Details

Page number

173

Base year

2023

Historic period

2018-2022

Forecast period

2024-2028

Growth momentum & CAGR

Accelerate at a CAGR of 4.57%

Market growth 2024-2028

USD 4.15 billion

Market structure

Fragmented

YoY growth 2023-2024(%)

4.15

Key countries

US, Malaysia, Indonesia, Germany, UK, South Korea, France, Canada, Brazil, Thailand, UAE, Mexico, China, Japan, and India

Competitive landscape

Leading Companies, Market Positioning of Companies, Competitive Strategies, and Industry Risks

Request Free Sample

What are the Key Data Covered in this Food Texture Market Research and Growth Report?

  • CAGR of the Food Texture industry during the forecast period
  • Detailed information on factors that will drive the growth and forecasting between 2024 and 2028
  • Precise estimation of the size of the market and its contribution of the industry in focus to the parent market
  • Accurate predictions about upcoming growth and trends and changes in consumer behaviour
  • Growth of the market across North America, Europe, APAC, South America, and Middle East and Africa
  • Thorough analysis of the market's competitive landscape and detailed information about companies
  • Comprehensive analysis of factors that will challenge the food texture market growth of industry companies

We can help! Our analysts can customize this food texture market research report to meet your requirements.

Get in touch

1 Executive Summary

  • 1.1 Market overview
    • Exhibit 01: Executive Summary – Chart on Market Overview
    • Exhibit 02: Executive Summary – Data Table on Market Overview
    • Exhibit 03: Executive Summary – Chart on Global Market Characteristics
    • Exhibit 04: Executive Summary – Chart on Market by Geography
    • Exhibit 05: Executive Summary – Chart on Market Segmentation by Product
    • Exhibit 06: Executive Summary – Chart on Market Segmentation by Source
    • Exhibit 07: Executive Summary – Chart on Incremental Growth
    • Exhibit 08: Executive Summary – Data Table on Incremental Growth
    • Exhibit 09: Executive Summary – Chart on Vendor Market Positioning

2 Market Landscape

  • 2.1 Market ecosystem
    • Exhibit 10: Parent market
    • Exhibit 11: Market Characteristics

3 Market Sizing

  • 3.1 Market definition
    • Exhibit 12: Offerings of vendors included in the market definition
  • 3.2 Market segment analysis
    • Exhibit 13: Market segments
  • 3.3 Market size 2023
    • 3.4 Market outlook: Forecast for 2023-2028
      • Exhibit 14: Chart on Global - Market size and forecast 2023-2028 ($ billion)
      • Exhibit 15: Data Table on Global - Market size and forecast 2023-2028 ($ billion)
      • Exhibit 16: Chart on Global Market: Year-over-year growth 2023-2028 (%)
      • Exhibit 17: Data Table on Global Market: Year-over-year growth 2023-2028 (%)

    4 Historic Market Size

    • 4.1 Global food texture market 2018 - 2022
      • Exhibit 18: Historic Market Size – Data Table on global food texture market 2018 - 2022 ($ billion)
    • 4.2 Product Segment Analysis 2018 - 2022
      • Exhibit 19: Historic Market Size – Product Segment 2018 - 2022 ($ billion)
    • 4.3 Source Segment Analysis 2018 - 2022
      • Exhibit 20: Historic Market Size – Source Segment 2018 - 2022 ($ billion)
    • 4.4 Geography Segment Analysis 2018 - 2022
      • Exhibit 21: Historic Market Size – Geography Segment 2018 - 2022 ($ billion)
    • 4.5 Country Segment Analysis 2018 - 2022
      • Exhibit 22: Historic Market Size – Country Segment 2018 - 2022 ($ billion)

    5 Five Forces Analysis

    • 5.1 Five forces summary
      • Exhibit 23: Five forces analysis - Comparison between 2023 and 2028
    • 5.2 Bargaining power of buyers
      • Exhibit 24: Chart on Bargaining power of buyers – Impact of key factors 2023 and 2028
    • 5.3 Bargaining power of suppliers
      • Exhibit 25: Bargaining power of suppliers – Impact of key factors in 2023 and 2028
    • 5.4 Threat of new entrants
      • Exhibit 26: Threat of new entrants – Impact of key factors in 2023 and 2028
    • 5.5 Threat of substitutes
      • Exhibit 27: Threat of substitutes – Impact of key factors in 2023 and 2028
    • 5.6 Threat of rivalry
      • Exhibit 28: Threat of rivalry – Impact of key factors in 2023 and 2028
    • 5.7 Market condition
      • Exhibit 29: Chart on Market condition - Five forces 2023 and 2028

    6 Market Segmentation by Product

    • 6.1 Market segments
      • Exhibit 30: Chart on Product - Market share 2023-2028 (%)
      • Exhibit 31: Data Table on Product - Market share 2023-2028 (%)
    • 6.2 Comparison by Product
      • Exhibit 32: Chart on Comparison by Product
      • Exhibit 33: Data Table on Comparison by Product
    • 6.3 Cellulose derivatives - Market size and forecast 2023-2028
      • Exhibit 34: Chart on Cellulose derivatives - Market size and forecast 2023-2028 ($ billion)
      • Exhibit 35: Data Table on Cellulose derivatives - Market size and forecast 2023-2028 ($ billion)
      • Exhibit 36: Chart on Cellulose derivatives - Year-over-year growth 2023-2028 (%)
      • Exhibit 37: Data Table on Cellulose derivatives - Year-over-year growth 2023-2028 (%)
    • 6.4 GPG - Market size and forecast 2023-2028
      • Exhibit 38: Chart on GPG - Market size and forecast 2023-2028 ($ billion)
      • Exhibit 39: Data Table on GPG - Market size and forecast 2023-2028 ($ billion)
      • Exhibit 40: Chart on GPG - Year-over-year growth 2023-2028 (%)
      • Exhibit 41: Data Table on GPG - Year-over-year growth 2023-2028 (%)
    • 6.5 Starch - Market size and forecast 2023-2028
      • Exhibit 42: Chart on Starch - Market size and forecast 2023-2028 ($ billion)
      • Exhibit 43: Data Table on Starch - Market size and forecast 2023-2028 ($ billion)
      • Exhibit 44: Chart on Starch - Year-over-year growth 2023-2028 (%)
      • Exhibit 45: Data Table on Starch - Year-over-year growth 2023-2028 (%)
    • 6.6 Others - Market size and forecast 2023-2028
      • Exhibit 46: Chart on Others - Market size and forecast 2023-2028 ($ billion)
      • Exhibit 47: Data Table on Others - Market size and forecast 2023-2028 ($ billion)
      • Exhibit 48: Chart on Others - Year-over-year growth 2023-2028 (%)
      • Exhibit 49: Data Table on Others - Year-over-year growth 2023-2028 (%)
    • 6.7 Market opportunity by Product
      • Exhibit 50: Market opportunity by Product ($ billion)
      • Exhibit 51: Data Table on Market opportunity by Product ($ billion)

    7 Market Segmentation by Source

    • 7.1 Market segments
      • Exhibit 52: Chart on Source - Market share 2023-2028 (%)
      • Exhibit 53: Data Table on Source - Market share 2023-2028 (%)
    • 7.2 Comparison by Source
      • Exhibit 54: Chart on Comparison by Source
      • Exhibit 55: Data Table on Comparison by Source
    • 7.3 Natural - Market size and forecast 2023-2028
      • Exhibit 56: Chart on Natural - Market size and forecast 2023-2028 ($ billion)
      • Exhibit 57: Data Table on Natural - Market size and forecast 2023-2028 ($ billion)
      • Exhibit 58: Chart on Natural - Year-over-year growth 2023-2028 (%)
      • Exhibit 59: Data Table on Natural - Year-over-year growth 2023-2028 (%)
    • 7.4 Synthetic - Market size and forecast 2023-2028
      • Exhibit 60: Chart on Synthetic - Market size and forecast 2023-2028 ($ billion)
      • Exhibit 61: Data Table on Synthetic - Market size and forecast 2023-2028 ($ billion)
      • Exhibit 62: Chart on Synthetic - Year-over-year growth 2023-2028 (%)
      • Exhibit 63: Data Table on Synthetic - Year-over-year growth 2023-2028 (%)
    • 7.5 Market opportunity by Source
      • Exhibit 64: Market opportunity by Source ($ billion)
      • Exhibit 65: Data Table on Market opportunity by Source ($ billion)

    8 Customer Landscape

    • 8.1 Customer landscape overview
      • Exhibit 66: Analysis of price sensitivity, lifecycle, customer purchase basket, adoption rates, and purchase criteria

    9 Geographic Landscape

    • 9.1 Geographic segmentation
      • Exhibit 67: Chart on Market share by geography 2023-2028 (%)
      • Exhibit 68: Data Table on Market share by geography 2023-2028 (%)
    • 9.2 Geographic comparison
      • Exhibit 69: Chart on Geographic comparison
      • Exhibit 70: Data Table on Geographic comparison
    • 9.3 North America - Market size and forecast 2023-2028
      • Exhibit 71: Chart on North America - Market size and forecast 2023-2028 ($ billion)
      • Exhibit 72: Data Table on North America - Market size and forecast 2023-2028 ($ billion)
      • Exhibit 73: Chart on North America - Year-over-year growth 2023-2028 (%)
      • Exhibit 74: Data Table on North America - Year-over-year growth 2023-2028 (%)
    • 9.4 Europe - Market size and forecast 2023-2028
      • Exhibit 75: Chart on Europe - Market size and forecast 2023-2028 ($ billion)
      • Exhibit 76: Data Table on Europe - Market size and forecast 2023-2028 ($ billion)
      • Exhibit 77: Chart on Europe - Year-over-year growth 2023-2028 (%)
      • Exhibit 78: Data Table on Europe - Year-over-year growth 2023-2028 (%)
    • 9.5 APAC - Market size and forecast 2023-2028
      • Exhibit 79: Chart on APAC - Market size and forecast 2023-2028 ($ billion)
      • Exhibit 80: Data Table on APAC - Market size and forecast 2023-2028 ($ billion)
      • Exhibit 81: Chart on APAC - Year-over-year growth 2023-2028 (%)
      • Exhibit 82: Data Table on APAC - Year-over-year growth 2023-2028 (%)
    • 9.6 South America - Market size and forecast 2023-2028
      • Exhibit 83: Chart on South America - Market size and forecast 2023-2028 ($ billion)
      • Exhibit 84: Data Table on South America - Market size and forecast 2023-2028 ($ billion)
      • Exhibit 85: Chart on South America - Year-over-year growth 2023-2028 (%)
      • Exhibit 86: Data Table on South America - Year-over-year growth 2023-2028 (%)
    • 9.7 Middle East and Africa - Market size and forecast 2023-2028
      • Exhibit 87: Chart on Middle East and Africa - Market size and forecast 2023-2028 ($ billion)
      • Exhibit 88: Data Table on Middle East and Africa - Market size and forecast 2023-2028 ($ billion)
      • Exhibit 89: Chart on Middle East and Africa - Year-over-year growth 2023-2028 (%)
      • Exhibit 90: Data Table on Middle East and Africa - Year-over-year growth 2023-2028 (%)
    • 9.8 US - Market size and forecast 2023-2028
      • Exhibit 91: Chart on US - Market size and forecast 2023-2028 ($ billion)
      • Exhibit 92: Data Table on US - Market size and forecast 2023-2028 ($ billion)
      • Exhibit 93: Chart on US - Year-over-year growth 2023-2028 (%)
      • Exhibit 94: Data Table on US - Year-over-year growth 2023-2028 (%)
    • 9.9 China - Market size and forecast 2023-2028
      • Exhibit 95: Chart on China - Market size and forecast 2023-2028 ($ billion)
      • Exhibit 96: Data Table on China - Market size and forecast 2023-2028 ($ billion)
      • Exhibit 97: Chart on China - Year-over-year growth 2023-2028 (%)
      • Exhibit 98: Data Table on China - Year-over-year growth 2023-2028 (%)
    • 9.10 Canada - Market size and forecast 2023-2028
      • Exhibit 99: Chart on Canada - Market size and forecast 2023-2028 ($ billion)
      • Exhibit 100: Data Table on Canada - Market size and forecast 2023-2028 ($ billion)
      • Exhibit 101: Chart on Canada - Year-over-year growth 2023-2028 (%)
      • Exhibit 102: Data Table on Canada - Year-over-year growth 2023-2028 (%)
    • 9.11 Germany - Market size and forecast 2023-2028
      • Exhibit 103: Chart on Germany - Market size and forecast 2023-2028 ($ billion)
      • Exhibit 104: Data Table on Germany - Market size and forecast 2023-2028 ($ billion)
      • Exhibit 105: Chart on Germany - Year-over-year growth 2023-2028 (%)
      • Exhibit 106: Data Table on Germany - Year-over-year growth 2023-2028 (%)
    • 9.12 UK - Market size and forecast 2023-2028
      • Exhibit 107: Chart on UK - Market size and forecast 2023-2028 ($ billion)
      • Exhibit 108: Data Table on UK - Market size and forecast 2023-2028 ($ billion)
      • Exhibit 109: Chart on UK - Year-over-year growth 2023-2028 (%)
      • Exhibit 110: Data Table on UK - Year-over-year growth 2023-2028 (%)
    • 9.13 Market opportunity by geography
      • Exhibit 111: Market opportunity by geography ($ billion)
      • Exhibit 112: Data Tables on Market opportunity by geography ($ billion)

    10 Drivers, Challenges, and Trends

    • 10.1 Market drivers
      • 10.2 Market challenges
        • 10.3 Impact of drivers and challenges
          • Exhibit 113: Impact of drivers and challenges in 2023 and 2028
        • 10.4 Market trends

          11 Vendor Landscape

          • 11.1 Overview
            • 11.2 Vendor landscape
              • Exhibit 114: Overview on Criticality of inputs and Factors of differentiation
            • 11.3 Landscape disruption
              • Exhibit 115: Overview on factors of disruption
            • 11.4 Industry risks
              • Exhibit 116: Impact of key risks on business

            12 Vendor Analysis

            • 12.1 Vendors covered
              • Exhibit 117: Vendors covered
            • 12.2 Market positioning of vendors
              • Exhibit 118: Matrix on vendor position and classification
            • 12.3 Ajinomoto Co. Inc.
              • Exhibit 119: Ajinomoto Co. Inc. - Overview
              • Exhibit 120: Ajinomoto Co. Inc. - Business segments
              • Exhibit 121: Ajinomoto Co. Inc. - Key offerings
              • Exhibit 122: Ajinomoto Co. Inc. - Segment focus
            • 12.4 Archer Daniels Midland Co.
              • Exhibit 123: Archer Daniels Midland Co. - Overview
              • Exhibit 124: Archer Daniels Midland Co. - Business segments
              • Exhibit 125: Archer Daniels Midland Co. - Key news
              • Exhibit 126: Archer Daniels Midland Co. - Key offerings
              • Exhibit 127: Archer Daniels Midland Co. - Segment focus
            • 12.5 Ashland Inc.
              • Exhibit 128: Ashland Inc. - Overview
              • Exhibit 129: Ashland Inc. - Business segments
              • Exhibit 130: Ashland Inc. - Key news
              • Exhibit 131: Ashland Inc. - Key offerings
              • Exhibit 132: Ashland Inc. - Segment focus
            • 12.6 Cargill Inc.
              • Exhibit 133: Cargill Inc. - Overview
              • Exhibit 134: Cargill Inc. - Product / Service
              • Exhibit 135: Cargill Inc. - Key news
              • Exhibit 136: Cargill Inc. - Key offerings
            • 12.7 CP Kelco US Inc.
              • Exhibit 137: CP Kelco US Inc. - Overview
              • Exhibit 138: CP Kelco US Inc. - Product / Service
              • Exhibit 139: CP Kelco US Inc. - Key offerings
            • 12.8 Deosen Biochemical (Ordos) Ltd.
              • Exhibit 140: Deosen Biochemical (Ordos) Ltd. - Overview
              • Exhibit 141: Deosen Biochemical (Ordos) Ltd. - Product / Service
              • Exhibit 142: Deosen Biochemical (Ordos) Ltd. - Key offerings
            • 12.9 Estelle Chemicals Pvt. Ltd.
              • Exhibit 143: Estelle Chemicals Pvt. Ltd. - Overview
              • Exhibit 144: Estelle Chemicals Pvt. Ltd. - Product / Service
              • Exhibit 145: Estelle Chemicals Pvt. Ltd. - Key offerings
            • 12.10 Fiberstar Inc.
              • Exhibit 146: Fiberstar Inc. - Overview
              • Exhibit 147: Fiberstar Inc. - Product / Service
              • Exhibit 148: Fiberstar Inc. - Key offerings
            • 12.11 Ingredion Inc.
              • Exhibit 149: Ingredion Inc. - Overview
              • Exhibit 150: Ingredion Inc. - Business segments
              • Exhibit 151: Ingredion Inc. - Key offerings
              • Exhibit 152: Ingredion Inc. - Segment focus
            • 12.12 International Flavors and Fragrances Inc
              • Exhibit 153: International Flavors and Fragrances Inc - Overview
              • Exhibit 154: International Flavors and Fragrances Inc - Business segments
              • Exhibit 155: International Flavors and Fragrances Inc - Key news
              • Exhibit 156: International Flavors and Fragrances Inc - Key offerings
              • Exhibit 157: International Flavors and Fragrances Inc - Segment focus
            • 12.13 Kerry Group Plc
              • Exhibit 158: Kerry Group Plc - Overview
              • Exhibit 159: Kerry Group Plc - Business segments
              • Exhibit 160: Kerry Group Plc - Key offerings
              • Exhibit 161: Kerry Group Plc - Segment focus
            • 12.14 Koninklijke DSM NV
              • Exhibit 162: Koninklijke DSM NV - Overview
              • Exhibit 163: Koninklijke DSM NV - Business segments
              • Exhibit 164: Koninklijke DSM NV - Key news
              • Exhibit 165: Koninklijke DSM NV - Key offerings
              • Exhibit 166: Koninklijke DSM NV - Segment focus
            • 12.15 Riken Vitamin Co. Ltd.
              • Exhibit 167: Riken Vitamin Co. Ltd. - Overview
              • Exhibit 168: Riken Vitamin Co. Ltd. - Key offerings
            • 12.16 Royal Avebe
              • Exhibit 169: Royal Avebe - Overview
              • Exhibit 170: Royal Avebe - Product / Service
              • Exhibit 171: Royal Avebe - Key offerings
            • 12.17 Tate and Lyle PLC
              • Exhibit 172: Tate and Lyle PLC - Overview
              • Exhibit 173: Tate and Lyle PLC - Business segments
              • Exhibit 174: Tate and Lyle PLC - Key offerings
              • Exhibit 175: Tate and Lyle PLC - Segment focus

            13 Appendix

            • 13.1 Scope of the report
              • 13.2 Inclusions and exclusions checklist
                • Exhibit 176: Inclusions checklist
                • Exhibit 177: Exclusions checklist
              • 13.3 Currency conversion rates for US$
                • Exhibit 178: Currency conversion rates for US$
              • 13.4 Research methodology
                • Exhibit 179: Research methodology
                • Exhibit 180: Validation techniques employed for market sizing
                • Exhibit 181: Information sources
              • 13.5 List of abbreviations
                • Exhibit 182: List of abbreviations

              Research Methodology

              Technavio presents a detailed picture of the market by way of study, synthesis, and summation of data from multiple sources. The analysts have presented the various facets of the market with a particular focus on identifying the key industry influencers. The data thus presented is comprehensive, reliable, and the result of extensive research, both primary and secondary.

              INFORMATION SOURCES

              Primary sources

              • Manufacturers and suppliers
              • Channel partners
              • Industry experts
              • Strategic decision makers

              Secondary sources

              • Industry journals and periodicals
              • Government data
              • Financial reports of key industry players
              • Historical data
              • Press releases

              DATA ANALYSIS

              Data Synthesis

              • Collation of data
              • Estimation of key figures
              • Analysis of derived insights

              Data Validation

              • Triangulation with data models
              • Reference against proprietary databases
              • Corroboration with industry experts

              REPORT WRITING

              Qualitative

              • Market drivers
              • Market challenges
              • Market trends
              • Five forces analysis

              Quantitative

              • Market size and forecast
              • Market segmentation
              • Geographical insights
              • Competitive landscape

              Interested in this report?

              Get your sample now to see our research methodology and insights!

              Download Now

              Frequently Asked Questions

              Food Texture market growth will increase by $ 4.15 bn during 2024-2028.

              The Food Texture market is expected to grow at a CAGR of 4.57% during 2024-2028.

              Food Texture market is segmented by Product( Cellulose derivatives, GPG, Starch, Others) Source( Natural, Synthetic)

              Ajinomoto Co. Inc., Archer Daniels Midland Co., Ashland Inc., CP Kelco US Inc., Deosen Biochemical (Ordos) Ltd., Estelle Chemicals Pvt. Ltd., Fiberstar Inc., Ingredion Inc., International Flavors and Fragrances Inc, JELU WERK J. Ehrler GmbH and Co. KG, Jungbunzlauer Suisse AG, Kerry Group Plc, Koninklijke DSM NV, Levapan S.A., Riken Vitamin Co. Ltd., Royal Avebe, SELECTAROME, Tate and Lyle PLC, Willy Benecke GmbH, Cargill Inc. are a few of the key vendors in the Food Texture market.

              North America will register the highest growth rate of 35% among the other regions. Therefore, the Food Texture market in North America is expected to garner significant business opportunities for the vendors during the forecast period.

              US, Canada, China, Germany, UK

              • Rising demand for food texture products that extend shelf-life of food productsThe surge in demand for food texture products aimed at extending the shelf-life of food items is a significant catalyst propelling the growth of the global food texture market. The growing preference of consumers for convenient is the driving factor this market.
              • ready-to-eat food options has intensified the need for food products that not only have an appealing texture but also maintain their freshness over an extended period. Texture-modifying ingredients such as stabilizers is the driving factor this market.
              • gums is the driving factor this market.
              • and emulsifiers are instrumental in enhancing the structural integrity and moisture retention properties of various food products is the driving factor this market.
              • thereby delaying spoilage and preserving quality during storage. As food manufacturers strive to meet consumers' expectations for longer-lasting is the driving factor this market.
              • high-quality food items is the driving factor this market.
              • the adoption of texture-enhancing ingredients becomes imperative to extend the shelf-life of food products while maintaining their sensory appeal. Moreover is the driving factor this market.
              • with the increasing complexity of global supply chains and the rising demand for packaged and processed foods is the driving factor this market.
              • the role of texture-modifying ingredients in extending shelf-life has become even more important. These ingredients not only improve the texture and mouthfeel of food products but also contribute to their stability and resilience against environmental factors such as temperature fluctuations and physical handling during transportation and storage. By incorporating texture-enhancing agents into food formulations is the driving factor this market.
              • manufacturers can enhance product integrity is the driving factor this market.
              • reduce food waste is the driving factor this market.
              • and meet consumer demand for convenient is the driving factor this market.
              • longer-lasting food options. Consequently is the driving factor this market.
              • the rising demand for food texture products that extend the shelf-life of food products is driving innovation and investments in texture-modifying ingredients is the driving factor this market.
              • thereby fueling the growth and expansion of the global food texture market. Therefore is the driving factor this market.
              • the rising demand for food texture products that extend the shelf-life of food products will drive the growth of the global food texture market during the forecast period. is the driving factor this market.

              The Food Texture market vendors should focus on grabbing business opportunities from the Cellulose derivatives segment as it accounted for the largest market share in the base year.