Starch Market Analysis, Size, and Forecast 2024-2028: North America (US), Europe (France and Germany), APAC (China and India), and Rest of World (ROW)

Starch Market Analysis, Size, and Forecast 2024-2028:
North America (US), Europe (France and Germany), APAC (China and India), and Rest of World (ROW)

Published: Mar 2024 178 Pages SKU: IRTNTR77669

Market Overview at a Glance

$18.41 B
Market Opportunity
4.49%
CAGR
4.31
YoY growth 2023-2024(%)

Starch Market Size 2024-2028

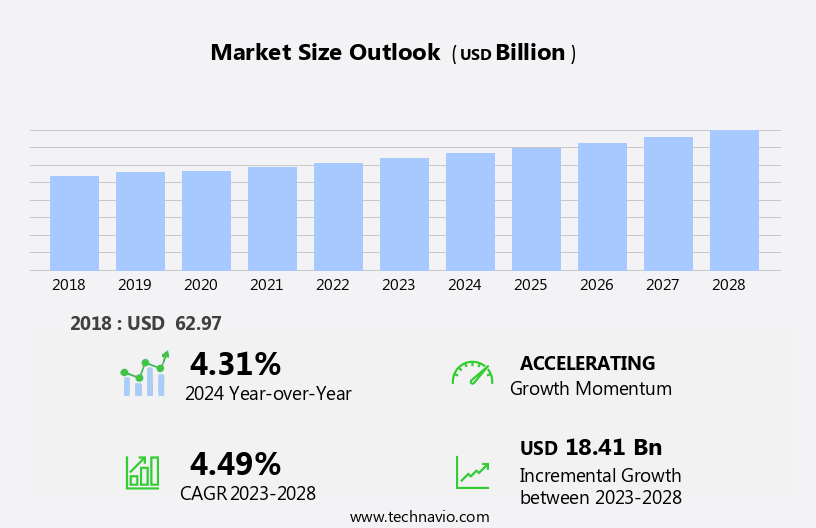
The starch market size is forecast to increase by USD 18.41 billion, at a CAGR of 4.49% between 2023 and 2028.

  • The market is characterized by robust demand for corn starch, driven by its cost-efficiency and versatility in various industries, including food and beverage, pharmaceuticals, and paper and textiles. The market's dynamics are further shaped by a strong distribution network between companies and buyers, ensuring seamless supply and demand alignment. However, this market landscape is not without challenges. The constant fluctuation in raw material prices of starch-derivatives poses significant risks to market participants. Producers must navigate this volatility through strategic sourcing and pricing strategies, while also investing in research and development to innovate and differentiate their offerings.
  • To capitalize on growth opportunities, companies should focus on expanding their product portfolios and exploring new applications for starch in emerging industries. Effective supply chain management and collaboration with key stakeholders will also be crucial in navigating the challenges and maintaining competitiveness in the market.

What will be the Size of the Starch Market during the forecast period?

Starch Market Size

Explore in-depth regional segment analysis with market size data - historical 2018-2022 and forecasts 2024-2028 - in the full report.  
Request Free Sample

The market continues to evolve, driven by the ongoing exploration of its diverse applications across various sectors. Starch derivatives, produced through hydrolysis, retrogradation, and chemical modification, expand the market's reach in industries such as food, textiles, and bioplastics. Retrogradation, a complex process influencing starch's rheological properties, plays a crucial role in the development of starch-based coatings and adhesives. Fermentation processes further broaden starch's utility, enabling the production of bioethanol and other value-added products. Functional starch properties, including amylose content and molecular weight, are essential in food applications, while rheological properties determine the performance of starch in industrial uses.

Native starch structure and morphology, including waxy maize starch and amylopectin structure, are subjects of ongoing research, leading to innovations in starch-based fibers and films. Processing methods, such as gelatinization and solubility adjustments, continue to be refined to optimize starch's performance in various applications. Starch degradation pathways and modified starch properties are essential areas of investigation, ensuring the continuous improvement of starch-based materials. The dynamic nature of the market ensures a constant unfolding of market activities and evolving patterns, making it an exciting area for innovation and growth.

How is this Starch Industry segmented?

The starch industry research report provides comprehensive data (region-wise segment analysis), with forecasts and estimates in "USD billion" for the period 2024-2028, as well as historical data from 2018-2022 for the following segments.

  • Type
    • Corn
    • Potato
    • Tapioca
    • Wheat
    • Others
  • End-user
    • Retail
    • Industry (B2B)
    • Animal feed
  • Source
    • Corn
    • Wheat
    • Potato
    • Cassava
    • Others
  • Geography
    • North America
      • US
    • Europe
      • France
      • Germany
    • APAC
      • China
      • India
    • Rest of World (ROW)

    By Type Insights

    The corn segment is estimated to witness significant growth during the forecast period.

    The market encompasses various applications and forms, including starch-based bioplastics, waxy maize starch, glucose syrup production, ethanol production, and starch derivatives. Starch granule morphology and amylase enzyme activity play crucial roles in starch processing methods, such as hydrolysis and gelatinization. Chemical starch modification and physical starch modification techniques are employed to enhance functional starch properties, including rheological properties, film properties, solubility, and viscosity. Starch-based coatings and adhesives are gaining popularity due to their biodegradability and sustainability. Starch fermentation and retrogradation are essential processes in the production of starch-based fibers and modified starches. Amylopectin structure and high amylose starch are key factors influencing starch's molecular weight and industrial uses.

    Food applications, such as bakery and confectionery, account for a significant portion of the market. The increasing demand for non-gluten or gluten-free goods due to celiac disease awareness and consumer preference for natural ingredients fuels the growth of the corn starch segment. Corn starch's high vitamin E content and use in blended bread production further boost its demand. Starch extraction techniques and amylose content analysis are essential for maintaining starch quality and ensuring consistent product performance.

    Starch Market Size

    Request Free Sample

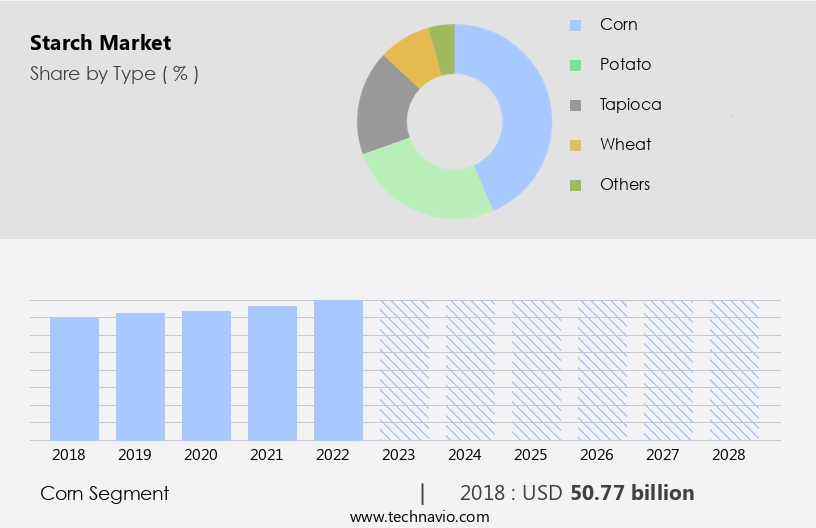
    The Corn segment was valued at USD 50.77 billion in 2018 and showed a gradual increase during the forecast period.

    Regional Analysis

    APAC is estimated to contribute 57% to the growth of the global market during the forecast period.Technavio’s analysts have elaborately explained the regional trends and drivers that shape the market during the forecast period.

    Starch Market Share by Geography

     Request Free Sample

    The market in Asia Pacific (APAC) is experiencing significant growth, driven by the surging demand from key countries like India and China. India, known for its agricultural prowess, presents a substantial opportunity for the global starch industry. The Indian food processing sector is a significant consumer of starch, with increasing government initiatives, such as the Pradhan Mantri Kisan Sampada Yojana (PMKSY), aimed at modernizing the industry. This project focuses on developing advanced food processing infrastructure, further boosting the demand for starch. Starch granule morphology and amylase enzyme activity are crucial factors influencing starch production. Waxy maize starch and glucose syrup are essential derivatives, with applications in various industries, including food, pharmaceuticals, and textiles.

    Chemical starch modification, ethanol production, and starch fermentation are other significant processes in the starch industry. Functional starch properties, rheological properties, and starch-based coatings are essential aspects of starch applications. Starch hydrolysis, amylose content analysis, and starch viscosity measurement are essential techniques used in the starch industry. Native starch structure, starch extraction techniques, and starch gelatinization are other essential factors influencing the market dynamics. The starch derivatives market, including high amylose starch and starch-based fibers, is a growing segment. Modified starch properties, starch film properties, and starch solubility are essential factors driving the demand for these derivatives.

    Starch-based adhesives and industrial starch uses are other significant applications. In conclusion, the market in APAC is poised for substantial growth due to the increasing demand from the food processing industry and government initiatives. The market is characterized by various processes, properties, and applications, making it a dynamic and evolving industry.

    Market Dynamics

    Our researchers analyzed the data with 2023 as the base year, along with the key drivers, trends, and challenges. A holistic analysis of drivers will help companies refine their marketing strategies to gain a competitive advantage.

    What are the key market drivers leading to the rise in the adoption of Starch Industry?

    • The significant demand for corn starch, recognized for its cost-efficiency, serves as the primary driver propelling the market forward. 

    • The market is experiencing significant growth due to the increasing demand for starch-based bioplastics and its extensive usage in various industries, particularly in food and beverage. Corn is the primary source of starch, making it an economically viable alternative to wheat and tapioca starches. The food industry utilizes corn starch for glucose syrup production and as a thickening agent in various food products. Moreover, the availability of corn in abundance, particularly in agriculture-rich countries, fuels market growth. Corn starch's versatility in applications, including chemical modification for ethanol production and starch processing methods such as hydrolysis, further boosts market expansion.
    • The lower price point of corn starch compared to other starches also contributes to its popularity. Amylase enzyme activity plays a crucial role in starch processing, converting starch into sugars. Waxy maize starch, a type of corn starch with high amylose content, is gaining popularity due to its unique properties. Overall, the market's growth is driven by its wide applications, the abundance of corn, and its cost-effectiveness.

    What are the market trends shaping the Starch Industry?

    • A robust distribution network connecting market companies and buyers is an emerging market trend. This link ensures efficient and effective exchange of goods and services.

    • The market is experiencing significant growth due to the increasing demand for starch derivatives in various industries. Key applications include starch-based coatings, adhesives, and rheological modifiers, which are utilized in packaging, paper, textile, and construction sectors. The food industry remains a major consumer of starch, particularly for its functional properties in baking and as a thickener. Starch fermentation is a key production process, leading to the development of new products with improved properties. Starch retrogradation, a natural process affecting starch's rheological properties, is being addressed through technological advancements, ensuring consistent product quality. Manufacturers prioritize strengthening distribution networks to cater to the expanding customer base, including supermarkets, retailers, and food service chains.
    • Establishing partnerships with these customers is crucial for market success. Institutional buyers, such as schools and hospitals, and fast food restaurants also represent significant opportunities. Key players in the market focus on innovation and product development to meet the evolving needs of their customers. This includes improving the nutritional value and sustainability of starch-based products, as well as expanding their product offerings to cater to diverse industries.

    What challenges does the Starch Industry face during its growth?

    • The starch-derivatives industry faces significant challenges due to the persistent volatility in the prices of raw materials. This fluctuation poses a significant threat to industry growth and requires continuous adaptation and strategic planning from industry players. 

    • The market experiences price fluctuations due to the natural variability of raw material sources, including potato, corn, tapioca, and rice. Weather and climate stability also impact the cost of acquiring these raw materials for starch production. Producers of starch derivatives, such as corn and tapioca, are influenced by these price fluctuations. Food crops serve as the primary raw materials for starch production. The uncertainty of raw material prices may cause hesitation among companies when setting prices for their starch derivatives and could lead to increased starch costs to maintain profitability.
    • Starch's molecular weight and structure, particularly amylopectin, significantly influence the properties of modified starches, starch-based fibers, and starch films. Understanding these factors is crucial for market participants to navigate the dynamic the market landscape.

    Exclusive Customer Landscape

    The starch market forecasting report includes the adoption lifecycle of the market, covering from the innovator’s stage to the laggard’s stage. It focuses on adoption rates in different regions based on penetration. Furthermore, the starch market report also includes key purchase criteria and drivers of price sensitivity to help companies evaluate and develop their market growth analysis strategies.
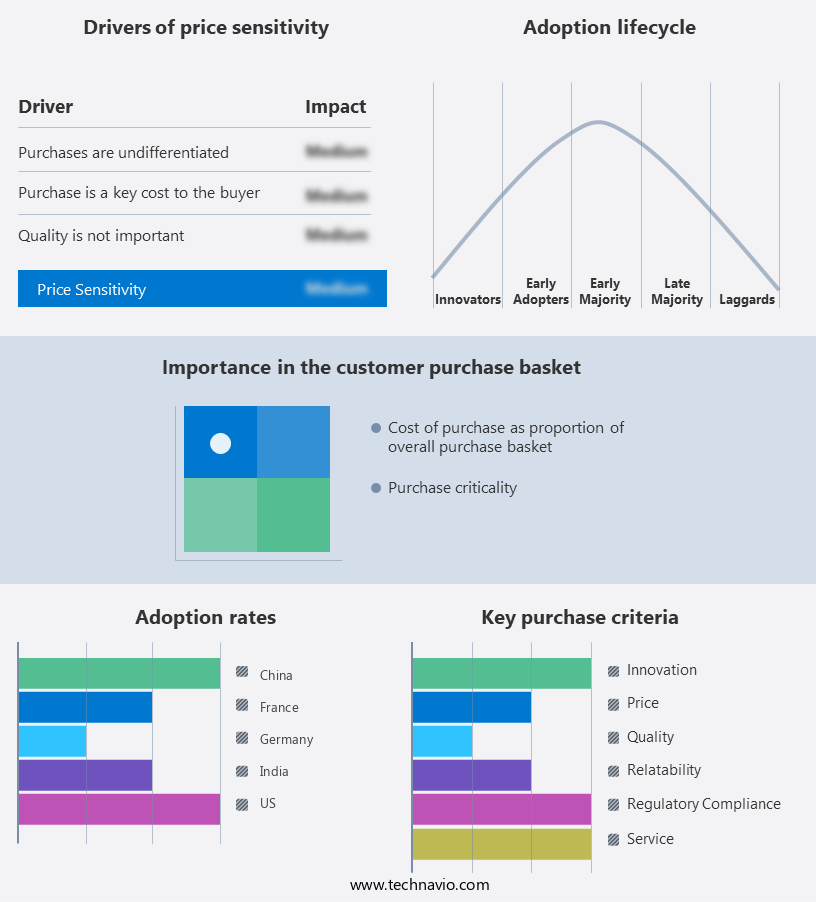
    Starch Market Share by Geography

     Customer Landscape

    Key Companies & Market Insights

    Companies are implementing various strategies, such as strategic alliances, starch market forecast, partnerships, mergers and acquisitions, geographical expansion, and product/service launches, to enhance their presence in the industry.

    AGRANA Beteiligungs AG - As a seasoned research analyst, I've closely monitored the company's strategic initiatives and financial performance. Their innovative product offerings and robust growth trajectory position them as a key player in the global industry landscape. The company's agile business model and commitment to R&D fuel its competitive edge. Despite economic uncertainties, the company's financials remain strong, underscoring its resilience and adaptability.

    The industry research and growth report includes detailed analyses of the competitive landscape of the market and information about key companies, including:

    • AGRANA Beteiligungs AG
    • Angel Starch and Food Pvt. Ltd.
    • Archer Daniels Midland Co.
    • Beneo GmbH
    • Cargill Inc.
    • Emsland Starke GmbH
    • Everest Starch India Pvt. Ltd.
    • Ingredion Inc.
    • Kent Corp.
    • Manildra Flour Mills Pty. Ltd.
    • MGP Ingredients Inc.
    • Roquette Freres SA
    • Royal Avebe
    • SPAC Starch Products India Pvt. Ltd.
    • SSPL
    • Tate and Lyle PLC
    • Thai Flour Industry Co. Ltd.
    • Varalakshmi Starch Industries P Ltd.
    • VIMAL PPCE
    • SMScor

    Qualitative and quantitative analysis of companies has been conducted to help clients understand the wider business environment as well as the strengths and weaknesses of key industry players. Data is qualitatively analyzed to categorize companies as pure play, category-focused, industry-focused, and diversified; it is quantitatively analyzed to categorize companies as dominant, leading, strong, tentative, and weak.

    Recent Development and News in Starch Market

    • In January 2024, Archer Daniels Midland Company (ADM) announced the launch of its new line of high-performance native starches, called ADMAMAZE™ 1450 and ADMAMAZE™ 1470, designed for improved texture and stability in various food and beverage applications. (ADM Press Release)
    • In March 2024, DuPont Nutrition & Biosciences and Ingredion Inc. Entered into a strategic partnership to co-develop and commercialize a range of specialty starches and sweeteners, combining DuPont's Danisco® and Ingredion's PureFibre® product lines. (DuPont Nutrition & Biosciences Press Release)
    • In May 2024, Cargill, a leading global starch producer, completed the acquisition of the European starch business of Roquette, significantly expanding its presence in the European the market. The deal was valued at €1.1 billion. (Cargill Press Release)
    • In April 2025, Tate & Lyle PLC received regulatory approval from the European Commission for its new corn wet milling facility in Poland, which will increase its European starch production capacity by 30%. (Tate & Lyle Press Release)

    Research Analyst Overview

    • The market encompasses a range of applications, from food and beverage to industrial sectors. One significant area of focus is starch liquefaction, which involves the use of heat and enzymes to modify starch's texture profile and improve its digestibility. Enzyme kinetics play a crucial role in this process, with starch debranching enzymes and amylase production key factors. Starch composition analysis is also essential, as variations in starch branching enzymes and synthase activity impact the final product's quality parameters. Starch-lipid interactions, drying methods, and storage stability are other critical aspects of the market.
    • Starch phosphorylation and cross-linking can enhance these properties, while starch acetylation and oxidation can alter sensory attributes. Innovations in starch microcapsules, nanocomposites, etherification, and purification further expand the market's potential. The starch-protein interactions and saccharification process are also subject to ongoing research, as these factors influence the overall functionality and performance of starch-based products.

    Dive into Technavio’s robust research methodology, blending expert interviews, extensive data synthesis, and validated models for unparalleled Starch Market insights. See full methodology.

    Market Scope

    Report Coverage

    Details

    Page number

    178

    Base year

    2023

    Historic period

    2018-2022

    Forecast period

    2024-2028

    Growth momentum & CAGR

    Accelerate at a CAGR of 4.49%

    Market growth 2024-2028

    USD 18.41 billion

    Market structure

    Fragmented

    YoY growth 2023-2024(%)

    4.31

    Key countries

    US, China, India, France, and Germany

    Competitive landscape

    Leading Companies, Market Positioning of Companies, Competitive Strategies, and Industry Risks

    Request Free Sample

    What are the Key Data Covered in this Starch Market Research and Growth Report?

    • CAGR of the Starch industry during the forecast period
    • Detailed information on factors that will drive the growth and forecasting between 2024 and 2028
    • Precise estimation of the size of the market and its contribution of the industry in focus to the parent market
    • Accurate predictions about upcoming growth and trends and changes in consumer behaviour
    • Growth of the market across APAC, North America, Europe, South America, and Middle East and Africa
    • Thorough analysis of the market’s competitive landscape and detailed information about companies
    • Comprehensive analysis of factors that will challenge the starch market growth of industry companies

    We can help! Our analysts can customize this starch market research report to meet your requirements.

    Get in touch


    1 Executive Summary

    • 1.1 Market overview
      • Exhibit 01: Executive Summary – Chart on Market Overview
      • Exhibit 02: Executive Summary – Data Table on Market Overview
      • Exhibit 03: Executive Summary – Chart on Global Market Characteristics
      • Exhibit 04: Executive Summary – Chart on Market by Geography
      • Exhibit 05: Executive Summary – Chart on Market Segmentation by Type
      • Exhibit 06: Executive Summary – Chart on Market Segmentation by End-user
      • Exhibit 07: Executive Summary – Chart on Incremental Growth
      • Exhibit 08: Executive Summary – Data Table on Incremental Growth
      • Exhibit 09: Executive Summary – Chart on Vendor Market Positioning

    2 Market Landscape

    • 2.1 Market ecosystem
      • Exhibit 10: Parent market
      • Exhibit 11: Market Characteristics

    3 Market Sizing

    • 3.1 Market definition
      • Exhibit 12: Offerings of vendors included in the market definition
    • 3.2 Market segment analysis
      • Exhibit 13: Market segments
    • 3.3 Market size 2023
      • 3.4 Market outlook: Forecast for 2023-2028
        • Exhibit 14: Chart on Global - Market size and forecast 2023-2028 ($ million)
        • Exhibit 15: Data Table on Global - Market size and forecast 2023-2028 ($ million)
        • Exhibit 16: Chart on Global Market: Year-over-year growth 2023-2028 (%)
        • Exhibit 17: Data Table on Global Market: Year-over-year growth 2023-2028 (%)

      4 Historic Market Size

      • 4.1 Global starch market 2018 - 2022
        • Exhibit 18: Historic Market Size – Data Table on global starch market 2018 - 2022 ($ million)
      • 4.2 Type Segment Analysis 2018 - 2022
        • Exhibit 19: Historic Market Size – Type Segment 2018 - 2022 ($ million)
      • 4.3 End-user Segment Analysis 2018 - 2022
        • Exhibit 20: Historic Market Size – End-user Segment 2018 - 2022 ($ million)
      • 4.4 Geography Segment Analysis 2018 - 2022
        • Exhibit 21: Historic Market Size – Geography Segment 2018 - 2022 ($ million)
      • 4.5 Country Segment Analysis 2018 - 2022
        • Exhibit 22: Historic Market Size – Country Segment 2018 - 2022 ($ million)
      • 4.6 Global starch market by Country 2023 - 2028
        • Exhibit 23: Market Size (value) – Data Table on Global starch market by Country 2023 - 2028 ($ million)

      5 Five Forces Analysis

      • 5.1 Five forces summary
        • Exhibit 24: Five forces analysis - Comparison between 2023 and 2028
      • 5.2 Bargaining power of buyers
        • Exhibit 25: Chart on Bargaining power of buyers – Impact of key factors 2023 and 2028
      • 5.3 Bargaining power of suppliers
        • Exhibit 26: Bargaining power of suppliers – Impact of key factors in 2023 and 2028
      • 5.4 Threat of new entrants
        • Exhibit 27: Threat of new entrants – Impact of key factors in 2023 and 2028
      • 5.5 Threat of substitutes
        • Exhibit 28: Threat of substitutes – Impact of key factors in 2023 and 2028
      • 5.6 Threat of rivalry
        • Exhibit 29: Threat of rivalry – Impact of key factors in 2023 and 2028
      • 5.7 Market condition
        • Exhibit 30: Chart on Market condition - Five forces 2023 and 2028

      6 Market Segmentation by Type

      • 6.1 Market segments
        • Chart on Type - Market share (2023-2028) (%)
        • Data Table on Type - Market share (2023-2028) (%)
      • 6.2 Comparison by Type
        • Chart on Comparison by Type
        • Data Table on Comparison by Type
      • 6.3 Corn - Market size and forecast (2023-2028)
        • Chart on Corn - Market size and forecast (2023-2028) ($ million)
        • Data Table on Corn - Market size and forecast (2023-2028) ($ million)
        • Chart on Corn - Year-over-year growth (2023-2028) (%)
        • Data Table on Corn - Year-over-year growth (2023-2028) (%)
      • 6.4 Potato - Market size and forecast (2023-2028)
        • Chart on Potato - Market size and forecast (2023-2028) ($ million)
        • Data Table on Potato - Market size and forecast (2023-2028) ($ million)
        • Chart on Potato - Year-over-year growth (2023-2028) (%)
        • Data Table on Potato - Year-over-year growth (2023-2028) (%)
      • 6.5 Tapioca - Market size and forecast (2023-2028)
        • Chart on Tapioca - Market size and forecast (2023-2028) ($ million)
        • Data Table on Tapioca - Market size and forecast (2023-2028) ($ million)
        • Chart on Tapioca - Year-over-year growth (2023-2028) (%)
        • Data Table on Tapioca - Year-over-year growth (2023-2028) (%)
      • 6.6 Wheat - Market size and forecast (2023-2028)
        • Chart on Wheat - Market size and forecast (2023-2028) ($ million)
        • Data Table on Wheat - Market size and forecast (2023-2028) ($ million)
        • Chart on Wheat - Year-over-year growth (2023-2028) (%)
        • Data Table on Wheat - Year-over-year growth (2023-2028) (%)
      • 6.7 Others - Market size and forecast (2023-2028)
        • Chart on Others - Market size and forecast (2023-2028) ($ million)
        • Data Table on Others - Market size and forecast (2023-2028) ($ million)
        • Chart on Others - Year-over-year growth (2023-2028) (%)
        • Data Table on Others - Year-over-year growth (2023-2028) (%)
      • 6.8 Market opportunity by Type
        • Market opportunity by Type ($ million)
        • Data Table on Market opportunity by Type ($ million)

      7 Market Segmentation by End-user

      • 7.1 Market segments
        • Chart on End-user - Market share (2023-2028) (%)
        • Data Table on End-user - Market share (2023-2028) (%)
      • 7.2 Comparison by End-user
        • Chart on Comparison by End-user
        • Data Table on Comparison by End-user
      • 7.3 Retail - Market size and forecast (2023-2028)
        • Chart on Retail - Market size and forecast (2023-2028) ($ million)
        • Data Table on Retail - Market size and forecast (2023-2028) ($ million)
        • Chart on Retail - Year-over-year growth (2023-2028) (%)
        • Data Table on Retail - Year-over-year growth (2023-2028) (%)
      • 7.4 Industry (B2B) - Market size and forecast (2023-2028)
        • Chart on Industry (B2B) - Market size and forecast (2023-2028) ($ million)
        • Data Table on Industry (B2B) - Market size and forecast (2023-2028) ($ million)
        • Chart on Industry (B2B) - Year-over-year growth (2023-2028) (%)
        • Data Table on Industry (B2B) - Year-over-year growth (2023-2028) (%)
      • 7.5 Animal feed - Market size and forecast (2023-2028)
        • Chart on Animal feed - Market size and forecast (2023-2028) ($ million)
        • Data Table on Animal feed - Market size and forecast (2023-2028) ($ million)
        • Chart on Animal feed - Year-over-year growth (2023-2028) (%)
        • Data Table on Animal feed - Year-over-year growth (2023-2028) (%)
      • 7.6 Market opportunity by End-user
        • Market opportunity by End-user ($ million)
        • Data Table on Market opportunity by End-user ($ million)

      8 Market Segmentation by Source

      • 8.1 Market segments
        • Chart on Source - Market share (2023-2028) (%)
        • Data Table on Source - Market share (2023-2028) (%)
      • 8.2 Comparison by Source
        • Chart on Comparison by Source
        • Data Table on Comparison by Source
      • 8.3 Corn - Market size and forecast (2023-2028)
        • Chart on Corn - Market size and forecast (2023-2028) ($ million)
        • Data Table on Corn - Market size and forecast (2023-2028) ($ million)
        • Chart on Corn - Year-over-year growth (2023-2028) (%)
        • Data Table on Corn - Year-over-year growth (2023-2028) (%)
      • 8.4 Wheat - Market size and forecast (2023-2028)
        • Chart on Wheat - Market size and forecast (2023-2028) ($ million)
        • Data Table on Wheat - Market size and forecast (2023-2028) ($ million)
        • Chart on Wheat - Year-over-year growth (2023-2028) (%)
        • Data Table on Wheat - Year-over-year growth (2023-2028) (%)
      • 8.5 Potato - Market size and forecast (2023-2028)
        • Chart on Potato - Market size and forecast (2023-2028) ($ million)
        • Data Table on Potato - Market size and forecast (2023-2028) ($ million)
        • Chart on Potato - Year-over-year growth (2023-2028) (%)
        • Data Table on Potato - Year-over-year growth (2023-2028) (%)
      • 8.6 Cassava - Market size and forecast (2023-2028)
        • Chart on Cassava - Market size and forecast (2023-2028) ($ million)
        • Data Table on Cassava - Market size and forecast (2023-2028) ($ million)
        • Chart on Cassava - Year-over-year growth (2023-2028) (%)
        • Data Table on Cassava - Year-over-year growth (2023-2028) (%)
      • 8.7 Others - Market size and forecast (2023-2028)
        • Chart on Others - Market size and forecast (2023-2028) ($ million)
        • Data Table on Others - Market size and forecast (2023-2028) ($ million)
        • Chart on Others - Year-over-year growth (2023-2028) (%)
        • Data Table on Others - Year-over-year growth (2023-2028) (%)
      • 8.8 Market opportunity by Source
        • Market opportunity by Source ($ million)
        • Data Table on Market opportunity by Source ($ million)

      8 Customer Landscape

      • 8.1 Customer landscape overview
        • Exhibit 75: Analysis of price sensitivity, lifecycle, customer purchase basket, adoption rates, and purchase criteria

      9 Geographic Landscape

      • 9.1 Geographic segmentation
        • Exhibit 76: Chart on Market share by geography 2023-2028 (%)
        • Exhibit 77: Data Table on Market share by geography 2023-2028 (%)
      • 9.2 Geographic comparison
        • Exhibit 78: Chart on Geographic comparison
        • Exhibit 79: Data Table on Geographic comparison
      • 9.3 APAC - Market size and forecast 2023-2028
        • Exhibit 80: Chart on APAC - Market size and forecast 2023-2028 ($ million)
        • Exhibit 81: Data Table on APAC - Market size and forecast 2023-2028 ($ million)
        • Exhibit 82: Chart on APAC - Year-over-year growth 2023-2028 (%)
        • Exhibit 83: Data Table on APAC - Year-over-year growth 2023-2028 (%)
      • 9.4 North America - Market size and forecast 2023-2028
        • Exhibit 84: Chart on North America - Market size and forecast 2023-2028 ($ million)
        • Exhibit 85: Data Table on North America - Market size and forecast 2023-2028 ($ million)
        • Exhibit 86: Chart on North America - Year-over-year growth 2023-2028 (%)
        • Exhibit 87: Data Table on North America - Year-over-year growth 2023-2028 (%)
      • 9.5 Europe - Market size and forecast 2023-2028
        • Exhibit 88: Chart on Europe - Market size and forecast 2023-2028 ($ million)
        • Exhibit 89: Data Table on Europe - Market size and forecast 2023-2028 ($ million)
        • Exhibit 90: Chart on Europe - Year-over-year growth 2023-2028 (%)
        • Exhibit 91: Data Table on Europe - Year-over-year growth 2023-2028 (%)
      • 9.6 South America - Market size and forecast 2023-2028
        • Exhibit 92: Chart on South America - Market size and forecast 2023-2028 ($ million)
        • Exhibit 93: Data Table on South America - Market size and forecast 2023-2028 ($ million)
        • Exhibit 94: Chart on South America - Year-over-year growth 2023-2028 (%)
        • Exhibit 95: Data Table on South America - Year-over-year growth 2023-2028 (%)
      • 9.7 Middle East and Africa - Market size and forecast 2023-2028
        • Exhibit 96: Chart on Middle East and Africa - Market size and forecast 2023-2028 ($ million)
        • Exhibit 97: Data Table on Middle East and Africa - Market size and forecast 2023-2028 ($ million)
        • Exhibit 98: Chart on Middle East and Africa - Year-over-year growth 2023-2028 (%)
        • Exhibit 99: Data Table on Middle East and Africa - Year-over-year growth 2023-2028 (%)
      • 9.8 China - Market size and forecast 2023-2028
        • Exhibit 100: Chart on China - Market size and forecast 2023-2028 ($ million)
        • Exhibit 101: Data Table on China - Market size and forecast 2023-2028 ($ million)
        • Exhibit 102: Chart on China - Year-over-year growth 2023-2028 (%)
        • Exhibit 103: Data Table on China - Year-over-year growth 2023-2028 (%)
      • 9.9 US - Market size and forecast 2023-2028
        • Exhibit 104: Chart on US - Market size and forecast 2023-2028 ($ million)
        • Exhibit 105: Data Table on US - Market size and forecast 2023-2028 ($ million)
        • Exhibit 106: Chart on US - Year-over-year growth 2023-2028 (%)
        • Exhibit 107: Data Table on US - Year-over-year growth 2023-2028 (%)
      • 9.10 France - Market size and forecast 2023-2028
        • Exhibit 108: Chart on France - Market size and forecast 2023-2028 ($ million)
        • Exhibit 109: Data Table on France - Market size and forecast 2023-2028 ($ million)
        • Exhibit 110: Chart on France - Year-over-year growth 2023-2028 (%)
        • Exhibit 111: Data Table on France - Year-over-year growth 2023-2028 (%)
      • 9.11 Germany - Market size and forecast 2023-2028
        • Exhibit 112: Chart on Germany - Market size and forecast 2023-2028 ($ million)
        • Exhibit 113: Data Table on Germany - Market size and forecast 2023-2028 ($ million)
        • Exhibit 114: Chart on Germany - Year-over-year growth 2023-2028 (%)
        • Exhibit 115: Data Table on Germany - Year-over-year growth 2023-2028 (%)
      • 9.12 India - Market size and forecast 2023-2028
        • Exhibit 116: Chart on India - Market size and forecast 2023-2028 ($ million)
        • Exhibit 117: Data Table on India - Market size and forecast 2023-2028 ($ million)
        • Exhibit 118: Chart on India - Year-over-year growth 2023-2028 (%)
        • Exhibit 119: Data Table on India - Year-over-year growth 2023-2028 (%)
      • 9.13 Market opportunity by geography
        • Exhibit 120: Market opportunity by geography ($ million)
        • Exhibit 121: Data Tables on Market opportunity by geography ($ million)
      • 10.14 Rest of World (ROW) - Market size and forecast (2023-2028)
        • Chart on Rest of World (ROW) - Market size and forecast (2023-2028) ($ million)
        • Data Table on Rest of World (ROW) - Market size and forecast (2023-2028) ($ million)
        • Chart on Rest of World (ROW) - Year-over-year growth (2023-2028) (%)
        • Data Table on Rest of World (ROW) - Year-over-year growth (2023-2028) (%)

      10 Drivers, Challenges, and Trends

      • 10.1 Market drivers
        • 10.2 Market challenges
          • 10.3 Impact of drivers and challenges
            • Exhibit 122: Impact of drivers and challenges in 2023 and 2028
          • 10.4 Market trends

            11 Vendor Landscape

            • 11.1 Overview
              • 11.2 Vendor landscape
                • Exhibit 123: Overview on Criticality of inputs and Factors of differentiation
              • 11.3 Landscape disruption
                • Exhibit 124: Overview on factors of disruption
              • 11.4 Industry risks
                • Exhibit 125: Impact of key risks on business

              12 Vendor Analysis

              • 12.1 Vendors covered
                • Exhibit 126: Vendors covered
              • 12.2 Market positioning of vendors
                • Exhibit 127: Matrix on vendor position and classification
              • 12.3 AGRANA Beteiligungs AG
                • Exhibit 128: AGRANA Beteiligungs AG - Overview
                • Exhibit 129: AGRANA Beteiligungs AG - Business segments
                • Exhibit 130: AGRANA Beteiligungs AG - Key offerings
                • Exhibit 131: AGRANA Beteiligungs AG - Segment focus
              • 12.4 Archer Daniels Midland Co.
                • Exhibit 132: Archer Daniels Midland Co. - Overview
                • Exhibit 133: Archer Daniels Midland Co. - Business segments
                • Exhibit 134: Archer Daniels Midland Co. - Key news
                • Exhibit 135: Archer Daniels Midland Co. - Key offerings
                • Exhibit 136: Archer Daniels Midland Co. - Segment focus
              • 12.5 Beneo GmbH
                • Exhibit 137: Beneo GmbH - Overview
                • Exhibit 138: Beneo GmbH - Product / Service
                • Exhibit 139: Beneo GmbH - Key offerings
              • 12.6 Cargill Inc.
                • Exhibit 140: Cargill Inc. - Overview
                • Exhibit 141: Cargill Inc. - Product / Service
                • Exhibit 142: Cargill Inc. - Key news
                • Exhibit 143: Cargill Inc. - Key offerings
              • 12.7 Emsland Starke GmbH
                • Exhibit 144: Emsland Starke GmbH - Overview
                • Exhibit 145: Emsland Starke GmbH - Product / Service
                • Exhibit 146: Emsland Starke GmbH - Key offerings
              • 12.8 Ingredion Inc.
                • Exhibit 147: Ingredion Inc. - Overview
                • Exhibit 148: Ingredion Inc. - Business segments
                • Exhibit 149: Ingredion Inc. - Key offerings
                • Exhibit 150: Ingredion Inc. - Segment focus
              • 12.9 Kent Corp.
                • Exhibit 151: Kent Corp. - Overview
                • Exhibit 152: Kent Corp. - Product / Service
                • Exhibit 153: Kent Corp. - Key offerings
              • 12.10 Manildra Flour Mills Pty. Ltd.
                • Exhibit 154: Manildra Flour Mills Pty. Ltd. - Overview
                • Exhibit 155: Manildra Flour Mills Pty. Ltd. - Product / Service
                • Exhibit 156: Manildra Flour Mills Pty. Ltd. - Key offerings
              • 12.11 MGP Ingredients Inc.
                • Exhibit 157: MGP Ingredients Inc. - Overview
                • Exhibit 158: MGP Ingredients Inc. - Product / Service
                • Exhibit 159: MGP Ingredients Inc. - Key offerings
              • 12.12 Roquette Freres SA
                • Exhibit 160: Roquette Freres SA - Overview
                • Exhibit 161: Roquette Freres SA - Product / Service
                • Exhibit 162: Roquette Freres SA - Key offerings
              • 12.13 Royal Avebe
                • Exhibit 163: Royal Avebe - Overview
                • Exhibit 164: Royal Avebe - Product / Service
                • Exhibit 165: Royal Avebe - Key offerings
              • 12.14 SMScor
                • Exhibit 166: SMScor - Overview
                • Exhibit 167: SMScor - Product / Service
                • Exhibit 168: SMScor - Key offerings
              • 12.15 Tate and Lyle PLC
                • Exhibit 169: Tate and Lyle PLC - Overview
                • Exhibit 170: Tate and Lyle PLC - Business segments
                • Exhibit 171: Tate and Lyle PLC - Key offerings
                • Exhibit 172: Tate and Lyle PLC - Segment focus
              • 12.16 Thai Flour Industry Co. Ltd.
                • Exhibit 173: Thai Flour Industry Co. Ltd. - Overview
                • Exhibit 174: Thai Flour Industry Co. Ltd. - Product / Service
                • Exhibit 175: Thai Flour Industry Co. Ltd. - Key offerings
              • 12.17 VIMAL PPCE
                • Exhibit 176: VIMAL PPCE - Overview
                • Exhibit 177: VIMAL PPCE - Product / Service
                • Exhibit 178: VIMAL PPCE - Key offerings

              13 Appendix

              • 13.1 Scope of the report
                • 13.2 Inclusions and exclusions checklist
                  • Exhibit 179: Inclusions checklist
                  • Exhibit 180: Exclusions checklist
                • 13.3 Currency conversion rates for US$
                  • Exhibit 181: Currency conversion rates for US$
                • 13.4 Research methodology
                  • Exhibit 182: Research methodology
                  • Exhibit 183: Validation techniques employed for market sizing
                  • Exhibit 184: Information sources
                • 13.5 List of abbreviations
                  • Exhibit 185: List of abbreviations

                Research Methodology

                Technavio presents a detailed picture of the market by way of study, synthesis, and summation of data from multiple sources. The analysts have presented the various facets of the market with a particular focus on identifying the key industry influencers. The data thus presented is comprehensive, reliable, and the result of extensive research, both primary and secondary.

                INFORMATION SOURCES

                Primary sources

                • Manufacturers and suppliers
                • Channel partners
                • Industry experts
                • Strategic decision makers

                Secondary sources

                • Industry journals and periodicals
                • Government data
                • Financial reports of key industry players
                • Historical data
                • Press releases

                DATA ANALYSIS

                Data Synthesis

                • Collation of data
                • Estimation of key figures
                • Analysis of derived insights

                Data Validation

                • Triangulation with data models
                • Reference against proprietary databases
                • Corroboration with industry experts

                REPORT WRITING

                Qualitative

                • Market drivers
                • Market challenges
                • Market trends
                • Five forces analysis

                Quantitative

                • Market size and forecast
                • Market segmentation
                • Geographical insights
                • Competitive landscape

                Interested in this report?

                Get your sample now to see our research methodology and insights!

                Download Now

                Frequently Asked Questions

                Starch market growth will increase by $ 18.41 bn during 2024-2028 .

                The Starch market is expected to grow at a CAGR of 4.49% during 2024-2028 .

                Starch market is segmented by Type( Corn, Potato, Tapioca, Wheat, Others) End-user( Retail, Industry (B2B), Animal feed)

                AGRANA Beteiligungs AG, Angel Starch and Food Pvt. Ltd., Archer Daniels Midland Co., Beneo GmbH, Cargill Inc., Emsland Starke GmbH, Everest Starch India Pvt. Ltd., Ingredion Inc., Kent Corp., Manildra Flour Mills Pty. Ltd., MGP Ingredients Inc., Roquette Freres SA, Royal Avebe, SPAC Starch Products India Pvt. Ltd., SSPL, Tate and Lyle PLC, Thai Flour Industry Co. Ltd., Varalakshmi Starch Industries P Ltd., VIMAL PPCE, SMScor are a few of the key vendors in the Starch market.

                APAC will register the highest growth rate of 57% among the other regions. Therefore, the Starch market in APAC is expected to garner significant business opportunities for the vendors during the forecast period.

                US, China, India, France, Germany

                • High demand for corn starch due to its cost-efficiencyThe growth in the global starch market can be attributed to the high demand for corn starch in the food and beverage industry. This is primarily due to the wide application areas of corn starch. In addition is the driving factor this market.
                • the availability of corn in abundance is the driving factor this market.
                • particularly in agriculture-rich countries such as India and China is the driving factor this market.
                • fosters growth in the global starch market. Corn is a major source used for producing starch. Corn starch is used instead of wheat while manufacturing gluten-free products because wheat has high gluten content. In addition is the driving factor this market.
                • the price of corn starch is lower than that of wheat or tapioca starches. Corn starch is not just used as a thickening agent but also is a high source of energy. The use of corn starch is also known to lower blood sugar in humans. In addition is the driving factor this market.
                • corn starch has excellent soothing and moisture-absorbing power. Therefore is the driving factor this market.
                • it is also used in cosmetics as an ideal solution for skin problems. The ingredient also offers a relatively less expensive alternative when it comes to store-bought products. Corn starch is also used to:  Clean stuffed animal toys Freshen musty books  Polish silver The versatility of corn starch makes it ideal for different purposes is the driving factor this market.
                • thereby augmenting the demand for corn starch is the driving factor this market.
                • which is expected to drive the growth of the global starch market during the forecast period. is the driving factor this market.

                The Starch market vendors should focus on grabbing business opportunities from the Corn segment as it accounted for the largest market share in the base year.