Fuel Management System Market Analysis North America, Europe, APAC, Middle East and Africa, South America - US, Germany, China, UK, Australia, Canada - Size and Forecast 2024-2028

Fuel Management System Market Analysis North America, Europe, APAC, Middle East and Africa, South America - US, Germany, China, UK, Australia, Canada - Size and Forecast 2024-2028

Published: Jul 2024 207 Pages SKU: IRTNTR80085

Market Overview at a Glance

$435.4 Mn
Market Opportunity
6.77%
CAGR
6.49
YoY growth 2023-2024(%)

Fuel Management System Market Size 2024-2028 

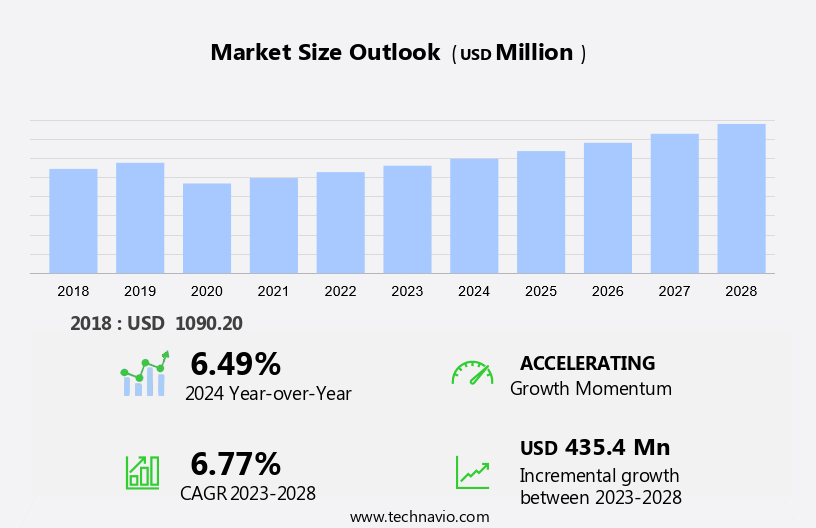
The fuel management system market size is forecast to increase by USD 435.4 million and is estimated to grow at a CAGR of 6.77% between 2023 and 2028. The market is experiencing significant growth, driven by the numerous benefits offered by these systems, including cost savings, improved fleet efficiency, and enhanced security. Vendors in this market are focusing on new product development to meet the evolving needs of customers and address the complexity associated with integrating new fuel management systems with existing infrastructure. Key trends in the market include the increasing adoption of IoT and cloud-based technologies, the growing popularity of real-time monitoring and reporting, and the rising demand for mobile applications. However, challenges such as high implementation costs, data security concerns, and the need for standardization remain significant barriers to market growth. Overall, the market is expected for continued expansion, driven by the increasing recognition of the value these systems bring to organizations seeking to optimize their fuel consumption and reduce operational costs.

What will be the Size of the Market During the Forecast Period?

Fuel Management System Market Size

For More Highlights About this Report, Request Free Sample

Market Dynamic and Customer Landscape

The Market encompasses various applications in industries such as Commercial Vehicles and Aerospace. Key players in this market include General Motors and several other prominent players. In the Commercial Vehicles sector, the focus is on Pickup Trucks like the F-Series truck, where Fuel Management Systems help optimize fuel consumption. Reclaimed rubber from sources like Rubber-Cal is utilized in Tire Retreading processes, which involve the use of Butyl Reclaim Rubber, EPDM Rubber, and other recycled materials. These recycled rubber forms, including granules, crumb, and powder, are also used in industries like Footwear, Building Materials, Pharmaceutical Goods, Safety Gear, Conveyor Belts, Consumer Goods, and Aerospace. Virgin rubber and conductive elastomer are other essential raw materials in the Market. Aircraft tires and aircraft components are significant applications in the Aerospace sector, where fuel efficiency is crucial. Our researchers analyzed the data with 2023 as the base year, along with the key drivers, trends, and challenges. A holistic analysis of drivers will help companies refine their marketing strategies to gain a competitive advantage.

Key Market Driver

Benefits offered by fuel management systems is notably driving market growth. The Market encompasses various applications in sectors such as automotive and aviation. In the automotive industry, companies like General Motors have implemented fuel management systems to optimize the usage of fuel in commercial vehicles, including pickup trucks like the F-Series, by monitoring tire pressure and promoting practices like tire retreading using reclaimed rubber, such as butyl reclaim rubber and EPDM rubber derived from end-of-life tires.

Moreover, reclaimed rubber is also utilized in the production of recycled materials, like ReUz rubber tiles, which are used as alternatives to virgin rubber in various industries, including aircraft, footwear, building materials, pharmaceutical goods, safety gear, conveyor belts, and consumer goods. Thus, such factors are driving the growth of the market during the forecast period.

Significant Market Trends

Growing focus of companies on new product development is the key trend in the market. The Market encompasses various applications, including commercial vehicles such as pickup trucks from General Motors and Ford's F-Series, and aircraft tires in the aerospace industry. Companies like Rubber-Cal are at the forefront of this sector, focusing on tire retreading using reclaimed rubber, such as butyl reclaim rubber and EPDM rubber, derived from end-of-life tires.

Moreover, this process reduces the need for virgin rubber and recycled materials, including tire scraps, tread peelings, and waste rubber, in the production of forms like granules, crumb, and powder.  The aviation industry and middle-class population's growing demand for eco-friendly solutions have led to technology transfer from tire recycling to various industries, including footwear, building materials, pharmaceutical goods, safety gear, conveyor belts, and consumer goods. Conductive elastomer and ReUz rubber tiles are some innovative recycled rubber products that cater to diverse applications.  Thus, such trends will shape the growth of the market during the forecast period.

Major Market Challenge

Complexity associated with integration of new fuel management systems with existing infrastructure is the major challenge that affects the growth of the market. The Market encompasses various applications, including commercial vehicles such as pickup trucks from General Motors and Ford's F-Series, as well as aircraft tires in the aerospace industry. Companies like Rubber-Cal are leading innovators in this sector, exploring alternative solutions through tire retreading using butyl reclaim rubber, EPDM rubber, and other recycled materials.

Moreover, reclaimed rubber from end-of-life tires, tire scraps, and tread peelings are transformed into valuable resources for industries like footwear, building materials, pharmaceutical goods, safety gear, conveyor belts, and consumer goods. Synthetic rubber, derived from copolymers and diene components, plays a crucial role in this circular economy. Key players in this market include companies that specialize in technology transfer, such as those dealing with virgin rubber and recycled materials like granules, crumb, powder, and conductive elastomer, collectively known as ReUz rubber tiles. Hence, the above factors will impede the growth of the market during the forecast period.

Exclusive Customer Landscape

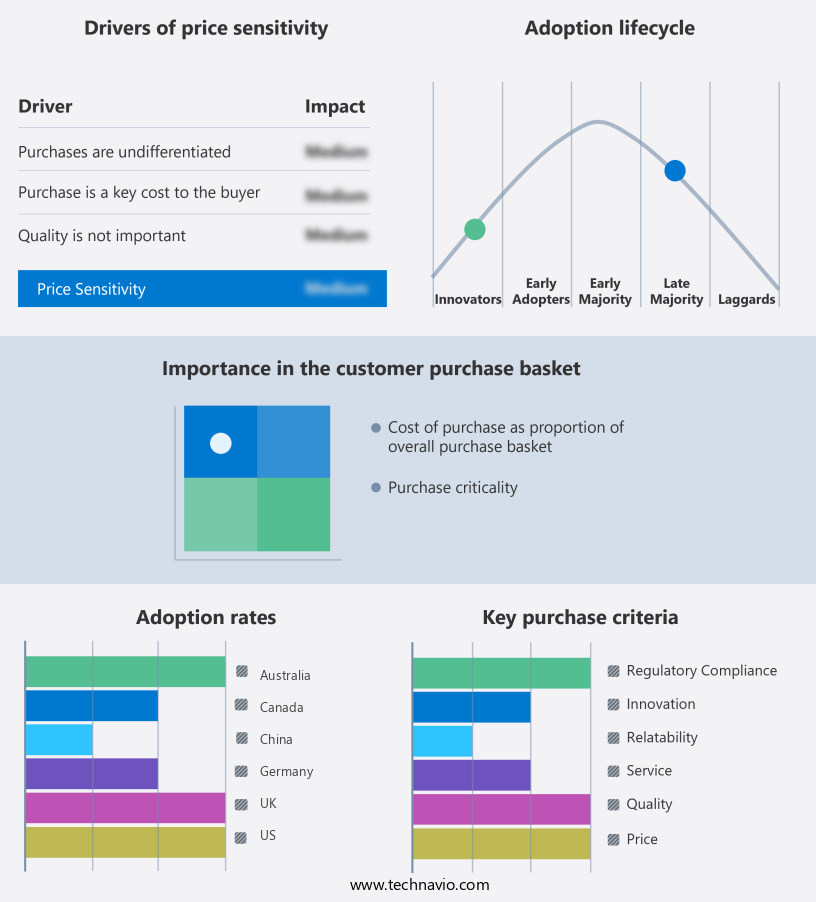
The market forecasting report includes the adoption lifecycle of the market, covering from the innovator’s stage to the laggard’s stage. It focuses on adoption rates in different regions based on penetration. Furthermore, the report also includes key purchase criteria and drivers of price sensitivity to help companies evaluate and develop their market growth analysis strategies.

Fuel Management System Market Share by Geography

 Customer Landscape

Key Companies & Market Insights

Companies are implementing various strategies, such as strategic alliances, partnerships, mergers and acquisitions, geographical expansion, and product/service launches, to enhance their presence in the market.

Banlaw: The company offers fuel management systems such as Banlaw fuel management systems with Xpress controller.

The market research and growth report also includes detailed analyses of the competitive landscape of the market and information about key companies, including:

  • Chevin Fleet Solutions
  • Cummins Inc.
  • Danaher Corp.
  • Dover Corp.
  • E.J. Ward Inc.
  • ESI Total Fuel Management
  • Franklin Electric Co. Inc.
  • Hectronic GmbH
  • HID Global Corp.
  • Multiforce Systems Corp.
  • Orpak Systems Ltd.
  • Piusi Spa
  • Romteck
  • SmartFlow Technologies
  • Sokolis
  • Syntech Systems Inc.
  • Taabi
  • Triscan Group Ltd.
  • Volaris Group Inc.

Qualitative and quantitative analysis of companies has been conducted to help clients understand the wider business environment as well as the strengths and weaknesses of key market players. Data is qualitatively analyzed to categorize companies as pure play, category-focused, industry-focused, and diversified; it is quantitatively analyzed to categorize companies as dominant, leading, strong, tentative, and weak.

Market Segmentation

By Application 

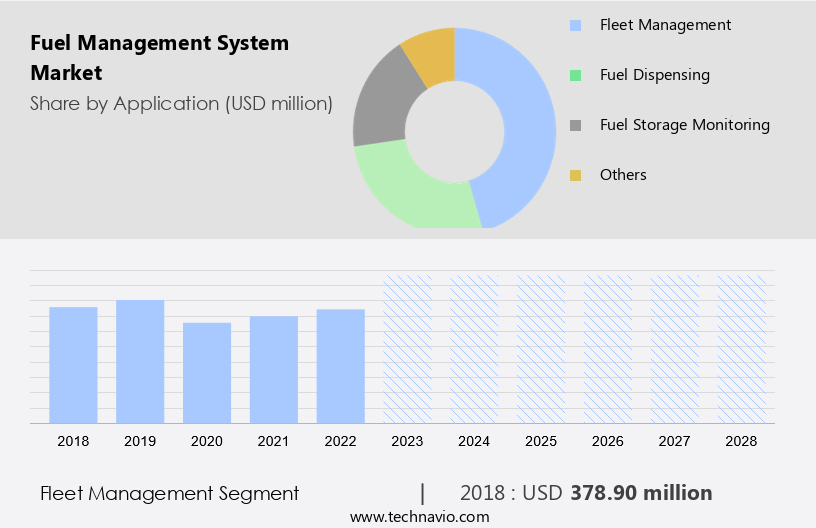
The fleet management segment is estimated to witness significant growth during the forecast period. General Motors and other automobile manufacturers are increasingly adopting Fuel Management Systems in their commercial vehicles, including pickup trucks and F-Series models, to enhance fuel efficiency and reduce operational costs.

Fuel Management System Market Size

Get a glance at the market share of various regions Download the PDF Sample

The fleet management segment was the largest segment and valued at USD 378.90 million in 2018. Rubber-Cal, a leading rubber manufacturer, is a significant player in the market, specializing in the production of reclaimed rubber from bicycle tires and end-of-life tires. This reclaimed rubber is utilized in tire retreading processes, which involve the use of butyl reclaim rubber, EPDM rubber, and other synthetic rubbers, such as copolymer and diene component, derived from natural rubber and waste rubber. Hence, such factors are fuelling the growth of this segment during the forecast period.

Regional Analysis

Fuel Management System Market Share by Geography

For more insights on the market share of various regions Download PDF Sample now!

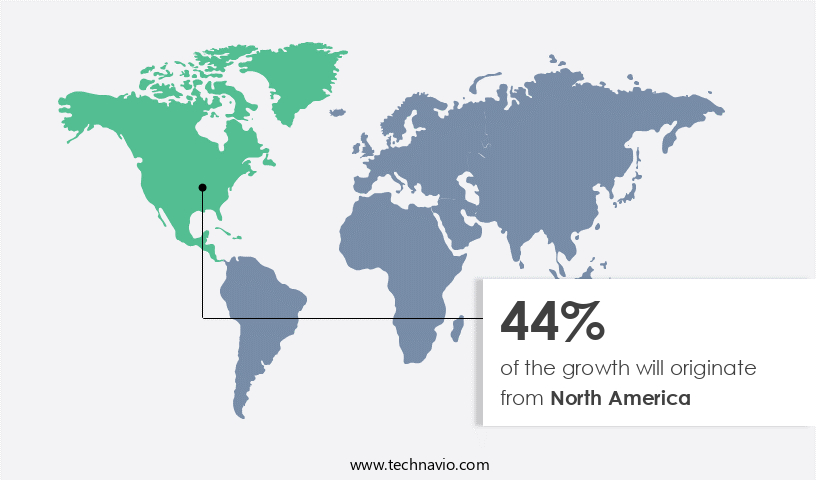
North America is estimated to contribute 44% to the growth of the global market during the forecast period. Technavio’s analysts have elaborately explained the regional trends and drivers that shape the market during the forecast period. The market encompasses various applications, including Butyl Reclaim and Whole Tire Reclaim. These processes involve the recovery and reuse of materials from OEM Tires, such as inner liners, inner tubes, tire sidewalls, tire plies, and Nontire products like molded goods, adhesives, matting, profiles, and roofing. The recovered materials from tires are repurposed into new products, reducing waste and promoting sustainability. Butyl Reclaim specifically focuses on extracting butyl rubber from tire inner liners, while Whole Tire Reclaim utilizes the entire tire carcass. Hence, such factors are driving the market in North America during the forecast period.

Segment Overview

The market research report provides comprehensive data (region-wise segment analysis), with forecasts and estimates in "USD million " for the period 2024-2028, as well as historical data from 2018-2022 for the following segments.

  • Application Outlook
    • Fleet management
    • Fuel dispensing
    • Fuel storage monitoring
    • Others
  • End-user Outlook
    • Transport and Logistics
    • Oil and gas
    • Retail fuel stations
    • Others
  • Region Outlook
    • North America
      • The U.S.
      • Canada
    • Europe
      • U.K.
      • Germany
      • France
      • Rest of Europe
    • APAC
      • China
      • India
    • Middle East & Africa
      • Saudi Arabia
      • South Africa
      • Rest of the Middle East & Africa

You may also interested in below market reports:

Aircraft Fuel Systems Market Analysis North America, Europe, APAC, South America, Middle East and Africa - US, France, Germany, China, Canada - Size and Forecast

Commercial Vehicle Fleet Management System Market Analysis North America, APAC, Europe, South America, Middle East and Africa - US, China, Germany, India, Japan - Size and Forecast

Smart Fleet Management Market Analysis APAC, Europe, North America, Middle East and Africa, South America - US, China, UK, Germany, Japan - Size and Forecast

Market Analyst Overview

The market is gaining significant traction as the focus on sustainability and cost savings intensifies. Key players in this market include General Motors, who are integrating Fuel Management Systems in their commercial vehicles, particularly pickup trucks like the F-Series. Rubber-Cal, a leading player in the tire industry, is also embracing this trend by exploring tire retreading using butyl reclaim rubber, EPDM rubber, and other recycled materials. Reclaimed rubber from end-of-life tires, tire scraps, and tread peelings are being transformed into valuable resources for various industries, including aviation, consumer goods, and building materials. Synthetic rubber, copolymers, and diene components are essential in the production of fuel-efficient tires. Natural rubber and recycled rubber forms like granules, crumb, and powder are also being used extensively. The aviation industry, in particular, is a significant consumer of fuel-efficient tires made from conductive elastomer and recycled rubber. The middle-class population's increasing demand for fuel-efficient vehicles and the technology transfer from advanced economies are driving the growth of the market. Applications in footwear, safety gear, conveyor belts, aerospace, and advertising are also expanding the market's reach. In conclusion, the market in the tire industry is a growing sector, with General Motors, Rubber-Cal, and other key players leading the way in the adoption of fuel-efficient technologies and recycled materials. The market's potential applications in various industries, including aviation and consumer goods, offer significant opportunities for growth.

Market Scope

Report Coverage

Details

Page number

207

Base year

2023

Historic period

2018-2022

Forecast period

2024-2028

Growth momentum & CAGR

Accelerate at a CAGR of 6.77%

Market growth 2024-2028

USD 435.4 million

Market structure

Fragmented

YoY growth 2023-2024(%)

6.49

Regional analysis

North America, Europe, APAC, Middle East and Africa, and South America

Performing market contribution

North America at 44%

Key countries

US, Germany, China, UK, Australia, and Canada

Competitive landscape

Leading Companies, Market Positioning of Companies, Competitive Strategies, and Industry Risks

Key companies profiled

Banlaw, Chevin Fleet Solutions, Cummins Inc., Danaher Corp., Dover Corp., E.J. Ward Inc., ESI Total Fuel Management, Franklin Electric Co. Inc., Hectronic GmbH, HID Global Corp., Multiforce Systems Corp., Orpak Systems Ltd., Piusi Spa, Romteck, SmartFlow Technologies, Sokolis, Syntech Systems Inc., Taabi, Triscan Group Ltd., and Volaris Group Inc.

Market dynamics

Parent market analysis, market report , market forecast , Market growth inducers and obstacles, Fast-growing and slow-growing segment analysis, COVID-19 impact and recovery analysis and future consumer dynamics, Market condition analysis for forecast period

Customization purview

If our report has not included the data that you are looking for, you can reach out to our analysts and get segments customized.

Download PDF Sample

What are the Key Data Covered in this Market Research Report?

  • CAGR of the market during the forecast period
  • Detailed information on factors that will drive the market growth and forecasting between 2024 and 2028
  • Precise estimation of the size of the market  and its contribution of the market in focus to the parent market
  • Accurate predictions about upcoming market growth and trends and changes in consumer behaviour
  • Growth of the market across North America, Europe, APAC, Middle East and Africa, and South America
  • Thorough analysis of the market’s competitive landscape and detailed information about companies
  • Comprehensive analysis of factors that will challenge the growth of market companies

1 Executive Summary

  • 1.1 Market overview
    • Executive Summary - Chart on Market Overview
    • Executive Summary - Data Table on Market Overview
    • Executive Summary - Chart on Global Market Characteristics
    • Executive Summary - Chart on Market by Geography
    • Executive Summary - Chart on Market Segmentation by Application
    • Executive Summary - Chart on Market Segmentation by End-user
    • Executive Summary - Chart on Incremental Growth
    • Executive Summary - Data Table on Incremental Growth
    • Executive Summary - Chart on Company Market Positioning

2 Technavio Analysis

  • 2.1 Analysis of price sensitivity, lifecycle, customer purchase basket, adoption rates, and purchase criteria
    • Analysis of price sensitivity, lifecycle, customer purchase basket, adoption rates, and purchase criteria
  • 2.2 Criticality of inputs and Factors of differentiation
    • Overview on criticality of inputs and factors of differentiation
  • 2.3 Factors of disruption
    • Overview on factors of disruption
  • 2.4 Impact of drivers and challenges
    • Impact of drivers and challenges in 2023 and 2028

3 Market Landscape

  • 3.1 Market ecosystem
    • Parent Market
    • Data Table on - Parent Market
  • 3.2 Market characteristics
    • Market characteristics analysis
  • 3.3 Value chain analysis
    • Value Chain Analysis

4 Market Sizing

  • 4.1 Market definition
    • Offerings of companies included in the market definition
  • 4.2 Market segment analysis
    • Market segments
  • 4.3 Market size 2023
    • 4.4 Market outlook: Forecast for 2023-2028
      • Chart on Global - Market size and forecast 2023-2028 ($ million)
      • Data Table on Global - Market size and forecast 2023-2028 ($ million)
      • Chart on Global Market: Year-over-year growth 2023-2028 (%)
      • Data Table on Global Market: Year-over-year growth 2023-2028 (%)

    5 Historic Market Size

    • 5.1 Global Fuel Management System Market 2018 - 2022
      • Historic Market Size - Data Table on Global Fuel Management System Market 2018 - 2022 ($ million)
    • 5.2 Application segment analysis 2018 - 2022
      • Historic Market Size - Application Segment 2018 - 2022 ($ million)
    • 5.3 End-user segment analysis 2018 - 2022
      • Historic Market Size - End-user Segment 2018 - 2022 ($ million)
    • 5.4 Geography segment analysis 2018 - 2022
      • Historic Market Size - Geography Segment 2018 - 2022 ($ million)
    • 5.5 Country segment analysis 2018 - 2022
      • Historic Market Size - Country Segment 2018 - 2022 ($ million)

    6 Additional Value/Volume Data

    • 6.1 Global fuel management system market by country 2023 - 2028 ($ million)
      • Market Size (value) - Data Table on Global fuel management system market by Country 2023 - 2028 ($ million)

    7 Five Forces Analysis

    • 7.1 Five forces summary
      • Five forces analysis - Comparison between 2023 and 2028
    • 7.2 Bargaining power of buyers
      • Bargaining power of buyers - Impact of key factors 2023 and 2028
    • 7.3 Bargaining power of suppliers
      • Bargaining power of suppliers - Impact of key factors in 2023 and 2028
    • 7.4 Threat of new entrants
      • Threat of new entrants - Impact of key factors in 2023 and 2028
    • 7.5 Threat of substitutes
      • Threat of substitutes - Impact of key factors in 2023 and 2028
    • 7.6 Threat of rivalry
      • Threat of rivalry - Impact of key factors in 2023 and 2028
    • 7.7 Market condition
      • Chart on Market condition - Five forces 2023 and 2028

    8 Market Segmentation by Application

    • 8.1 Market segments
      • Chart on Application - Market share 2023-2028 (%)
      • Data Table on Application - Market share 2023-2028 (%)
    • 8.2 Comparison by Application
      • Chart on Comparison by Application
      • Data Table on Comparison by Application
    • 8.3 Fleet management - Market size and forecast 2023-2028
      • Chart on Fleet management - Market size and forecast 2023-2028 ($ million)
      • Data Table on Fleet management - Market size and forecast 2023-2028 ($ million)
      • Chart on Fleet management - Year-over-year growth 2023-2028 (%)
      • Data Table on Fleet management - Year-over-year growth 2023-2028 (%)
    • 8.4 Fuel dispensing - Market size and forecast 2023-2028
      • Chart on Fuel dispensing - Market size and forecast 2023-2028 ($ million)
      • Data Table on Fuel dispensing - Market size and forecast 2023-2028 ($ million)
      • Chart on Fuel dispensing - Year-over-year growth 2023-2028 (%)
      • Data Table on Fuel dispensing - Year-over-year growth 2023-2028 (%)
    • 8.5 Fuel storage monitoring - Market size and forecast 2023-2028
      • Chart on Fuel storage monitoring - Market size and forecast 2023-2028 ($ million)
      • Data Table on Fuel storage monitoring - Market size and forecast 2023-2028 ($ million)
      • Chart on Fuel storage monitoring - Year-over-year growth 2023-2028 (%)
      • Data Table on Fuel storage monitoring - Year-over-year growth 2023-2028 (%)
    • 8.6 Others - Market size and forecast 2023-2028
      • Chart on Others - Market size and forecast 2023-2028 ($ million)
      • Data Table on Others - Market size and forecast 2023-2028 ($ million)
      • Chart on Others - Year-over-year growth 2023-2028 (%)
      • Data Table on Others - Year-over-year growth 2023-2028 (%)
    • 8.7 Market opportunity by Application
      • Market opportunity by Application ($ million)
      • Data Table on Market opportunity by Application ($ million)

    9 Market Segmentation by End-user

    • 9.1 Market segments
      • Chart on End-user - Market share 2023-2028 (%)
      • Data Table on End-user - Market share 2023-2028 (%)
    • 9.2 Comparison by End-user
      • Chart on Comparison by End-user
      • Data Table on Comparison by End-user
    • 9.3 Transport and logistics - Market size and forecast 2023-2028
      • Chart on Transport and logistics - Market size and forecast 2023-2028 ($ million)
      • Data Table on Transport and logistics - Market size and forecast 2023-2028 ($ million)
      • Chart on Transport and logistics - Year-over-year growth 2023-2028 (%)
      • Data Table on Transport and logistics - Year-over-year growth 2023-2028 (%)
    • 9.4 Oil and gas - Market size and forecast 2023-2028
      • Chart on Oil and gas - Market size and forecast 2023-2028 ($ million)
      • Data Table on Oil and gas - Market size and forecast 2023-2028 ($ million)
      • Chart on Oil and gas - Year-over-year growth 2023-2028 (%)
      • Data Table on Oil and gas - Year-over-year growth 2023-2028 (%)
    • 9.5 Retail fuel stations - Market size and forecast 2023-2028
      • Chart on Retail fuel stations - Market size and forecast 2023-2028 ($ million)
      • Data Table on Retail fuel stations - Market size and forecast 2023-2028 ($ million)
      • Chart on Retail fuel stations - Year-over-year growth 2023-2028 (%)
      • Data Table on Retail fuel stations - Year-over-year growth 2023-2028 (%)
    • 9.6 Others - Market size and forecast 2023-2028
      • Chart on Others - Market size and forecast 2023-2028 ($ million)
      • Data Table on Others - Market size and forecast 2023-2028 ($ million)
      • Chart on Others - Year-over-year growth 2023-2028 (%)
      • Data Table on Others - Year-over-year growth 2023-2028 (%)
    • 9.7 Market opportunity by End-user
      • Market opportunity by End-user ($ million)
      • Data Table on Market opportunity by End-user ($ million)

    10 Customer Landscape

    • 10.1 Customer landscape overview
      • Analysis of price sensitivity, lifecycle, customer purchase basket, adoption rates, and purchase criteria

    11 Geographic Landscape

    • 11.1 Geographic segmentation
      • Chart on Market share by geography 2023-2028 (%)
      • Data Table on Market share by geography 2023-2028 (%)
    • 11.2 Geographic comparison
      • Chart on Geographic comparison
      • Data Table on Geographic comparison
    • 11.3 North America - Market size and forecast 2023-2028
      • Chart on North America - Market size and forecast 2023-2028 ($ million)
      • Data Table on North America - Market size and forecast 2023-2028 ($ million)
      • Chart on North America - Year-over-year growth 2023-2028 (%)
      • Data Table on North America - Year-over-year growth 2023-2028 (%)
    • 11.4 Europe - Market size and forecast 2023-2028
      • Chart on Europe - Market size and forecast 2023-2028 ($ million)
      • Data Table on Europe - Market size and forecast 2023-2028 ($ million)
      • Chart on Europe - Year-over-year growth 2023-2028 (%)
      • Data Table on Europe - Year-over-year growth 2023-2028 (%)
    • 11.5 APAC - Market size and forecast 2023-2028
      • Chart on APAC - Market size and forecast 2023-2028 ($ million)
      • Data Table on APAC - Market size and forecast 2023-2028 ($ million)
      • Chart on APAC - Year-over-year growth 2023-2028 (%)
      • Data Table on APAC - Year-over-year growth 2023-2028 (%)
    • 11.6 Middle East and Africa - Market size and forecast 2023-2028
      • Chart on Middle East and Africa - Market size and forecast 2023-2028 ($ million)
      • Data Table on Middle East and Africa - Market size and forecast 2023-2028 ($ million)
      • Chart on Middle East and Africa - Year-over-year growth 2023-2028 (%)
      • Data Table on Middle East and Africa - Year-over-year growth 2023-2028 (%)
    • 11.7 South America - Market size and forecast 2023-2028
      • Chart on South America - Market size and forecast 2023-2028 ($ million)
      • Data Table on South America - Market size and forecast 2023-2028 ($ million)
      • Chart on South America - Year-over-year growth 2023-2028 (%)
      • Data Table on South America - Year-over-year growth 2023-2028 (%)
    • 11.8 US - Market size and forecast 2023-2028
      • Chart on US - Market size and forecast 2023-2028 ($ million)
      • Data Table on US - Market size and forecast 2023-2028 ($ million)
      • Chart on US - Year-over-year growth 2023-2028 (%)
      • Data Table on US - Year-over-year growth 2023-2028 (%)
    • 11.9 Germany - Market size and forecast 2023-2028
      • Chart on Germany - Market size and forecast 2023-2028 ($ million)
      • Data Table on Germany - Market size and forecast 2023-2028 ($ million)
      • Chart on Germany - Year-over-year growth 2023-2028 (%)
      • Data Table on Germany - Year-over-year growth 2023-2028 (%)
    • 11.10 China - Market size and forecast 2023-2028
      • Chart on China - Market size and forecast 2023-2028 ($ million)
      • Data Table on China - Market size and forecast 2023-2028 ($ million)
      • Chart on China - Year-over-year growth 2023-2028 (%)
      • Data Table on China - Year-over-year growth 2023-2028 (%)
    • 11.11 Australia - Market size and forecast 2023-2028
      • Chart on Australia - Market size and forecast 2023-2028 ($ million)
      • Data Table on Australia - Market size and forecast 2023-2028 ($ million)
      • Chart on Australia - Year-over-year growth 2023-2028 (%)
      • Data Table on Australia - Year-over-year growth 2023-2028 (%)
    • 11.12 UK - Market size and forecast 2023-2028
      • Chart on UK - Market size and forecast 2023-2028 ($ million)
      • Data Table on UK - Market size and forecast 2023-2028 ($ million)
      • Chart on UK - Year-over-year growth 2023-2028 (%)
      • Data Table on UK - Year-over-year growth 2023-2028 (%)
    • 11.13 Canada - Market size and forecast 2023-2028
      • Chart on Canada - Market size and forecast 2023-2028 ($ million)
      • Data Table on Canada - Market size and forecast 2023-2028 ($ million)
      • Chart on Canada - Year-over-year growth 2023-2028 (%)
      • Data Table on Canada - Year-over-year growth 2023-2028 (%)
    • 11.14 Market opportunity by geography
      • Market opportunity by geography ($ million)
      • Data Tables on Market opportunity by geography ($ million)

    12 Drivers, Challenges, and Opportunity/Restraints

    • 12.1 Market drivers
      • 12.2 Market challenges
        • 12.3 Impact of drivers and challenges
          • Impact of drivers and challenges in 2023 and 2028
        • 12.4 Market opportunities/restraints

          13 Competitive Landscape

          • 13.1 Overview
            • 13.2 Competitive Landscape
              • Overview on criticality of inputs and factors of differentiation
            • 13.3 Landscape disruption
              • Overview on factors of disruption
            • 13.4 Industry risks
              • Impact of key risks on business

            14 Competitive Analysis

            • 14.1 Companies profiled
              • Companies covered
            • 14.2 Company ranking index
              • Company ranking index
            • 14.3 Market positioning of companies
              • Matrix on companies position and classification
            • 14.4 Banlaw
              • Banlaw - Overview
              • Banlaw - Product / Service
              • Banlaw - Key offerings
              • SWOT
            • 14.5 Chevin Fleet Solutions
              • Chevin Fleet Solutions - Overview
              • Chevin Fleet Solutions - Product / Service
              • Chevin Fleet Solutions - Key offerings
              • SWOT
            • 14.6 Cummins Inc.
              • Cummins Inc. - Overview
              • Cummins Inc. - Business segments
              • Cummins Inc. - Key news
              • Cummins Inc. - Key offerings
              • Cummins Inc. - Segment focus
              • SWOT
            • 14.7 Danaher Corp.
              • Danaher Corp. - Overview
              • Danaher Corp. - Business segments
              • Danaher Corp. - Key news
              • Danaher Corp. - Key offerings
              • Danaher Corp. - Segment focus
              • SWOT
            • 14.8 Dover Corp.
              • Dover Corp. - Overview
              • Dover Corp. - Business segments
              • Dover Corp. - Key news
              • Dover Corp. - Key offerings
              • Dover Corp. - Segment focus
              • SWOT
            • 14.9 E.J. Ward Inc.
              • E.J. Ward Inc. - Overview
              • E.J. Ward Inc. - Product / Service
              • E.J. Ward Inc. - Key offerings
              • SWOT
            • 14.10 Franklin Electric Co. Inc.
              • Franklin Electric Co. Inc. - Overview
              • Franklin Electric Co. Inc. - Business segments
              • Franklin Electric Co. Inc. - Key offerings
              • Franklin Electric Co. Inc. - Segment focus
              • SWOT
            • 14.11 HID Global Corp.
              • HID Global Corp. - Overview
              • HID Global Corp. - Product / Service
              • HID Global Corp. - Key news
              • HID Global Corp. - Key offerings
              • SWOT
            • 14.12 Multiforce Systems Corp.
              • Multiforce Systems Corp. - Overview
              • Multiforce Systems Corp. - Product / Service
              • Multiforce Systems Corp. - Key offerings
              • SWOT
            • 14.13 Orpak Systems Ltd.
              • Orpak Systems Ltd. - Overview
              • Orpak Systems Ltd. - Product / Service
              • Orpak Systems Ltd. - Key offerings
              • SWOT
            • 14.14 Piusi Spa
              • Piusi Spa - Overview
              • Piusi Spa - Product / Service
              • Piusi Spa - Key offerings
              • SWOT
            • 14.15 Romteck
              • Romteck - Overview
              • Romteck - Product / Service
              • Romteck - Key offerings
              • SWOT
            • 14.16 SmartFlow Technologies
              • SmartFlow Technologies - Overview
              • SmartFlow Technologies - Product / Service
              • SmartFlow Technologies - Key offerings
              • SWOT
            • 14.17 Sokolis
              • Sokolis - Overview
              • Sokolis - Product / Service
              • Sokolis - Key offerings
              • SWOT
            • 14.18 Triscan Group Ltd.
              • Triscan Group Ltd. - Overview
              • Triscan Group Ltd. - Product / Service
              • Triscan Group Ltd. - Key offerings
              • SWOT

            15 Appendix

            • 15.1 Scope of the report
              • 15.2 Inclusions and exclusions checklist
                • Inclusions checklist
                • Exclusions checklist
              • 15.3 Currency conversion rates for US$
                • Currency conversion rates for US$
              • 15.4 Research methodology
                • Research methodology
              • 15.5 Data procurement
                • Information sources
              • 15.6 Data validation
                • Data validation
              • 15.7 Validation techniques employed for market sizing
                • Validation techniques employed for market sizing
              • 15.8 Data synthesis
                • Data synthesis
              • 15.9 360 degree market analysis
                • 360 degree market analysis
              • 15.10 List of abbreviations
                • List of abbreviations

              Research Methodology

              Technavio presents a detailed picture of the market by way of study, synthesis, and summation of data from multiple sources. The analysts have presented the various facets of the market with a particular focus on identifying the key industry influencers. The data thus presented is comprehensive, reliable, and the result of extensive research, both primary and secondary.

              INFORMATION SOURCES

              Primary sources

              • Manufacturers and suppliers
              • Channel partners
              • Industry experts
              • Strategic decision makers

              Secondary sources

              • Industry journals and periodicals
              • Government data
              • Financial reports of key industry players
              • Historical data
              • Press releases

              DATA ANALYSIS

              Data Synthesis

              • Collation of data
              • Estimation of key figures
              • Analysis of derived insights

              Data Validation

              • Triangulation with data models
              • Reference against proprietary databases
              • Corroboration with industry experts

              REPORT WRITING

              Qualitative

              • Market drivers
              • Market challenges
              • Market trends
              • Five forces analysis

              Quantitative

              • Market size and forecast
              • Market segmentation
              • Geographical insights
              • Competitive landscape

              Interested in this report?

              Get your sample now to see our research methodology and insights!

              Download Now

              Frequently Asked Questions

              Fuel Management System market growth will increase by $ 435.4 mn during 2024-2028 .

              The Fuel Management System market is expected to grow at a CAGR of 6.77% during 2024-2028 .

              Fuel Management System market is segmented by Application( Fleet management, Fuel dispensing, Fuel storage monitoring, Others) End-user( Transport and Logistics, Oil and gas, Retail fuel stations, Others)

              Banlaw, Chevin Fleet Solutions, Cummins Inc., Danaher Corp., Dover Corp., E.J. Ward Inc., ESI Total Fuel Management, Franklin Electric Co. Inc., Hectronic GmbH, HID Global Corp., Multiforce Systems Corp., Orpak Systems Ltd., Piusi Spa, Romteck, SmartFlow Technologies, Sokolis, Syntech Systems Inc., Taabi, Triscan Group Ltd., Volaris Group Inc. are a few of the key vendors in the Fuel Management System market.

              North America will register the highest growth rate of 44% among the other regions. Therefore, the Fuel Management System market in North America is expected to garner significant business opportunities for the vendors during the forecast period.

              US, Germany, China, UK, Australia, Canada

              • Benefits offered by fuel management systems is the driving factor this market.

              The Fuel Management System market vendors should focus on grabbing business opportunities from the Fleet management segment as it accounted for the largest market share in the base year.