Smart Fleet Management Market Analysis Report: By Application (Tracking, ADAS, Optimization, Fuel cards, Automatic vehicle identification), By Type (Roadways, Railroad, Marine, Aviation),By Connectivity (Short, Long, and Cloud), By Solution (Tracking and Optimization) By Region - Growth Trends & Forecasts 2024-2028

Smart Fleet Management Market Analysis Report:
By Application (Tracking, ADAS, Optimization, Fuel cards, Automatic vehicle identification), By Type (Roadways, Railroad, Marine, Aviation),By Connectivity (Short, Long, and Cloud), By Solution (Tracking and Optimization) By Region - Growth Trends & Forecasts 2024-2028

Published: May 2024 198 Pages SKU: IRTNTR43715

Market Overview at a Glance

$241.6 B
Market Opportunity
8.8%
CAGR
7.9
YoY growth 2023-2024(%)

Smart Fleet Management Market Size 2024-2028 

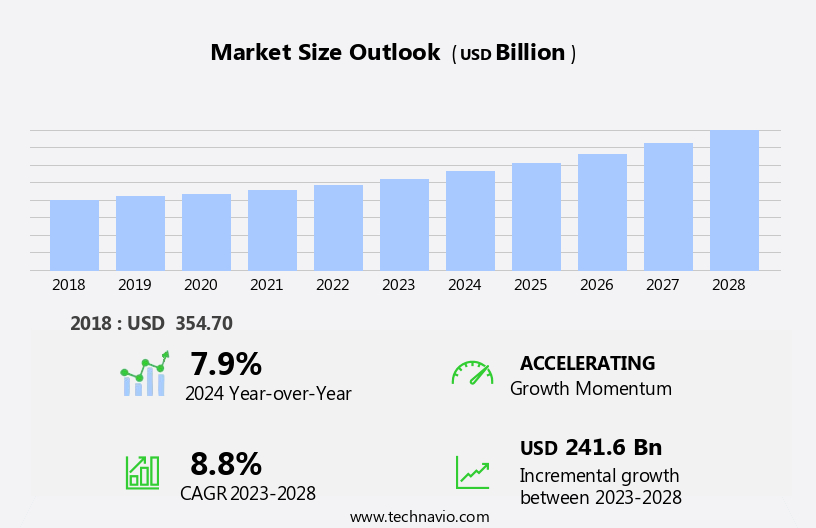
The smart fleet management market size is forecast to increase by USD 241.6 billion at a CAGR of 8.8% between 2023 and 2028.

  • The Smart Fleet Management market is experiencing significant growth driven by several key factors. Government regulations mandating efficient fleet operations and the increasing adoption of fleet telematics, autonomous vehicles, and electric vehicles are major growth drivers. Fleet operators across various transportation mediums are increasingly relying on real-time monitoring and vehicle tracking through cloud-based technology and fleet tracking systems. These IoT-enabled solutions enable fleet owners to effectively manage their assets, optimize fuel consumption, leverage predictive maintenance for proactive vehicle upkeep, and ensure two-way communication between vehicles and the server. This facilitates improved logistics and operational efficiency. However, cybersecurity concerns and the need for robust security features within these intelligent transportation systems pose challenges to market growth. Despite these challenges, the market is expected to witness continued expansion as fleet management becomes an integral part of modern business operations across various industries.

What will be the Size of the Smart Fleet Management Market During the Forecast Period?

Smart Fleet Management Market Size

 Request Free Sample

  • The market is witnessing significant growth due to the increasing adoption of connectivity in various modes of transportation, including ships and road vehicles. A smart transport system is a solution that integrates real-time monitoring, data analysis, automation in automotive sector and security features to enhance transport safety, reduce energy consumption, and improve fleet operators' efficiency. Governing bodies and legislations are playing a crucial role in promoting the adoption of electric vehicles , smart fleet management systems. These systems help in reducing theft activities and road accidents by providing real-time alerts and anti-theft notifications. Fleet operators can effectively manage their fleet by optimizing route planning, vehicle maintenance, and driver performance.
  • Moreover, smart fleet management solutions enable real-time monitoring of fuel consumption and provide data analysis to help fleet operators make informed decisions. The integration of security features ensures the safe transmission of data to a remote server, providing peace of mind to fleet operators. In conclusion, the market is transforming the transportation medium by offering advanced features to enhance safety, efficiency, and productivity.

How is this Smart Fleet Management Industry segmented and which is the largest segment?

The smart fleet management industry research report provides comprehensive data (region-wise segment analysis), with forecasts and estimates in "USD billion" for the period 2024-2028, as well as historical data from 2018-2022 for the following segments.

  • Application
    • Tracking
    • ADAS
    • Optimization
    • Fuel cards
    • Automatic vehicle identification
  • Type
    • Roadways
    • Railroad
    • Marine
    • Aviation
  • Connectivity
    • Short
    • Long
    • Cloud
  • Software
    • Tracking
    • Optimization
  • Geography
    • APAC
      • China
      • Japan
      • India
    • Europe
      • Germany
      • UK
      • Spain
    • North America
      • US
      • Canada
    • Middle East and Africa
      • South Africa
    • South America
      • Brazil

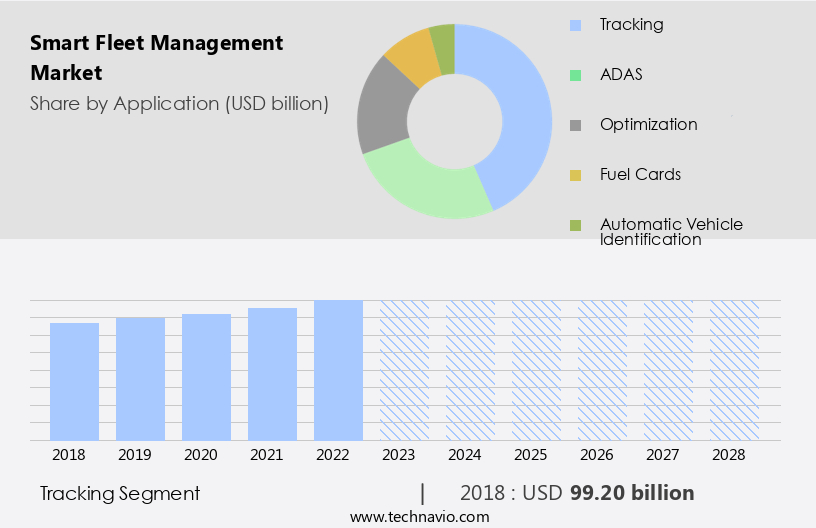
By Application Insights

  • The tracking segment is estimated to witness significant growth during the forecast period.

Smart fleet management solutions have gained significant traction In the production and operation of vehicle fleets due to their potential to enhance efficiency and productivity. Real-time monitoring of vehicle locations and movements, facilitated by GPS tracking devices, enables fleet managers to optimize routes, minimize idling time, and reduce unnecessary travel. This technology also allows for the remote monitoring of driver performance, energy consumption, collisions, and theft activities, ensuring a high level of security and accountability. With the increasing penetration rates of connectivity types such as 4G and 5G, the growth potential for smart fleet management systems is immense. Governing bodies are also promoting the adoption of these systems to minimize road accidents and improve overall transport system performance.By integrating real-time traffic data and advanced analytics, fleet managers can make informed decisions, ultimately leading to a more efficient and profitable fleet production.

Smart Fleet Management Market Size

Get a glance at the  Smart Fleet Management Industry report of share of various segments Request Free Sample

The Tracking segment was valued at USD 99.20 billion in 2018 and showed a gradual increase during the forecast period.

Regional Analysis

  • APAC is estimated to contribute 43% to the growth of the global market during the forecast period.

Technavio's analysts have elaborately explained the regional trends and drivers that shape the market during the forecast period.

Smart Fleet Management Market Share by Geography

For more insights on the market share of various regions, Request Free Sample

The market is experiencing significant growth due to increasing vehicle production and fleet penetration rates. Real-Time Monitoring technology is a key driver of this market, enabling efficient tracking of collisions, energy consumption, and driver performance. Connectivity type, including 3G, 4G, and satellite, is a crucial factor In the market's growth potential. Governing bodies' focus on fleet safety regulations has mandated transportation OEMs to install safety features, leading to market expansion. The APAC region, particularly China, India, Japan, Malaysia, Australia, and Singapore, will witness the highest growth due to the surge in transport facilities and changing socioeconomic conditions. The rise of e-commerce and the need for logistics companies to enhance fleet management efficiency and customer service are also fueling market growth.

The Smart Transport System is essential for tracking goods status, ensuring timely delivery and improving overall operational efficiency. Theft activities and road accidents are significant challenges for fleet operators, making the implementation of smart fleet management systems increasingly important.

Key Companies & Market Insights

Companies are implementing various strategies, such as strategic alliances, smart fleet management market forecast, partnerships, mergers and acquisitions, geographical expansion, and product/service launches, to enhance their presence In the industry.

The industry research and growth report includes detailed analyses of the competitive landscape of the market and information about key companies, including:

  • Avnet Inc.
  • Cisco Systems Inc.
  • CLM Fleet Management Plc
  • Continental AG
  • Cyrrup Solutions Pvt. Ltd.
  • DENSO Corp.
  • FleetGO Group Ltd.
  • Fleetsmart
  • International Business Machines Corp.
  • Oracle Corp.
  • ORBCOMM Inc.
  • Robert Bosch GmbH
  • Samsung Electronics Co. Ltd.
  • Siemens AG
  • Semtech Corp.
  • Speedcast
  • Tech Mahindra Ltd.
  • TomTom NV
  • Total Motion Ltd.
  • Trakm8 Holdings Plc

Qualitative and quantitative analysis of companies has been conducted to help clients understand the wider business environment as well as the strengths and weaknesses of key industry players. Data is qualitatively analyzed to categorize companies as pure play, category-focused, industry-focused, and diversified; it is quantitatively analyzed to categorize companies as dominant, leading, strong, tentative, and weak.

Market Dynamics

Our smart fleet management market researchers analyzed the data with 2023 as the base year, along with the key drivers, trends, and challenges. A holistic analysis of drivers will help companies refine their marketing strategies to gain a competitive advantage.The market is witnessing significant growth, driven by the increasing adoption of IoT, AI, and advanced telematics technologies. Key drivers include stringent government regulations, the rise of autonomous vehicles, and the growing emphasis on data-driven decision-making. Fleet operators are leveraging IoT devices, such as GPS trackers and telematics systems, to optimize routes, improve fuel efficiency, and enhance driver safety. AI algorithms enable predictive maintenance, while ADAS technologies contribute to enhanced vehicle safety. This market presents significant opportunities for businesses seeking to improve operational efficiency, reduce costs, and gain a competitive edge in the evolving transportation landscape.

What are the key market drivers leading to the rise In the adoption of Smart Fleet Management Industry?

Government regulations for fleet management is the key driver of the market.

  • The market is experiencing significant growth due to increasing subsidies from governments worldwide to promote efficient fleet management. Governments in countries such as the US, China, and Russia are implementing initiatives to enhance transport safety and reduce operational costs for fleet operators. These regulations, aimed at ensuring compliance with international safety standards, are driving the demand for advanced fleet management solutions. Solution providers are responding to the legal requirements and fleet operators' needs by offering comprehensive systems that monitor and optimize the performance of various modes of transportation, including ships, vessels with containers, automotive, and rolling stock. By utilizing connectivity and data analysis, these solutions enable fleet operators to improve safety, reduce fuel consumption, and increase productivity.
  • The competition in this market is intense, with secondary sources and paid databases providing valuable insights to market experts employing a bottom-up approach for business intelligence.

What are the market trends shaping the Smart Fleet Management Industry?

Increasing adoption of telematics and autonomous vehicles, and growing incorporation of electronic vehicles in company fleet is the upcoming market trend.

  • The market is driven by the integration of advanced technology, such as telematics, in various modes of transportation, including ships, vessels with containers, automotive, and rolling stock. Connectivity solutions enable real-time monitoring and analysis of fleet performance, ensuring compliance with legislations and enhancing transport safety. Telematics applications, such as adaptive headlights, frontal crash avoidance systems, adaptive cruise control, and rear-view cameras for parking assistance, have significantly reduced the number of accidents. Autonomous vehicles, a futuristic innovation, are self-driven and operate without human intervention using technologies like GPS, LIDAR, radar, and advanced control systems. Although the acceptance of autonomous vehicles is still in its infancy, the competition mapping, secondary sources, and paid databases suggest a promising growth trajectory during the forecast period.
  • Fleet management experts employ a bottom-up approach to optimize fleet operations and ensure efficient utilization of resources.

What challenges does the Smart Fleet Management Industry face during its growth?

Fleet data management issues is a key challenge affecting the industry growth.

  • In the realm of fleet management, the integration of connectivity and technology has revolutionized the mode of transportation for various industries, including maritime, automotive, and rail. This transformation is driven by the need for comprehensive data management to comply with legislations and prioritize transport safety. The use of cloud and mobile solutions has become increasingly popular, enabling real-time access to data from vessels, ships, containers, and rolling stock. Expert insights suggest that this trend will continue as competition mapping intensifies, and secondary sources and paid databases become essential tools for operators. The focus on performance management and regulatory reporting necessitates the collection and analysis of vast amounts of data, which can inform decisions related to fuel efficiency, maintenance schedules, and route optimization.
  • The bottom-up approach to fleet management, which involves gathering data from various sources, is now a critical success factor in this dynamic and competitive landscape.

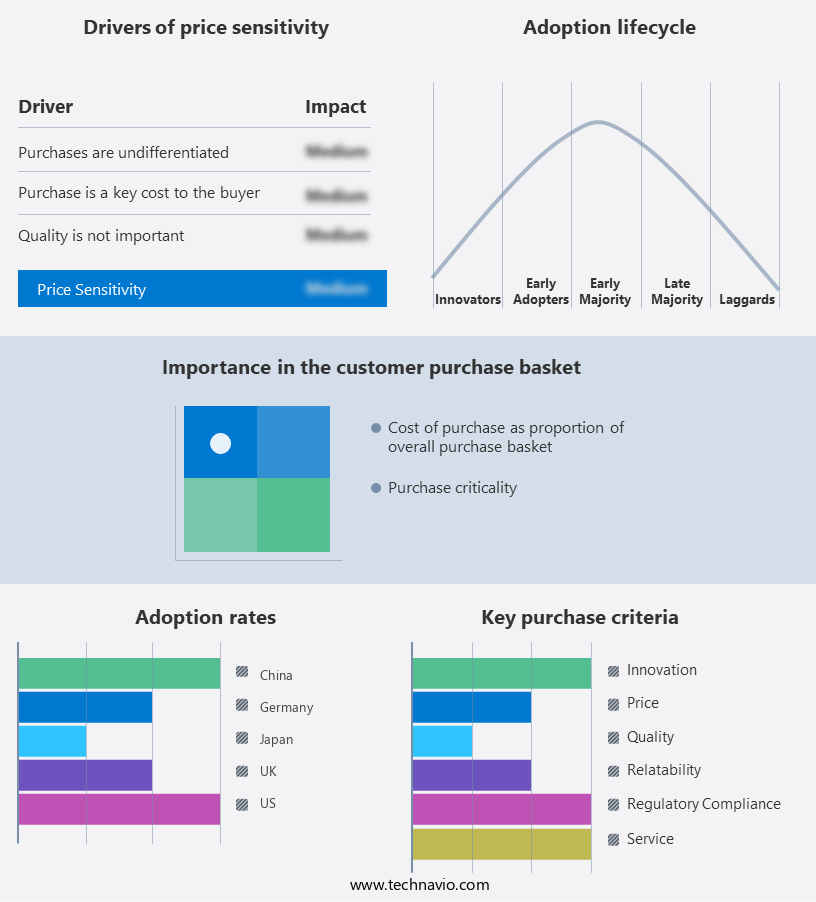
Exclusive Customer Landscape

The smart fleet management market forecasting report includes the adoption lifecycle of the market, covering from the innovator's stage to the laggard's stage. It focuses on adoption rates in different regions based on penetration. Furthermore, the smart fleet management market report also includes key purchase criteria and drivers of price sensitivity to help companies evaluate and develop their market growth analysis strategies.

Smart Fleet Management Market Share by Geography

 Customer Landscape

Lastest News and Recent Developments

  • In January 2024, Teltonika Telematics launched its new FMB960, a multi-purpose telematics device with advanced features such as 4G LTE connectivity, GNSS positioning, and enhanced fuel monitoring capabilities. This device is designed to meet the evolving needs of modern fleet management solutions, including real-time tracking, fuel efficiency optimization, and driver behavior analysis.

  • In March 2023, Verizon Connect acquired Fleetmatics, a leading provider of fleet management and mobile workforce solutions. This acquisition expanded Verizon Connect's global reach and strengthened its position in the telematics market, providing customers with a wider range of integrated solutions.

  • In June 2022, Google Cloud partnered with several major logistics companies to develop a joint venture focused on leveraging AI and machine learning to optimize fleet operations, improve route planning, and enhance predictive maintenance capabilities.

  • In September 2021, Samsara, a leading provider of connected operations platform, announced a significant expansion of its European operations, including new data centers and enhanced customer support. This move reflects the growing demand for connected fleet management solutions across the European market.

Research Analyst Overview

Smart fleet management is a mode of transportation that leverages digital technology application and connectivity to enhance the operational efficiency and productivity of fleet operations. This solution includes real-time monitoring, vehicle maintenance, fuel management, route planning, and driver behavior analysis. The connectivity type can be short-range or long-range, with cloud connectivity providing seamless infrastructure improvement and transportation improvement. Governing bodies and legislations play a crucial role In the growth potential of smart fleet management, with transport safety, energy consumption, and carbon emissions being key concerns. Fleet operators manage various types of transportation mediums, including ships, vessels with container loading, automotive, and rolling stock.

Smart fleet management technologies incorporate telematics, smart surveillance, real-time alerts, and two-way communication for asset management and cost savings. Fleet optimization is achieved through fleet tracking, fuel analytics, driving patterns, and autonomous dispatching. The market for smart fleet management is witnessing innovation in products, such as intelligent transportation systems, fleet optimization solutions, and cloud management solutions. However, cyber security concerns and data theft are major challenges that need to be addressed. Fleet owners benefit from cost-effective measures, such as remote diagnostics, real-time monitoring, and maintenance requirements. The bottom-up approach to fleet production and penetration rates of vehicle production indicate a significant growth potential for this market.

Smart fleet management solutions offer fleet operators real-time information, cost savings, and improved operational efficiency. The integration of hardware type, such as tracking devices and remote servers, with cloud-based technology provides security features and intelligent transportation system capabilities. In summary, smart fleet management is a growing market that offers significant benefits to fleet operators through the application of digital technology, connectivity, and fleet optimization solutions. The challenges include cyber security concerns and the need for infrastructure improvement, but the potential for cost savings, increased productivity, and improved safety make it an attractive investment for fleet owners.

Smart Fleet Management Market Scope

Report Coverage

Details

Page number

198

Base year

2023

Historic period

2018-2022

Forecast period

2024-2028

Growth momentum & CAGR

Accelerate at a CAGR of 8.8%

Market growth 2024-2028

USD 241.6 billion

Market structure

Fragmented

YoY growth 2023-2024(%)

7.9

Key countries

US, China, UK, Germany, and Japan

Competitive landscape

Leading Companies, Market Positioning of Companies, Competitive Strategies, and Industry Risks

Request Free Sample

What are the Key Data Covered in this Smart Fleet Management Market Research and Growth Report?

  • CAGR of the Smart Fleet Management industry during the forecast period
  • Detailed information on factors that will drive the Smart Fleet Management growth and forecasting between 2024 and 2028
  • Precise estimation of the size of the market and its contribution of the industry in focus to the parent market
  • Accurate predictions about upcoming growth and trends and changes in consumer behaviour
  • Growth of the market across APAC, Europe, North America, Middle East and Africa, and South America
  • Thorough analysis of the market's competitive landscape and detailed information about companies
  • Comprehensive analysis of factors that will challenge the smart fleet management market growth of industry companies

We can help! Our analysts can customize this smart fleet management market research report to meet your requirements.

Get in touch

1 Executive Summary

  • 1.1 Market overview
    • Executive Summary - Chart on Market Overview
    • Executive Summary - Data Table on Market Overview
    • Executive Summary - Chart on Global Market Characteristics
    • Executive Summary - Chart on Market by Geography
    • Executive Summary - Chart on Market Segmentation by Application
    • Executive Summary - Chart on Market Segmentation by Type
    • Executive Summary - Chart on Incremental Growth
    • Executive Summary - Data Table on Incremental Growth
    • Executive Summary - Chart on Company Market Positioning

2 Market Landscape

  • 2.1 Market ecosystem
    • Parent Market
    • Data Table on - Parent Market
  • 2.2 Market characteristics
    • Market characteristics analysis
  • 2.3 Value chain analysis
    • Value Chain Analysis

3 Market Sizing

  • 3.1 Market definition
    • Offerings of companies included in the market definition
  • 3.2 Market segment analysis
    • Market segments
  • 3.3 Market size 2023
    • 3.4 Market outlook: Forecast for 2023-2028
      • Chart on Global - Market size and forecast 2023-2028 ($ billion)
      • Data Table on Global - Market size and forecast 2023-2028 ($ billion)
      • Chart on Global Market: Year-over-year growth 2023-2028 (%)
      • Data Table on Global Market: Year-over-year growth 2023-2028 (%)

    4 Historic Market Size

    • 4.1 Global Smart Fleet Management Market 2018 - 2022
      • Historic Market Size - Data Table on Global Smart Fleet Management Market 2018 - 2022 ($ billion)
    • 4.2 Application segment analysis 2018 - 2022
      • Historic Market Size - Application Segment 2018 - 2022 ($ billion)
    • 4.3 Type segment analysis 2018 - 2022
      • Historic Market Size - Type Segment 2018 - 2022 ($ billion)
    • 4.4 Geography segment analysis 2018 - 2022
      • Historic Market Size - Geography Segment 2018 - 2022 ($ billion)
    • 4.5 Country segment analysis 2018 - 2022
      • Historic Market Size - Country Segment 2018 - 2022 ($ billion)

    5 Five Forces Analysis

    • 5.1 Five forces summary
      • Five forces analysis - Comparison between 2023 and 2028
    • 5.2 Bargaining power of buyers
      • Bargaining power of buyers - Impact of key factors 2023 and 2028
    • 5.3 Bargaining power of suppliers
      • Bargaining power of suppliers - Impact of key factors in 2023 and 2028
    • 5.4 Threat of new entrants
      • Threat of new entrants - Impact of key factors in 2023 and 2028
    • 5.5 Threat of substitutes
      • Threat of substitutes - Impact of key factors in 2023 and 2028
    • 5.6 Threat of rivalry
      • Threat of rivalry - Impact of key factors in 2023 and 2028
    • 5.7 Market condition
      • Chart on Market condition - Five forces 2023 and 2028

    6 Market Segmentation by Application

    • 6.1 Market segments
      • Chart on Application - Market share 2023-2028 (%)
      • Data Table on Application - Market share 2023-2028 (%)
    • 6.2 Comparison by Application
      • Chart on Comparison by Application
      • Data Table on Comparison by Application
    • 6.3 Tracking - Market size and forecast 2023-2028
      • Chart on Tracking - Market size and forecast 2023-2028 ($ billion)
      • Data Table on Tracking - Market size and forecast 2023-2028 ($ billion)
      • Chart on Tracking - Year-over-year growth 2023-2028 (%)
      • Data Table on Tracking - Year-over-year growth 2023-2028 (%)
    • 6.4 ADAS - Market size and forecast 2023-2028
      • Chart on ADAS - Market size and forecast 2023-2028 ($ billion)
      • Data Table on ADAS - Market size and forecast 2023-2028 ($ billion)
      • Chart on ADAS - Year-over-year growth 2023-2028 (%)
      • Data Table on ADAS - Year-over-year growth 2023-2028 (%)
    • 6.5 Optimization - Market size and forecast 2023-2028
      • Chart on Optimization - Market size and forecast 2023-2028 ($ billion)
      • Data Table on Optimization - Market size and forecast 2023-2028 ($ billion)
      • Chart on Optimization - Year-over-year growth 2023-2028 (%)
      • Data Table on Optimization - Year-over-year growth 2023-2028 (%)
    • 6.6 Fuel cards - Market size and forecast 2023-2028
      • Chart on Fuel cards - Market size and forecast 2023-2028 ($ billion)
      • Data Table on Fuel cards - Market size and forecast 2023-2028 ($ billion)
      • Chart on Fuel cards - Year-over-year growth 2023-2028 (%)
      • Data Table on Fuel cards - Year-over-year growth 2023-2028 (%)
    • 6.7 Automatic vehicle identification - Market size and forecast 2023-2028
      • Chart on Automatic vehicle identification - Market size and forecast 2023-2028 ($ billion)
      • Data Table on Automatic vehicle identification - Market size and forecast 2023-2028 ($ billion)
      • Chart on Automatic vehicle identification - Year-over-year growth 2023-2028 (%)
      • Data Table on Automatic vehicle identification - Year-over-year growth 2023-2028 (%)
    • 6.8 Market opportunity by Application
      • Market opportunity by Application ($ billion)
      • Data Table on Market opportunity by Application ($ billion)

    7 Market Segmentation by Type

    • 7.1 Market segments
      • Chart on Type - Market share 2023-2028 (%)
      • Data Table on Type - Market share 2023-2028 (%)
    • 7.2 Comparison by Type
      • Chart on Comparison by Type
      • Data Table on Comparison by Type
    • 7.3 Roadways - Market size and forecast 2023-2028
      • Chart on Roadways - Market size and forecast 2023-2028 ($ billion)
      • Data Table on Roadways - Market size and forecast 2023-2028 ($ billion)
      • Chart on Roadways - Year-over-year growth 2023-2028 (%)
      • Data Table on Roadways - Year-over-year growth 2023-2028 (%)
    • 7.4 Railroad - Market size and forecast 2023-2028
      • Chart on Railroad - Market size and forecast 2023-2028 ($ billion)
      • Data Table on Railroad - Market size and forecast 2023-2028 ($ billion)
      • Chart on Railroad - Year-over-year growth 2023-2028 (%)
      • Data Table on Railroad - Year-over-year growth 2023-2028 (%)
    • 7.5 Marine - Market size and forecast 2023-2028
      • Chart on Marine - Market size and forecast 2023-2028 ($ billion)
      • Data Table on Marine - Market size and forecast 2023-2028 ($ billion)
      • Chart on Marine - Year-over-year growth 2023-2028 (%)
      • Data Table on Marine - Year-over-year growth 2023-2028 (%)
    • 7.6 Aviation - Market size and forecast 2023-2028
      • Chart on Aviation - Market size and forecast 2023-2028 ($ billion)
      • Data Table on Aviation - Market size and forecast 2023-2028 ($ billion)
      • Chart on Aviation - Year-over-year growth 2023-2028 (%)
      • Data Table on Aviation - Year-over-year growth 2023-2028 (%)
    • 7.7 Market opportunity by Type
      • Market opportunity by Type ($ billion)
      • Data Table on Market opportunity by Type ($ billion)

    8 Market Segmentation by Connectivity

    • 8.1 Market segments
      • Chart on Connectivity - Market share (2023-2028) (%)
      • Data Table on Connectivity - Market share (2023-2028) (%)
    • 8.2 Comparison by Connectivity
      • Chart on Comparison by Connectivity
      • Data Table on Comparison by Connectivity
    • 8.3 Short - Market size and forecast (2023-2028)
      • Chart on Short - Market size and forecast (2023-2028) ($ million)
      • Data Table on Short - Market size and forecast (2023-2028) ($ million)
      • Chart on Short - Year-over-year growth (2023-2028) (%)
      • Data Table on Short - Year-over-year growth (2023-2028) (%)
    • 8.4 Long - Market size and forecast (2023-2028)
      • Chart on Long - Market size and forecast (2023-2028) ($ million)
      • Data Table on Long - Market size and forecast (2023-2028) ($ million)
      • Chart on Long - Year-over-year growth (2023-2028) (%)
      • Data Table on Long - Year-over-year growth (2023-2028) (%)
    • 8.5 Cloud - Market size and forecast (2023-2028)
      • Chart on Cloud - Market size and forecast (2023-2028) ($ million)
      • Data Table on Cloud - Market size and forecast (2023-2028) ($ million)
      • Chart on Cloud - Year-over-year growth (2023-2028) (%)
      • Data Table on Cloud - Year-over-year growth (2023-2028) (%)
    • 8.6 Market opportunity by Connectivity
      • Market opportunity by $segment_name ($ million)
      • Data Table on Market opportunity by $segment_name ($ million)

    9 Market Segmentation by Software

    • 9.1 Market segments
      • Chart on Software - Market share (2023-2028) (%)
      • Data Table on Software - Market share (2023-2028) (%)
    • 9.2 Comparison by Software
      • Chart on Comparison by Software
      • Data Table on Comparison by Software
    • 9.3 Tracking - Market size and forecast (2023-2028)
      • Chart on Tracking - Market size and forecast (2023-2028) ($ million)
      • Data Table on Tracking - Market size and forecast (2023-2028) ($ million)
      • Chart on Tracking - Year-over-year growth (2023-2028) (%)
      • Data Table on Tracking - Year-over-year growth (2023-2028) (%)
    • 9.4 Optimization - Market size and forecast (2023-2028)
      • Chart on Optimization - Market size and forecast (2023-2028) ($ million)
      • Data Table on Optimization - Market size and forecast (2023-2028) ($ million)
      • Chart on Optimization - Year-over-year growth (2023-2028) (%)
      • Data Table on Optimization - Year-over-year growth (2023-2028) (%)
    • 9.5 Market opportunity by Software
      • Market opportunity by $segment_name ($ million)
      • Data Table on Market opportunity by $segment_name ($ million)

    10 Customer Landscape

    • 10.1 Customer landscape overview
      • Analysis of price sensitivity, lifecycle, customer purchase basket, adoption rates, and purchase criteria

    11 Geographic Landscape

    • 11.1 Geographic segmentation
      • Chart on Market share by geography 2023-2028 (%)
      • Data Table on Market share by geography 2023-2028 (%)
    • 11.2 Geographic comparison
      • Chart on Geographic comparison
      • Data Table on Geographic comparison
    • 11.3 APAC - Market size and forecast 2023-2028
      • Chart on APAC - Market size and forecast 2023-2028 ($ billion)
      • Data Table on APAC - Market size and forecast 2023-2028 ($ billion)
      • Chart on APAC - Year-over-year growth 2023-2028 (%)
      • Data Table on APAC - Year-over-year growth 2023-2028 (%)
    • 11.4 Europe - Market size and forecast 2023-2028
      • Chart on Europe - Market size and forecast 2023-2028 ($ billion)
      • Data Table on Europe - Market size and forecast 2023-2028 ($ billion)
      • Chart on Europe - Year-over-year growth 2023-2028 (%)
      • Data Table on Europe - Year-over-year growth 2023-2028 (%)
    • 11.5 North America - Market size and forecast 2023-2028
      • Chart on North America - Market size and forecast 2023-2028 ($ billion)
      • Data Table on North America - Market size and forecast 2023-2028 ($ billion)
      • Chart on North America - Year-over-year growth 2023-2028 (%)
      • Data Table on North America - Year-over-year growth 2023-2028 (%)
    • 11.6 Middle East and Africa - Market size and forecast 2023-2028
      • Chart on Middle East and Africa - Market size and forecast 2023-2028 ($ billion)
      • Data Table on Middle East and Africa - Market size and forecast 2023-2028 ($ billion)
      • Chart on Middle East and Africa - Year-over-year growth 2023-2028 (%)
      • Data Table on Middle East and Africa - Year-over-year growth 2023-2028 (%)
    • 11.7 South America - Market size and forecast 2023-2028
      • Chart on South America - Market size and forecast 2023-2028 ($ billion)
      • Data Table on South America - Market size and forecast 2023-2028 ($ billion)
      • Chart on South America - Year-over-year growth 2023-2028 (%)
      • Data Table on South America - Year-over-year growth 2023-2028 (%)
    • 11.8 US - Market size and forecast 2023-2028
      • Chart on US - Market size and forecast 2023-2028 ($ billion)
      • Data Table on US - Market size and forecast 2023-2028 ($ billion)
      • Chart on US - Year-over-year growth 2023-2028 (%)
      • Data Table on US - Year-over-year growth 2023-2028 (%)
    • 11.9 China - Market size and forecast 2023-2028
      • Chart on China - Market size and forecast 2023-2028 ($ billion)
      • Data Table on China - Market size and forecast 2023-2028 ($ billion)
      • Chart on China - Year-over-year growth 2023-2028 (%)
      • Data Table on China - Year-over-year growth 2023-2028 (%)
    • 11.10 UK - Market size and forecast 2023-2028
      • Chart on UK - Market size and forecast 2023-2028 ($ billion)
      • Data Table on UK - Market size and forecast 2023-2028 ($ billion)
      • Chart on UK - Year-over-year growth 2023-2028 (%)
      • Data Table on UK - Year-over-year growth 2023-2028 (%)
    • 11.11 Germany - Market size and forecast 2023-2028
      • Chart on Germany - Market size and forecast 2023-2028 ($ billion)
      • Data Table on Germany - Market size and forecast 2023-2028 ($ billion)
      • Chart on Germany - Year-over-year growth 2023-2028 (%)
      • Data Table on Germany - Year-over-year growth 2023-2028 (%)
    • 11.12 Japan - Market size and forecast 2023-2028
      • Chart on Japan - Market size and forecast 2023-2028 ($ billion)
      • Data Table on Japan - Market size and forecast 2023-2028 ($ billion)
      • Chart on Japan - Year-over-year growth 2023-2028 (%)
      • Data Table on Japan - Year-over-year growth 2023-2028 (%)
    • 11.13 Market opportunity by geography
      • Market opportunity by geography ($ billion)
      • Data Tables on Market opportunity by geography ($ billion)

    12 Drivers, Challenges, and Opportunity/Restraints

    • 12.1 Market drivers
      • 12.2 Market challenges
        • 12.3 Impact of drivers and challenges
          • Impact of drivers and challenges in 2023 and 2028
        • 12.4 Market opportunities/restraints

          13 Competitive Landscape

          • 13.1 Overview
            • 13.2 Competitive Landscape
              • Overview on criticality of inputs and factors of differentiation
            • 13.3 Landscape disruption
              • Overview on factors of disruption
            • 13.4 Industry risks
              • Impact of key risks on business

            14 Competitive Analysis

            • 14.1 Companies profiled
              • Companies covered
            • 14.2 Market positioning of companies
              • Matrix on companies position and classification
            • 14.3 Avnet Inc.
              • Avnet Inc. - Overview
              • Avnet Inc. - Business segments
              • Avnet Inc. - Key offerings
              • Avnet Inc. - Segment focus
            • 14.4 Cisco Systems Inc.
              • Cisco Systems Inc. - Overview
              • Cisco Systems Inc. - Business segments
              • Cisco Systems Inc. - Key news
              • Cisco Systems Inc. - Key offerings
              • Cisco Systems Inc. - Segment focus
            • 14.5 CLM Fleet Management Plc
              • CLM Fleet Management Plc - Overview
              • CLM Fleet Management Plc - Product / Service
              • CLM Fleet Management Plc - Key offerings
            • 14.6 Continental AG
              • Continental AG - Overview
              • Continental AG - Business segments
              • Continental AG - Key news
              • Continental AG - Key offerings
              • Continental AG - Segment focus
            • 14.7 DENSO Corp.
              • DENSO Corp. - Overview
              • DENSO Corp. - Business segments
              • DENSO Corp. - Key news
              • DENSO Corp. - Key offerings
              • DENSO Corp. - Segment focus
            • 14.8 FleetGO Group Ltd.
              • FleetGO Group Ltd. - Overview
              • FleetGO Group Ltd. - Product / Service
              • FleetGO Group Ltd. - Key offerings
            • 14.9 Fleetsmart
              • Fleetsmart - Overview
              • Fleetsmart - Product / Service
              • Fleetsmart - Key offerings
            • 14.10 International Business Machines Corp.
              • International Business Machines Corp. - Overview
              • International Business Machines Corp. - Business segments
              • International Business Machines Corp. - Key news
              • International Business Machines Corp. - Key offerings
              • International Business Machines Corp. - Segment focus
            • 14.11 ORBCOMM Inc.
              • ORBCOMM Inc. - Overview
              • ORBCOMM Inc. - Product / Service
              • ORBCOMM Inc. - Key offerings
            • 14.12 Robert Bosch GmbH
              • Robert Bosch GmbH - Overview
              • Robert Bosch GmbH - Product / Service
              • Robert Bosch GmbH - Key news
              • Robert Bosch GmbH - Key offerings
            • 14.13 Siemens AG
              • Siemens AG - Overview
              • Siemens AG - Business segments
              • Siemens AG - Key news
              • Siemens AG - Key offerings
              • Siemens AG - Segment focus
            • 14.14 Semtech Corp.
              • Semtech Corp. - Overview
              • Semtech Corp. - Business segments
              • Semtech Corp. - Key news
              • Semtech Corp. - Key offerings
              • Semtech Corp. - Segment focus
            • 14.15 Speedcast
              • Speedcast - Overview
              • Speedcast - Product / Service
              • Speedcast - Key offerings
            • 14.16 Tech Mahindra Ltd.
              • Tech Mahindra Ltd. - Overview
              • Tech Mahindra Ltd. - Business segments
              • Tech Mahindra Ltd. - Key offerings
              • Tech Mahindra Ltd. - Segment focus
            • 14.17 TomTom NV
              • TomTom NV - Overview
              • TomTom NV - Business segments
              • TomTom NV - Key offerings
              • TomTom NV - Segment focus

            15 Appendix

            • 15.1 Scope of the report
              • 15.2 Inclusions and exclusions checklist
                • Inclusions checklist
                • Exclusions checklist
              • 15.3 Currency conversion rates for US$
                • Currency conversion rates for US$
              • 15.4 Research methodology
                • Research methodology
              • 15.5 Data procurement
                • Information sources
              • 15.6 Data validation
                • Data validation
              • 15.7 Validation techniques employed for market sizing
                • Validation techniques employed for market sizing
              • 15.8 Data synthesis
                • Data synthesis
              • 15.9 360 degree market analysis
                • 360 degree market analysis
              • 15.10 List of abbreviations
                • List of abbreviations

              Research Methodology

              Technavio presents a detailed picture of the market by way of study, synthesis, and summation of data from multiple sources. The analysts have presented the various facets of the market with a particular focus on identifying the key industry influencers. The data thus presented is comprehensive, reliable, and the result of extensive research, both primary and secondary.

              INFORMATION SOURCES

              Primary sources

              • Manufacturers and suppliers
              • Channel partners
              • Industry experts
              • Strategic decision makers

              Secondary sources

              • Industry journals and periodicals
              • Government data
              • Financial reports of key industry players
              • Historical data
              • Press releases

              DATA ANALYSIS

              Data Synthesis

              • Collation of data
              • Estimation of key figures
              • Analysis of derived insights

              Data Validation

              • Triangulation with data models
              • Reference against proprietary databases
              • Corroboration with industry experts

              REPORT WRITING

              Qualitative

              • Market drivers
              • Market challenges
              • Market trends
              • Five forces analysis

              Quantitative

              • Market size and forecast
              • Market segmentation
              • Geographical insights
              • Competitive landscape

              Interested in this report?

              Get your sample now to see our research methodology and insights!

              Download Now

              Frequently Asked Questions

              Smart Fleet Management market growth will increase by $ 241.6 bn during 2024-2028.

              The Smart Fleet Management market is expected to grow at a CAGR of 8.8% during 2024-2028.

              Smart Fleet Management market is segmented by Application( Tracking, ADAS, Optimization, Fuel cards, Automatic vehicle identification) Type( Roadways, Railroad, Marine, Aviation, South America)

              Avnet Inc., Cisco Systems Inc., CLM Fleet Management Plc, Continental AG, Cyrrup Solutions Pvt. Ltd., DENSO Corp., FleetGO Group Ltd., Fleetsmart, International Business Machines Corp., Oracle Corp., ORBCOMM Inc., Robert Bosch GmbH, Samsung Electronics Co. Ltd., Siemens AG, Semtech Corp., Speedcast, Tech Mahindra Ltd., TomTom NV, Total Motion Ltd., Trakm8 Holdings Plc are a few of the key vendors in the Smart Fleet Management market.

              APAC will register the highest growth rate of 43% among the other regions. Therefore, the Smart Fleet Management market in APAC is expected to garner significant business opportunities for the vendors during the forecast period.

              US, China, UK, Germany, Japan

              • Government regulations for fleet managementSurging subsidies by the government for efficient fleet management are attracting new companies to foray into the global smart fleet management market. Different initiatives are taken by governments of various countries is the driving factor this market.
              • such as the US is the driving factor this market.
              • China is the driving factor this market.
              • and Russia is the driving factor this market.
              • to increase safety and the demand by fleet operators for tracking vehicles is the driving factor this market.
              • thereby reducing transportation costs. Stringent government regulations pertaining to safety are expected to boost the demand for fleet management systems.Fleet operators run several vehicles is the driving factor this market.
              • and some of them may breach the standard international jurisdiction on pre-decided safe emission levels and other frameworks. Solution providers understand these needs and requirements from a legal point of view. Fuel management and driver behavior monitoring solutions allow the operator to operate within the legal framework. The number of accidents is reduced is the driving factor this market.
              • the frequency of repairs is increased is the driving factor this market.
              • and the establishment of KPIs ensures analyzable metrics that provide the basis for sustainable decisions.Fleet operators are increasingly focusing on regulating their work environment and are closely monitoring fleet vehicles and the behavioral patterns of drivers. Governments are also insisting on increasing the monitoring of fleet vehicles to improve safety and reduce the number of accidents that can occur because of driver negligence. The enforcement of fleet management regulations is increasing is the driving factor this market.
              • such as the Compliance Safety Accountability (CSA) program launched by the Department of Transportation's Federal Motor Carrier Safety Administration in the US. In addition is the driving factor this market.
              • the Federal Travel Regulation (FTR) is the driving factor this market.
              • Facilitating the Federal Fleet Policy Council (FEDFLEET) is the driving factor this market.
              • and Federal Management Regulation (FMR) are also regulating fleet management in the US.The increasing number of regulations coming into effect this year and in the future will drive a relentless focus on software and data. Owners and operators will increasingly look for ways to automate the reporting of regulatory and operational data is the driving factor this market.
              • leading to greater efficiency and simpler shoreside intervention and control.As an example is the driving factor this market.
              • the European Union's ship emissions monitoring is the driving factor this market.
              • reporting is the driving factor this market.
              • and verification (MRV) initiative will create a major reporting obligation. But the data required overlaps with the data needed for vessel performance management. A well-integrated software solution will support both compliance and efficient operations. The classification of the fleet is becoming more data-driven is the driving factor this market.
              • relying on the performance data collected and analyzed by sophisticated software systems. The trend toward condition-based classification that requires data and underlying applications to interpret the data will align the interests of shipowners and classification societies in the pursuit of software solutions. is the driving factor this market.

              The Smart Fleet Management market vendors should focus on grabbing business opportunities from the Tracking segment as it accounted for the largest market share in the base year.