Commercial Vehicle Fleet Management System Market Analysis, Size, and Forecast 2026-2030: North America (US, Canada, and Mexico), APAC (China, Japan, and India), Europe (Germany, UK, and France), South America (Brazil and Argentina), Middle East and Africa (Saudi Arabia, UAE, and South Africa), and Rest of World (ROW)

Commercial Vehicle Fleet Management System Market Analysis, Size, and Forecast 2026-2030:
North America (US, Canada, and Mexico), APAC (China, Japan, and India), Europe (Germany, UK, and France), South America (Brazil and Argentina), Middle East and Africa (Saudi Arabia, UAE, and South Africa), and Rest of World (ROW)

Published: Mar 2026 291 Pages SKU: IRTNTR73183

Market Overview at a Glance

$9.86 B
Market Opportunity
8%
CAGR 2025 - 2030
34.7%
North America Growth
$17.50 B
Third party segment 2024

Commercial Vehicle Fleet Management System Market Size 2026-2030

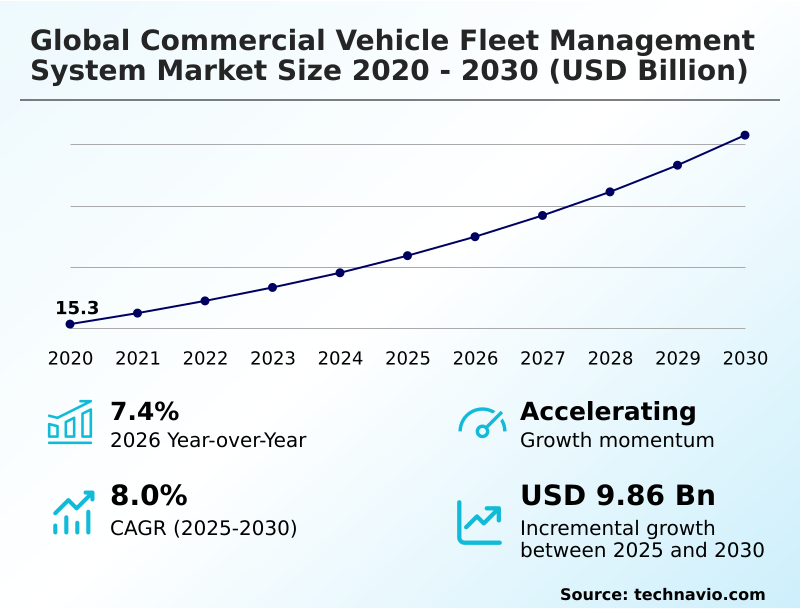
The commercial vehicle fleet management system market size is valued to increase by USD 9.86 billion, at a CAGR of 8% from 2025 to 2030. High-cost pressure on fleet operators will drive the commercial vehicle fleet management system market.

Major Market Trends & Insights

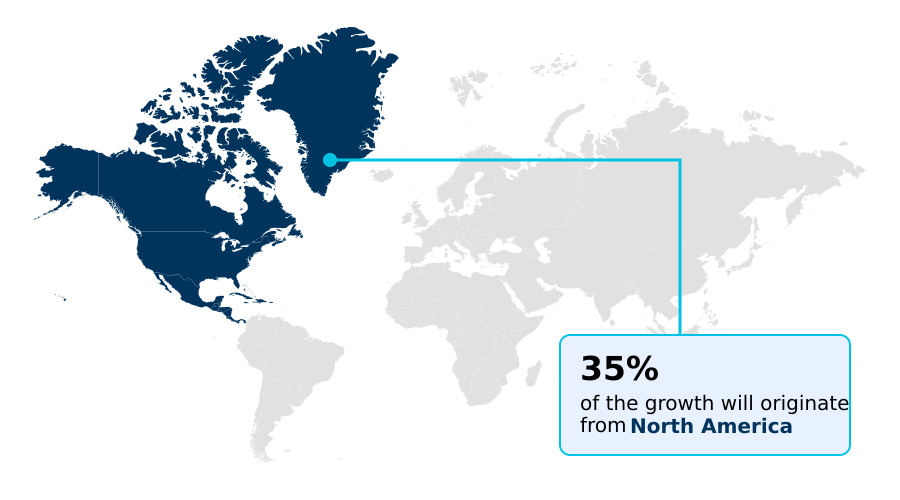
  • North America dominated the market and accounted for a 34.7% growth during the forecast period.
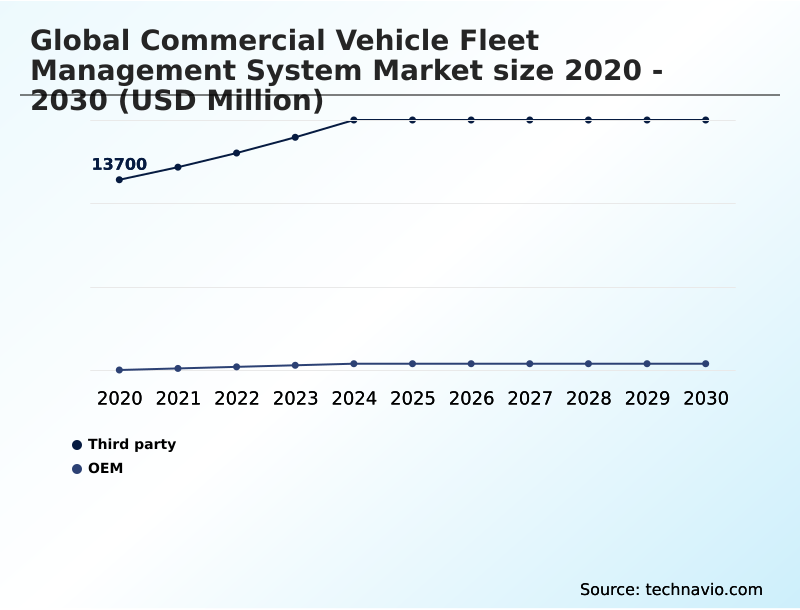
  • By Product - Third party segment was valued at USD 17.50 billion in 2024
  • By Component - Software segment accounted for the largest market revenue share in 2024

Market Size & Forecast

  • Market Opportunities: USD 15.46 billion
  • Market Future Opportunities: USD 9.86 billion
  • CAGR from 2025 to 2030 : 8%

Market Summary

  • The commercial vehicle fleet management system market is driven by the imperative for operational efficiency and safety. Integrating technologies such as real-time vehicle tracking and telematics data integration allows businesses to optimize logistics and reduce expenses.
  • A key driver is the intense cost pressure on operators, pushing for the adoption of tools for precise fuel consumption analytics and predictive maintenance alerts to minimize vehicle downtime. Trends are moving toward comprehensive platforms offering 360-degree oversight, with a focus on advanced analytics and AI-powered dash cams for driver behavior monitoring.
  • For instance, a national logistics company can leverage a cloud-based fleet platform to implement in-cab driver coaching based on driver scoring models, improving safety and reducing insurance premiums. However, challenges such as the high initial cost of aftermarket telematics hardware and ensuring robust data security for sensitive cargo security monitoring remain significant hurdles.
  • The evolution of OEM-embedded telematics and IoT sensor integration continues to shape the competitive landscape, offering deeper vehicle diagnostics and enhanced capabilities for cold chain monitoring and ensuring electronic logging device (ELD) compliance.

What will be the Size of the Commercial Vehicle Fleet Management System Market during the forecast period?

Get Key Insights on Market Forecast (PDF) Request Free Sample

How is the Commercial Vehicle Fleet Management System Market Segmented?

The commercial vehicle fleet management system industry research report provides comprehensive data (region-wise segment analysis), with forecasts and estimates in "USD million" for the period 2026-2030, as well as historical data from 2020-2024 for the following segments.

  • Product
    • Third party
    • OEM
  • Component
    • Software
    • Hardware
    • Services
  • Deployment
    • Cloud based
    • On premises
  • Geography
    • North America
      • US
      • Canada
      • Mexico
    • APAC
      • China
      • Japan
      • India
    • Europe
      • Germany
      • UK
      • France
    • South America
      • Brazil
      • Argentina
    • Middle East and Africa
      • Saudi Arabia
      • UAE
      • South Africa
    • Rest of World (ROW)

By Product Insights

The third party segment is estimated to witness significant growth during the forecast period.

The global commercial vehicle fleet management system market 2026-2030 is significantly shaped by third-party providers, which offer platform-agnostic solutions compatible with mixed-vehicle fleets.

These independent vendors deliver flexibility through customizable features such as advanced route optimization algorithms and AI-powered dash cams for driver behavior monitoring.

By focusing solely on telematics data integration and software, they often introduce cutting-edge tools for predictive maintenance alerts and fuel consumption analytics more rapidly than traditional vehicle manufacturers.

This specialization fosters a competitive environment where cloud-based fleet platforms are enhanced to improve asset utilization metrics.

For instance, integration of environmental sensors has been shown to improve cargo condition monitoring precision by over 30%, a critical advantage for logistics firms seeking a single, interoperable source for operational oversight.

Request Free Sample

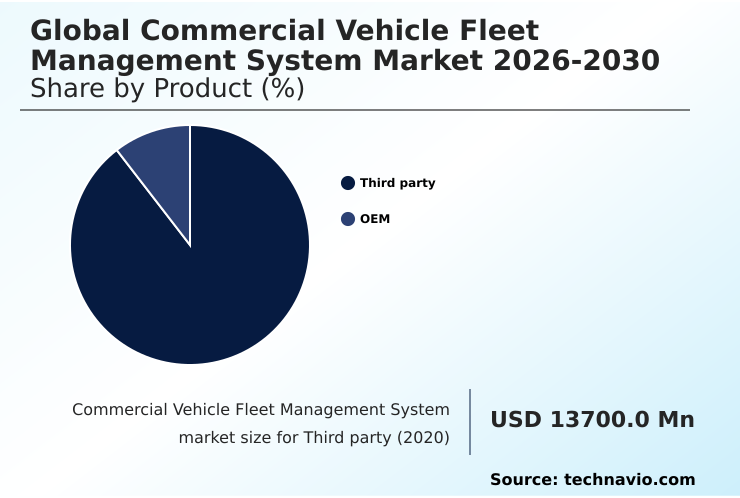
The Third party segment was valued at USD 17.50 billion in 2024 and showed a gradual increase during the forecast period.

Request Free Sample

Regional Analysis

North America is estimated to contribute 34.7% to the growth of the global market during the forecast period.Technavio’s analysts have elaborately explained the regional trends and drivers that shape the market during the forecast period.

See How Commercial Vehicle Fleet Management System Market Demand is Rising in North America Request Free Sample

The geographic landscape of the global commercial vehicle fleet management system market 2026-2030 is varied, with North America representing a mature market focused on advanced fleet safety analytics and ELD compliance, contributing over 34% of the market's incremental growth.

In contrast, the APAC region is experiencing rapid adoption driven by e-commerce growth and infrastructure development, with a strong focus on real-time vehicle tracking and asset utilization metrics.

European markets prioritize regulatory compliance management and fleet sustainability metrics, pushing for OEM-embedded telematics and solutions that support driver safety programs.

In South America and the Middle East and Africa, the demand is centered on cargo security monitoring and asset tracking and recovery to combat theft and improve supply chain visibility, with satellite-based systems being crucial in areas with limited connectivity, improving asset recovery rates by up to 90%.

Market Dynamics

Our researchers analyzed the data with 2025 as the base year, along with the key drivers, trends, and challenges. A holistic analysis of drivers will help companies refine their marketing strategies to gain a competitive advantage.

  • Businesses evaluating fleet management solutions must consider several critical factors to maximize returns. For instance, understanding the benefits of video telematics for fleets is essential for improving driver safety monitoring and reducing liability.
  • A key decision point is the OEM vs aftermarket telematics ROI, where factory-installed systems offer deep vehicle diagnostics integration, while aftermarket solutions provide greater flexibility for mixed fleets. Companies seeking to implement predictive maintenance for trucks can leverage telematics data for insurance discounts, as proactive repairs reduce accident frequency.
  • Many explore how to reduce fleet fuel costs through route optimization and driver behavior coaching, which are top features of fleet management software. For smaller operations, finding the right fleet management software for small business that balances cost and functionality is paramount. The choice between a cloud-based vs on-premise FMS often hinges on security needs and IT capabilities.
  • Moreover, effective vehicle maintenance scheduling automation can decrease unplanned downtime by over 20% compared to manual methods. Integrating TMS with telematics data provides a holistic view, improving last-mile delivery efficiency. As the industry shifts toward greener operations, fleet management for electric commercial vehicles, including battery health and charging logistics, is becoming a important capability.
  • Ultimately, using AI in fleet safety management and real-time asset tracking solutions helps in calculating fleet total cost of ownership more accurately and ensuring cold chain logistics monitoring technology maintains product integrity.

What are the key market drivers leading to the rise in the adoption of Commercial Vehicle Fleet Management System Industry?

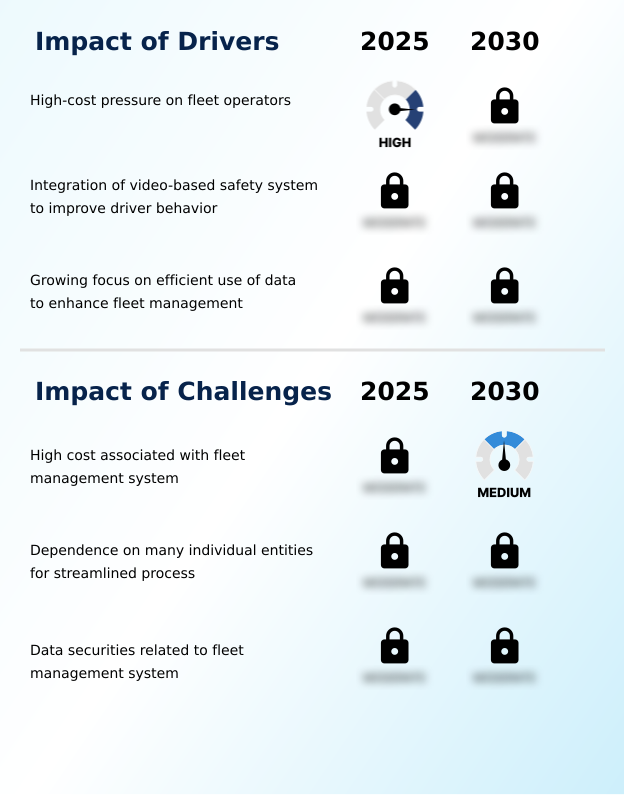
  • High-cost pressure on fleet operators is a key driver for the market, compelling companies to adopt advanced management technologies to protect profit margins.

  • The primary drivers for the global commercial vehicle fleet management system market 2026-2030 revolve around cost reduction, safety enhancement, and data utilization.
  • Intense cost pressure compels operators to adopt tools for fuel consumption analytics and route planning and scheduling, which can lower fuel expenses by 10-15%.
  • The integration of video telematics solutions, including AI-powered dash cams for driver behavior monitoring, is a powerful catalyst, as it improves driver safety programs and can reduce liability costs by providing clear evidence in incident investigations.
  • This technology has been linked to a 60% reduction in critical safety events.
  • Additionally, the growing focus on leveraging logistics data analytics transforms operations from reactive to proactive, enabling better vehicle lifecycle management and last-mile delivery optimization through real-time adjustments, ultimately improving customer satisfaction and driver retention strategies.

What are the market trends shaping the Commercial Vehicle Fleet Management System Industry?

  • An upcoming market trend is the growing popularity of 360-degree fleet management systems (FMS). These systems provide comprehensive and unified platforms for complete vehicle and driver oversight.

  • Key trends in the global commercial vehicle fleet management system market 2026-2030 are driving a shift toward holistic, data-centric operations. The adoption of 360-degree platforms that unify dispatch management software with functions like driver performance scorecards and preventative maintenance scheduling is growing.
  • This integration improves fleet operational efficiency by eliminating data silos and can reduce administrative overhead by up to 20%. Another significant development is the collaboration between vehicle manufacturers and technology suppliers for pre-installed, OEM-embedded telematics, which improves data accuracy from vehicle diagnostics codes and reduces TCO.
  • Furthermore, the use of advanced analytics on telematics data, including geospatial data analysis, helps reduce risk severity, with some fleets reporting a 15% decrease in accident-related costs after implementation. These trends foster greater supply chain visibility and support new services like insurance telematics data.

What challenges does the Commercial Vehicle Fleet Management System Industry face during its growth?

  • The high cost associated with fleet management systems is a key challenge affecting industry growth, particularly for small and medium-sized enterprises.

  • Key challenges in the global commercial vehicle fleet management system market 2026-2030 stem from high costs, operational fragmentation, and data security concerns. The initial investment in aftermarket telematics hardware and software subscriptions presents a significant barrier, with total first-year costs sometimes being 50% higher than baseline operational budgets for smaller fleets.
  • The dependence on multiple vendors for hardware, software, and connectivity creates integration complexities, leading to system inefficiencies. Most importantly, ensuring the security of connected vehicle data platforms against cyber threats is paramount, as a single breach can compromise sensitive cargo security monitoring and ELD compliance data, potentially resulting in regulatory fines that exceed 4% of annual revenue.
  • These factors demand a strategic approach to technology adoption, balancing functionality with robust security and a clear ROI.

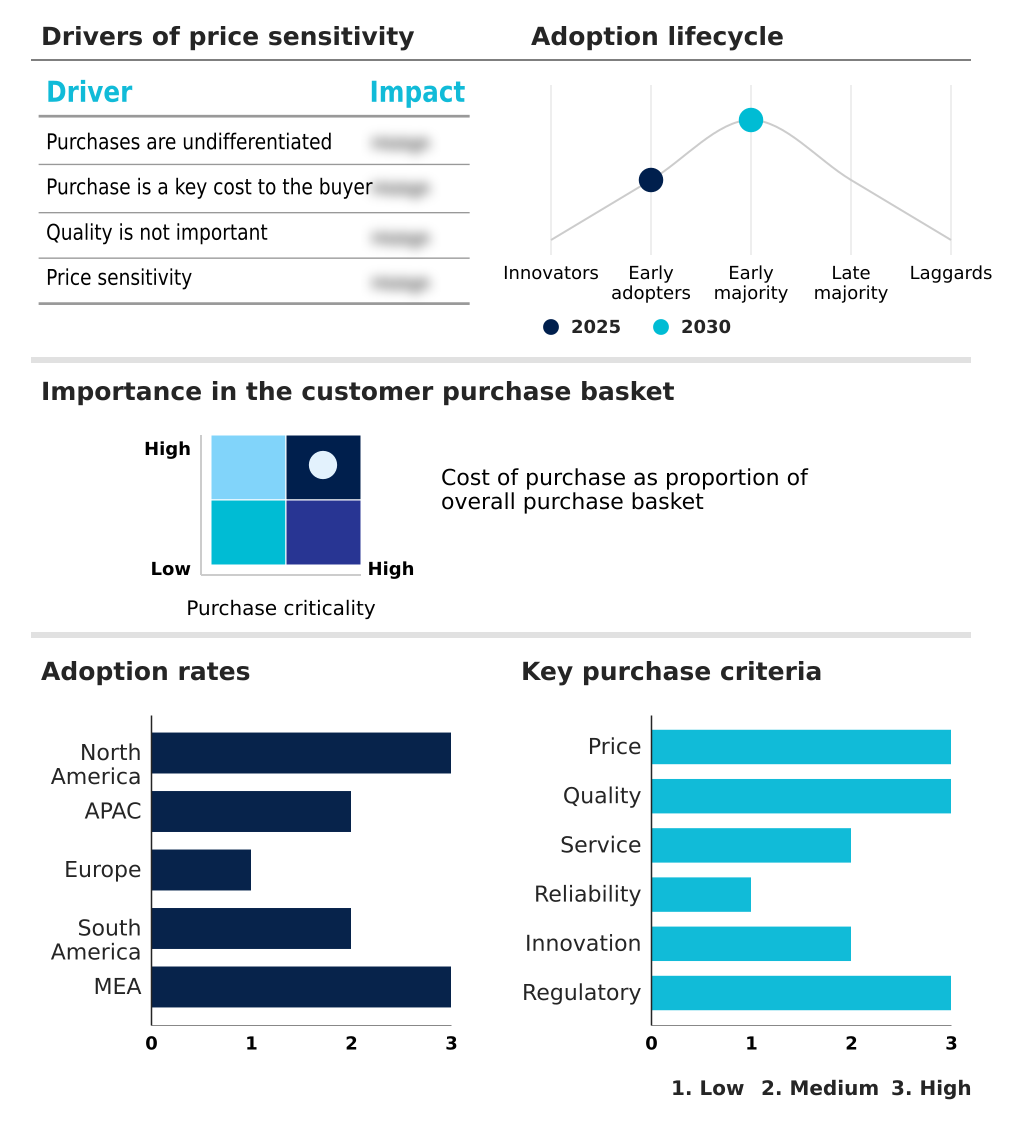
Exclusive Technavio Analysis on Customer Landscape

The commercial vehicle fleet management system market forecasting report includes the adoption lifecycle of the market, covering from the innovator’s stage to the laggard’s stage. It focuses on adoption rates in different regions based on penetration. Furthermore, the commercial vehicle fleet management system market report also includes key purchase criteria and drivers of price sensitivity to help companies evaluate and develop their market growth analysis strategies.

Customer Landscape of Commercial Vehicle Fleet Management System Industry

Competitive Landscape

Companies are implementing various strategies, such as strategic alliances, commercial vehicle fleet management system market forecast, partnerships, mergers and acquisitions, geographical expansion, and product/service launches, to enhance their presence in the industry.

AB Volvo - Key offerings include integrated platforms providing telematics, real-time tracking, safety monitoring, and solutions for optimizing operational efficiency and compliance across commercial fleets.

The industry research and growth report includes detailed analyses of the competitive landscape of the market and information about key companies, including:

  • AB Volvo
  • Azuga Inc.
  • CalAmp Corp.
  • Fleet Complete
  • Fleetio Inc.
  • Fleetx Technologies Pvt. Ltd.
  • Geotab Inc.
  • Gurtam
  • IntelliShift
  • Michelin
  • Motive Technologies Inc.
  • Nauto Inc.
  • Navixy
  • Omnitracs LLC
  • PowerFleet Inc.
  • Samsara Inc.
  • Spireon LLC
  • Teletrac Navman US Ltd.
  • Vamosys Systems Pvt. Ltd.
  • Zonar Systems Inc.

Qualitative and quantitative analysis of companies has been conducted to help clients understand the wider business environment as well as the strengths and weaknesses of key industry players. Data is qualitatively analyzed to categorize companies as pure play, category-focused, industry-focused, and diversified; it is quantitatively analyzed to categorize companies as dominant, leading, strong, tentative, and weak.

Recent Development and News in Commercial vehicle fleet management system market

  • In January, 2025, Samsara announced a major expansion of its asset tracking capabilities by integrating new environmental sensors that allow logistics companies to monitor the real time condition of high value cargo more precisely than ever before.
  • In February, 2025, Daimler Truck launched its latest generation of the Detroit Connect platform, which introduced a new suite of predictive safety features designed to automatically intervene during high-risk maneuvers based on real time sensor data.
  • In March, 2025, Geotab introduced a revolutionary generative AI tool that allows fleet managers to query their data using natural language, which significantly reduces the time required to generate complex performance reports.
  • In April, 2025, Motive unveiled its new AI Omni Camera, which features a dual-core processor capable of identifying unauthorized passengers and cargo shifting while the vehicle is in motion.

Dive into Technavio’s robust research methodology, blending expert interviews, extensive data synthesis, and validated models for unparalleled Commercial Vehicle Fleet Management System Market insights. See full methodology.

Market Scope
Page number 291
Base year 2025
Historic period 2020-2024
Forecast period 2026-2030
Growth momentum & CAGR Accelerate at a CAGR of 8%
Market growth 2026-2030 USD 9857.1 million
Market structure Fragmented
YoY growth 2025-2026(%) 7.4%
Key countries US, Canada, Mexico, China, Japan, India, South Korea, Australia, Indonesia, Germany, UK, France, Italy, Spain, The Netherlands, Brazil, Argentina, Chile, Saudi Arabia, UAE, South Africa, Turkey and Israel
Competitive landscape Leading Companies, Market Positioning of Companies, Competitive Strategies, and Industry Risks

Request Free Sample

Research Analyst Overview

  • The global commercial vehicle fleet management system market 2026-2030 is evolving beyond simple location tracking into a sophisticated ecosystem for data-driven operational intelligence. The integration of AI-powered dash cams and advanced fleet safety analytics is becoming standard, enabling proactive risk mitigation through driver behavior monitoring and in-cab driver coaching.
  • A significant trend influencing boardroom decisions is the shift toward predictive maintenance alerts, which leverage vehicle diagnostics codes to forecast failures before they occur. This capability transforms capital expenditure planning, allowing for more strategic asset lifecycle management. For example, some early adopters have achieved a 30% reduction in unplanned downtime.
  • The market's trajectory is also shaped by the need for seamless telematics data integration with other enterprise systems. Solutions now commonly incorporate fuel consumption analytics, route optimization algorithms, geofencing alerts, and tools for ELD compliance.
  • The distinction between aftermarket telematics hardware and OEM-embedded telematics is blurring as interoperability improves, with cloud-based fleet platforms, IoT sensor integration, and driver scoring models becoming ubiquitous for enhancing asset utilization metrics and cargo security monitoring, including specialized applications like cold chain monitoring and tire pressure monitoring system (TPMS) integration.

What are the Key Data Covered in this Commercial Vehicle Fleet Management System Market Research and Growth Report?

  • What is the expected growth of the Commercial Vehicle Fleet Management System Market between 2026 and 2030?

    • USD 9.86 billion, at a CAGR of 8%

  • What segmentation does the market report cover?

    • The report is segmented by Product (Third party, and OEM), Component (Software, Hardware, and Services), Deployment (Cloud based, and On premises) and Geography (North America, APAC, Europe, South America, Middle East and Africa)

  • Which regions are analyzed in the report?

    • North America, APAC, Europe, South America and Middle East and Africa

  • What are the key growth drivers and market challenges?

    • High-cost pressure on fleet operators, High cost associated with fleet management system

  • Who are the major players in the Commercial Vehicle Fleet Management System Market?

    • AB Volvo, Azuga Inc., CalAmp Corp., Fleet Complete, Fleetio Inc., Fleetx Technologies Pvt. Ltd., Geotab Inc., Gurtam, IntelliShift, Michelin, Motive Technologies Inc., Nauto Inc., Navixy, Omnitracs LLC, PowerFleet Inc., Samsara Inc., Spireon LLC, Teletrac Navman US Ltd., Vamosys Systems Pvt. Ltd. and Zonar Systems Inc.

Market Research Insights

  • The global commercial vehicle fleet management system market 2026-2030 is defined by a push for data-driven decision-making, where fleet electrification management and vehicle lifecycle management are becoming central to strategic planning. Adopting preventative maintenance scheduling and insurance telematics data allows companies to achieve up to a 25% reduction in unplanned downtime and lower insurance premiums.
  • Furthermore, last-mile delivery optimization, supported by sophisticated route planning and scheduling, improves on-time delivery rates by over 15%. Integrating solutions for remote vehicle diagnostics and mobile workforce management enhances supply chain visibility and driver retention strategies, directly impacting profitability.
  • Automated compliance reporting ensures adherence to regulations while minimizing administrative overhead, making technology adoption a critical factor for competitive differentiation and achieving significant total cost of ownership (TCO) reduction.

We can help! Our analysts can customize this commercial vehicle fleet management system market research report to meet your requirements.

Get in touch

1. Executive Summary

1.1 Market overview

Executive Summary - Chart on Market Overview
Executive Summary - Data Table on Market Overview
Executive Summary - Chart on Global Market Characteristics
Executive Summary - Chart on Market by Geography
Executive Summary - Chart on Market Segmentation by Product
Executive Summary - Chart on Market Segmentation by Component
Executive Summary - Chart on Market Segmentation by Deployment
Executive Summary - Chart on Incremental Growth
Executive Summary - Data Table on Incremental Growth
Executive Summary - Chart on Company Market Positioning

2. Technavio Analysis

2.1 Analysis of price sensitivity, lifecycle, customer purchase basket, adoption rates, and purchase criteria

2.2 Criticality of inputs and Factors of differentiation

Chart on Overview on criticality of inputs and factors of differentiation

2.3 Factors of disruption

Chart on Overview on factors of disruption

2.4 Impact of drivers and challenges

Chart on Impact of drivers and challenges in 2025 and 2030

3. Market Landscape

3.1 Market ecosystem

Chart on Parent Market
Data Table on - Parent Market

3.2 Market characteristics

Chart on Market characteristics analysis

3.3 Value chain analysis

Chart on Value chain analysis

4. Market Sizing

4.1 Market definition

Data Table on Offerings of companies included in the market definition

4.2 Market segment analysis

Market segments

4.3 Market size 2025

4.4 Market outlook: Forecast for 2025-2030

Chart on Global - Market size and forecast 2025-2030 ($ million)
Data Table on Global - Market size and forecast 2025-2030 ($ million)
Chart on Global Market: Year-over-year growth 2025-2030 (%)
Data Table on Global Market: Year-over-year growth 2025-2030 (%)

5. Historic Market Size

5.1 Global Commercial Vehicle Fleet Management System Market 2020 - 2024

Historic Market Size - Data Table on Global Commercial Vehicle Fleet Management System Market 2020 - 2024 ($ million)

5.2 Product segment analysis 2020 - 2024

Historic Market Size - Product Segment 2020 - 2024 ($ million)

5.3 Component segment analysis 2020 - 2024

Historic Market Size - Component Segment 2020 - 2024 ($ million)

5.4 Deployment segment analysis 2020 - 2024

Historic Market Size - Deployment Segment 2020 - 2024 ($ million)

5.5 Geography segment analysis 2020 - 2024

Historic Market Size - Geography Segment 2020 - 2024 ($ million)

5.6 Country segment analysis 2020 - 2024

Historic Market Size - Country Segment 2020 - 2024 ($ million)

6. Qualitative Analysis

6.1 Impact of AI on Global Commercial Vehicle Fleet Management System Market

6.2 Impact of Geopolitical Conflicts on Global Commercial Vehicle Fleet Management System Market

7. Five Forces Analysis

7.1 Five forces summary

Five forces analysis - Comparison between 2025 and 2030

7.2 Bargaining power of buyers

Bargaining power of buyers - Impact of key factors 2025 and 2030

7.3 Bargaining power of suppliers

Bargaining power of suppliers - Impact of key factors in 2025 and 2030

7.4 Threat of new entrants

Threat of new entrants - Impact of key factors in 2025 and 2030

7.5 Threat of substitutes

Threat of substitutes - Impact of key factors in 2025 and 2030

7.6 Threat of rivalry

Threat of rivalry - Impact of key factors in 2025 and 2030

7.7 Market condition

Chart on Market condition - Five forces 2025 and 2030

8. Market Segmentation by Product

8.1 Market segments

Chart on Product - Market share 2025-2030 (%)
Data Table on Product - Market share 2025-2030 (%)

8.2 Comparison by Product

Chart on Comparison by Product
Data Table on Comparison by Product

8.3 Third party - Market size and forecast 2025-2030

Chart on Third party - Market size and forecast 2025-2030 ($ million)
Data Table on Third party - Market size and forecast 2025-2030 ($ million)
Chart on Third party - Year-over-year growth 2025-2030 (%)
Data Table on Third party - Year-over-year growth 2025-2030 (%)

8.4 OEM - Market size and forecast 2025-2030

Chart on OEM - Market size and forecast 2025-2030 ($ million)
Data Table on OEM - Market size and forecast 2025-2030 ($ million)
Chart on OEM - Year-over-year growth 2025-2030 (%)
Data Table on OEM - Year-over-year growth 2025-2030 (%)

8.5 Market opportunity by Product

Market opportunity by Product ($ million)
Data Table on Market opportunity by Product ($ million)

9. Market Segmentation by Component

9.1 Market segments

Chart on Component - Market share 2025-2030 (%)
Data Table on Component - Market share 2025-2030 (%)

9.2 Comparison by Component

Chart on Comparison by Component
Data Table on Comparison by Component

9.3 Software - Market size and forecast 2025-2030

Chart on Software - Market size and forecast 2025-2030 ($ million)
Data Table on Software - Market size and forecast 2025-2030 ($ million)
Chart on Software - Year-over-year growth 2025-2030 (%)
Data Table on Software - Year-over-year growth 2025-2030 (%)

9.4 Hardware - Market size and forecast 2025-2030

Chart on Hardware - Market size and forecast 2025-2030 ($ million)
Data Table on Hardware - Market size and forecast 2025-2030 ($ million)
Chart on Hardware - Year-over-year growth 2025-2030 (%)
Data Table on Hardware - Year-over-year growth 2025-2030 (%)

9.5 Services - Market size and forecast 2025-2030

Chart on Services - Market size and forecast 2025-2030 ($ million)
Data Table on Services - Market size and forecast 2025-2030 ($ million)
Chart on Services - Year-over-year growth 2025-2030 (%)
Data Table on Services - Year-over-year growth 2025-2030 (%)

9.6 Market opportunity by Component

Market opportunity by Component ($ million)
Data Table on Market opportunity by Component ($ million)

10. Market Segmentation by Deployment

10.1 Market segments

Chart on Deployment - Market share 2025-2030 (%)
Data Table on Deployment - Market share 2025-2030 (%)

10.2 Comparison by Deployment

Chart on Comparison by Deployment
Data Table on Comparison by Deployment

10.3 Cloud based - Market size and forecast 2025-2030

Chart on Cloud based - Market size and forecast 2025-2030 ($ million)
Data Table on Cloud based - Market size and forecast 2025-2030 ($ million)
Chart on Cloud based - Year-over-year growth 2025-2030 (%)
Data Table on Cloud based - Year-over-year growth 2025-2030 (%)

10.4 On premises - Market size and forecast 2025-2030

Chart on On premises - Market size and forecast 2025-2030 ($ million)
Data Table on On premises - Market size and forecast 2025-2030 ($ million)
Chart on On premises - Year-over-year growth 2025-2030 (%)
Data Table on On premises - Year-over-year growth 2025-2030 (%)

10.5 Market opportunity by Deployment

Market opportunity by Deployment ($ million)
Data Table on Market opportunity by Deployment ($ million)

11. Customer Landscape

11.1 Customer landscape overview

Analysis of price sensitivity, lifecycle, customer purchase basket, adoption rates, and purchase criteria

12. Geographic Landscape

12.1 Geographic segmentation

Chart on Market share by geography 2025-2030 (%)
Data Table on Market share by geography 2025-2030 (%)

12.2 Geographic comparison

Chart on Geographic comparison
Data Table on Geographic comparison

12.3 North America - Market size and forecast 2025-2030

Chart on North America - Market size and forecast 2025-2030 ($ million)
Data Table on North America - Market size and forecast 2025-2030 ($ million)
Chart on North America - Year-over-year growth 2025-2030 (%)
Data Table on North America - Year-over-year growth 2025-2030 (%)
Chart on Regional Comparison - North America
Data Table on Regional Comparison - North America

12.3.1 US - Market size and forecast 2025-2030

Chart on US - Market size and forecast 2025-2030 ($ million)
Data Table on US - Market size and forecast 2025-2030 ($ million)
Chart on US - Year-over-year growth 2025-2030 (%)
Data Table on US - Year-over-year growth 2025-2030 (%)

12.3.2 Canada - Market size and forecast 2025-2030

Chart on Canada - Market size and forecast 2025-2030 ($ million)
Data Table on Canada - Market size and forecast 2025-2030 ($ million)
Chart on Canada - Year-over-year growth 2025-2030 (%)
Data Table on Canada - Year-over-year growth 2025-2030 (%)

12.3.3 Mexico - Market size and forecast 2025-2030

Chart on Mexico - Market size and forecast 2025-2030 ($ million)
Data Table on Mexico - Market size and forecast 2025-2030 ($ million)
Chart on Mexico - Year-over-year growth 2025-2030 (%)
Data Table on Mexico - Year-over-year growth 2025-2030 (%)

12.4 APAC - Market size and forecast 2025-2030

Chart on APAC - Market size and forecast 2025-2030 ($ million)
Data Table on APAC - Market size and forecast 2025-2030 ($ million)
Chart on APAC - Year-over-year growth 2025-2030 (%)
Data Table on APAC - Year-over-year growth 2025-2030 (%)
Chart on Regional Comparison - APAC
Data Table on Regional Comparison - APAC

12.4.1 China - Market size and forecast 2025-2030

Chart on China - Market size and forecast 2025-2030 ($ million)
Data Table on China - Market size and forecast 2025-2030 ($ million)
Chart on China - Year-over-year growth 2025-2030 (%)
Data Table on China - Year-over-year growth 2025-2030 (%)

12.4.2 Japan - Market size and forecast 2025-2030

Chart on Japan - Market size and forecast 2025-2030 ($ million)
Data Table on Japan - Market size and forecast 2025-2030 ($ million)
Chart on Japan - Year-over-year growth 2025-2030 (%)
Data Table on Japan - Year-over-year growth 2025-2030 (%)

12.4.3 India - Market size and forecast 2025-2030

Chart on India - Market size and forecast 2025-2030 ($ million)
Data Table on India - Market size and forecast 2025-2030 ($ million)
Chart on India - Year-over-year growth 2025-2030 (%)
Data Table on India - Year-over-year growth 2025-2030 (%)

12.4.4 South Korea - Market size and forecast 2025-2030

Chart on South Korea - Market size and forecast 2025-2030 ($ million)
Data Table on South Korea - Market size and forecast 2025-2030 ($ million)
Chart on South Korea - Year-over-year growth 2025-2030 (%)
Data Table on South Korea - Year-over-year growth 2025-2030 (%)

12.4.5 Australia - Market size and forecast 2025-2030

Chart on Australia - Market size and forecast 2025-2030 ($ million)
Data Table on Australia - Market size and forecast 2025-2030 ($ million)
Chart on Australia - Year-over-year growth 2025-2030 (%)
Data Table on Australia - Year-over-year growth 2025-2030 (%)

12.4.6 Indonesia - Market size and forecast 2025-2030

Chart on Indonesia - Market size and forecast 2025-2030 ($ million)
Data Table on Indonesia - Market size and forecast 2025-2030 ($ million)
Chart on Indonesia - Year-over-year growth 2025-2030 (%)
Data Table on Indonesia - Year-over-year growth 2025-2030 (%)

12.5 Europe - Market size and forecast 2025-2030

Chart on Europe - Market size and forecast 2025-2030 ($ million)
Data Table on Europe - Market size and forecast 2025-2030 ($ million)
Chart on Europe - Year-over-year growth 2025-2030 (%)
Data Table on Europe - Year-over-year growth 2025-2030 (%)
Chart on Regional Comparison - Europe
Data Table on Regional Comparison - Europe

12.5.1 Germany - Market size and forecast 2025-2030

Chart on Germany - Market size and forecast 2025-2030 ($ million)
Data Table on Germany - Market size and forecast 2025-2030 ($ million)
Chart on Germany - Year-over-year growth 2025-2030 (%)
Data Table on Germany - Year-over-year growth 2025-2030 (%)

12.5.2 UK - Market size and forecast 2025-2030

Chart on UK - Market size and forecast 2025-2030 ($ million)
Data Table on UK - Market size and forecast 2025-2030 ($ million)
Chart on UK - Year-over-year growth 2025-2030 (%)
Data Table on UK - Year-over-year growth 2025-2030 (%)

12.5.3 France - Market size and forecast 2025-2030

Chart on France - Market size and forecast 2025-2030 ($ million)
Data Table on France - Market size and forecast 2025-2030 ($ million)
Chart on France - Year-over-year growth 2025-2030 (%)
Data Table on France - Year-over-year growth 2025-2030 (%)

12.5.4 Italy - Market size and forecast 2025-2030

Chart on Italy - Market size and forecast 2025-2030 ($ million)
Data Table on Italy - Market size and forecast 2025-2030 ($ million)
Chart on Italy - Year-over-year growth 2025-2030 (%)
Data Table on Italy - Year-over-year growth 2025-2030 (%)

12.5.5 Spain - Market size and forecast 2025-2030

Chart on Spain - Market size and forecast 2025-2030 ($ million)
Data Table on Spain - Market size and forecast 2025-2030 ($ million)
Chart on Spain - Year-over-year growth 2025-2030 (%)
Data Table on Spain - Year-over-year growth 2025-2030 (%)

12.5.6 The Netherlands - Market size and forecast 2025-2030

Chart on The Netherlands - Market size and forecast 2025-2030 ($ million)
Data Table on The Netherlands - Market size and forecast 2025-2030 ($ million)
Chart on The Netherlands - Year-over-year growth 2025-2030 (%)
Data Table on The Netherlands - Year-over-year growth 2025-2030 (%)

12.6 South America - Market size and forecast 2025-2030

Chart on South America - Market size and forecast 2025-2030 ($ million)
Data Table on South America - Market size and forecast 2025-2030 ($ million)
Chart on South America - Year-over-year growth 2025-2030 (%)
Data Table on South America - Year-over-year growth 2025-2030 (%)
Chart on Regional Comparison - South America
Data Table on Regional Comparison - South America

12.6.1 Brazil - Market size and forecast 2025-2030

Chart on Brazil - Market size and forecast 2025-2030 ($ million)
Data Table on Brazil - Market size and forecast 2025-2030 ($ million)
Chart on Brazil - Year-over-year growth 2025-2030 (%)
Data Table on Brazil - Year-over-year growth 2025-2030 (%)

12.6.2 Argentina - Market size and forecast 2025-2030

Chart on Argentina - Market size and forecast 2025-2030 ($ million)
Data Table on Argentina - Market size and forecast 2025-2030 ($ million)
Chart on Argentina - Year-over-year growth 2025-2030 (%)
Data Table on Argentina - Year-over-year growth 2025-2030 (%)

12.6.3 Chile - Market size and forecast 2025-2030

Chart on Chile - Market size and forecast 2025-2030 ($ million)
Data Table on Chile - Market size and forecast 2025-2030 ($ million)
Chart on Chile - Year-over-year growth 2025-2030 (%)
Data Table on Chile - Year-over-year growth 2025-2030 (%)

12.7 Middle East and Africa - Market size and forecast 2025-2030

Chart on Middle East and Africa - Market size and forecast 2025-2030 ($ million)
Data Table on Middle East and Africa - Market size and forecast 2025-2030 ($ million)
Chart on Middle East and Africa - Year-over-year growth 2025-2030 (%)
Data Table on Middle East and Africa - Year-over-year growth 2025-2030 (%)
Chart on Regional Comparison - Middle East and Africa
Data Table on Regional Comparison - Middle East and Africa

12.7.1 Saudi Arabia - Market size and forecast 2025-2030

Chart on Saudi Arabia - Market size and forecast 2025-2030 ($ million)
Data Table on Saudi Arabia - Market size and forecast 2025-2030 ($ million)
Chart on Saudi Arabia - Year-over-year growth 2025-2030 (%)
Data Table on Saudi Arabia - Year-over-year growth 2025-2030 (%)

12.7.2 UAE - Market size and forecast 2025-2030

Chart on UAE - Market size and forecast 2025-2030 ($ million)
Data Table on UAE - Market size and forecast 2025-2030 ($ million)
Chart on UAE - Year-over-year growth 2025-2030 (%)
Data Table on UAE - Year-over-year growth 2025-2030 (%)

12.7.3 South Africa - Market size and forecast 2025-2030

Chart on South Africa - Market size and forecast 2025-2030 ($ million)
Data Table on South Africa - Market size and forecast 2025-2030 ($ million)
Chart on South Africa - Year-over-year growth 2025-2030 (%)
Data Table on South Africa - Year-over-year growth 2025-2030 (%)

12.7.4 Turkey - Market size and forecast 2025-2030

Chart on Turkey - Market size and forecast 2025-2030 ($ million)
Data Table on Turkey - Market size and forecast 2025-2030 ($ million)
Chart on Turkey - Year-over-year growth 2025-2030 (%)
Data Table on Turkey - Year-over-year growth 2025-2030 (%)

12.7.5 Israel - Market size and forecast 2025-2030

Chart on Israel - Market size and forecast 2025-2030 ($ million)
Data Table on Israel - Market size and forecast 2025-2030 ($ million)
Chart on Israel - Year-over-year growth 2025-2030 (%)
Data Table on Israel - Year-over-year growth 2025-2030 (%)

12.8 Market opportunity by geography

Market opportunity by geography ($ million)
Data Tables on Market opportunity by geography ($ million)

13. Drivers, Challenges, and Opportunity

13.1 Market drivers

High-cost pressure on fleet operators
Integration of video-based safety system to improve driver behavior
Growing focus on efficient use of data to enhance fleet management

13.2 Market challenges

High cost associated with fleet management system
Dependence on many individual entities for streamlined process
Data securities related to fleet management system

13.3 Impact of drivers and challenges

Impact of drivers and challenges in 2025 and 2030

13.4 Market opportunities

Growing popularity of 360 degree fleet management system (FMS)
Collaboration of OEMs and tier-1 suppliers for pre-installed telematics services
Advanced analytics usage on telematics data to reduce risk severity

14. Competitive Landscape

14.1 Overview

14.2

Overview on criticality of inputs and factors of differentiation

14.3 Landscape disruption

Overview on factors of disruption

14.4 Industry risks

Impact of key risks on business

15. Competitive Analysis

15.1 Companies profiled

Companies covered

15.2 Company ranking index

15.3 Market positioning of companies

Matrix on companies position and classification

15.4 AB Volvo

AB Volvo - Overview
AB Volvo - Business segments
AB Volvo - Key news
AB Volvo - Key offerings
AB Volvo - Segment focus
SWOT

15.5 Azuga Inc.

Azuga Inc. - Overview
Azuga Inc. - Product / Service
Azuga Inc. - Key offerings
SWOT

15.6 Fleet Complete

Fleet Complete - Overview
Fleet Complete - Product / Service
Fleet Complete - Key offerings
SWOT

15.7 Fleetio Inc.

Fleetio Inc. - Overview
Fleetio Inc. - Product / Service
Fleetio Inc. - Key offerings
SWOT

15.8 Fleetx Technologies Pvt. Ltd.

Fleetx Technologies Pvt. Ltd. - Overview
Fleetx Technologies Pvt. Ltd. - Product / Service
Fleetx Technologies Pvt. Ltd. - Key offerings
SWOT

15.9 Geotab Inc.

Geotab Inc. - Overview
Geotab Inc. - Product / Service
Geotab Inc. - Key offerings
SWOT

15.10 Michelin

Michelin - Overview
Michelin - Business segments
Michelin - Key news
Michelin - Key offerings
Michelin - Segment focus
SWOT

15.11 Nauto Inc.

Nauto Inc. - Overview
Nauto Inc. - Product / Service
Nauto Inc. - Key offerings
SWOT

15.12 Navixy

Navixy - Overview
Navixy - Product / Service
Navixy - Key offerings
SWOT

15.13 Omnitracs LLC

Omnitracs LLC - Overview
Omnitracs LLC - Product / Service
Omnitracs LLC - Key offerings
SWOT

15.14 Samsara Inc.

Samsara Inc. - Overview
Samsara Inc. - Product / Service
Samsara Inc. - Key offerings
SWOT

15.15 Spireon LLC

Spireon LLC - Overview
Spireon LLC - Product / Service
Spireon LLC - Key offerings
SWOT

15.16 Teletrac Navman US Ltd.

Teletrac Navman US Ltd. - Overview
Teletrac Navman US Ltd. - Product / Service
Teletrac Navman US Ltd. - Key offerings
SWOT

15.17 Vamosys Systems Pvt. Ltd.

Vamosys Systems Pvt. Ltd. - Overview
Vamosys Systems Pvt. Ltd. - Product / Service
Vamosys Systems Pvt. Ltd. - Key offerings
SWOT

15.18 Zonar Systems Inc.

Zonar Systems Inc. - Overview
Zonar Systems Inc. - Product / Service
Zonar Systems Inc. - Key offerings
SWOT

16. Appendix

16.1 Scope of the report

Market definition
Objectives
Notes and caveats

16.2 Inclusions and exclusions checklist

Inclusions checklist
Exclusions checklist

16.3 Currency conversion rates for US$

16.4 Research methodology

16.5 Data procurement

Information sources

16.6 Data validation

16.7 Validation techniques employed for market sizing

16.8 Data synthesis

16.9 360 degree market analysis

16.10 List of abbreviations

Research Methodology

Technavio presents a detailed picture of the market by way of study, synthesis, and summation of data from multiple sources. The analysts have presented the various facets of the market with a particular focus on identifying the key industry influencers. The data thus presented is comprehensive, reliable, and the result of extensive research, both primary and secondary.

INFORMATION SOURCES

Primary sources

  • Manufacturers and suppliers
  • Channel partners
  • Industry experts
  • Strategic decision makers

Secondary sources

  • Industry journals and periodicals
  • Government data
  • Financial reports of key industry players
  • Historical data
  • Press releases

DATA ANALYSIS

Data Synthesis

  • Collation of data
  • Estimation of key figures
  • Analysis of derived insights

Data Validation

  • Triangulation with data models
  • Reference against proprietary databases
  • Corroboration with industry experts

REPORT WRITING

Qualitative

  • Market drivers
  • Market challenges
  • Market trends
  • Five forces analysis

Quantitative

  • Market size and forecast
  • Market segmentation
  • Geographical insights
  • Competitive landscape

Interested in this report?

Get your sample now to see our research methodology and insights!

Download Now

Frequently Asked Questions

Commercial Vehicle Fleet Management System market growth will increase by USD 9857.1 million during 2026-2030.

The Commercial Vehicle Fleet Management System market is expected to grow at a CAGR of 8% during 2026-2030.

Commercial Vehicle Fleet Management System market is segmented by Product (Third party, OEM) Component (Software, Hardware, Services) Deployment (Cloud based, On premises)

AB Volvo, Azuga Inc., CalAmp Corp., Fleet Complete, Fleetio Inc., Fleetx Technologies Pvt. Ltd., Geotab Inc., Gurtam, IntelliShift, Michelin, Motive Technologies Inc., Nauto Inc., Navixy, Omnitracs LLC, PowerFleet Inc., Samsara Inc., Spireon LLC, Teletrac Navman US Ltd., Vamosys Systems Pvt. Ltd., Zonar Systems Inc. are a few of the key vendors in the Commercial Vehicle Fleet Management System market.

North America will register the highest growth rate of 34.7% among the other regions. Therefore, the Commercial Vehicle Fleet Management System market in North America is expected to garner significant business opportunities for the vendors during the forecast period.

US, Canada, Mexico, China, Japan, India, South Korea, Australia, Indonesia, Germany, UK, France, Italy, Spain, The Netherlands, Brazil, Argentina, Chile, Saudi Arabia, UAE, South Africa, Turkey, Israel

  • High-cost pressure on fleet operators is the driving factor this market.

The Commercial Vehicle Fleet Management System market vendors should focus on grabbing business opportunities from the Product segment as it accounted for the largest market share in the base year.
RIA - Research AI Assistant
Ask RIA