Gas Compressors Market Analysis, Size, and Forecast 2025-2029: APAC (Australia, China, India, Japan, South Korea), North America (US and Canada), Europe (France, Germany, UK), Middle East and Africa , and South America

Gas Compressors Market Analysis, Size, and Forecast 2025-2029:
APAC (Australia, China, India, Japan, South Korea), North America (US and Canada), Europe (France, Germany, UK), Middle East and Africa , and South America

Published: Mar 2025 229 Pages SKU: IRTNTR43298

Market Overview at a Glance

$2.88 B
Market Opportunity
5.2%
CAGR
4.7
YoY growth 2024-2025(%)

Gas Compressors Market Size 2025-2029

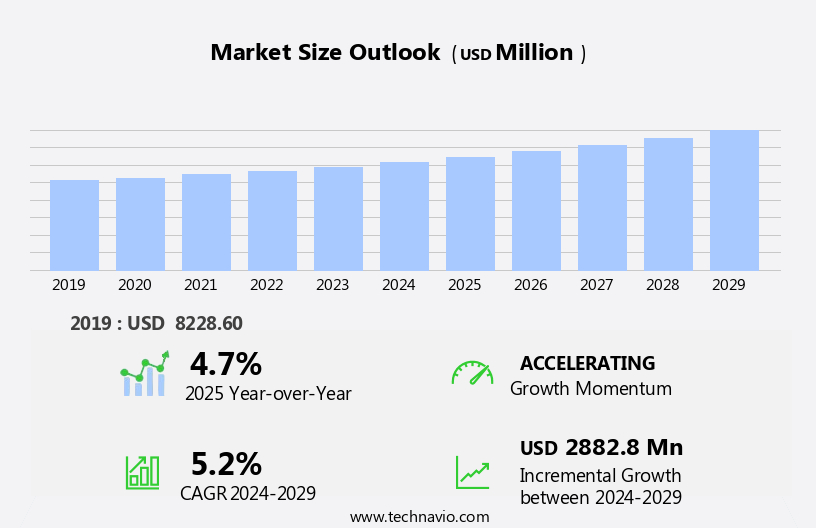
The gas compressors market size is forecast to increase by USD 2.88 billion at a CAGR of 5.2% between 2024 and 2029.

  • The market is experiencing significant growth driven by the increasing demand for energy-efficient compressor systems. The global energy landscape is shifting towards cleaner and more sustainable energy sources, leading companies to invest in advanced compressor technologies that offer improved efficiency and reduced emissions. Furthermore, strategic alliances and collaborations among key players are shaping the market's competitive landscape, with companies seeking to expand their product offerings and geographical reach. The construction sector also relies heavily on compressors for various applications, further expanding the market's reach.
  • However, resistance to new technology adoption poses a challenge for market growth. Older compressor systems continue to operate in various industries, particularly in developing economies, due to their lower upfront costs. To capitalize on market opportunities and navigate challenges effectively, companies must focus on developing innovative compressor technologies that offer superior efficiency and environmental performance while also addressing cost concerns. Additionally, targeted marketing efforts and educational initiatives can help overcome resistance to new technology adoption and expand the market's customer base. Overall, the market presents significant growth potential for companies that can successfully address the market's key drivers, trends, and challenges.

What will be the Size of the Gas Compressors Market during the forecast period?

Gas Compressors Market Size

 Request Free Sample

  • The global gas compressor market is experiencing robust growth due to increasing gas demand and the expansion of gas infrastructure. Compressor units play a crucial role in the production, storage, and transportation of various gases, including hydrocarbons and cleaner energy sources. The market encompasses a diverse range of compressor types, including reciprocating, centrifugal, and screw compressors, catering to various industrial processes and applications. Carbon emissions remain a significant concern, driving the adoption of more efficient compressor technologies and improved materials. Advanced control systems enable better energy management and reduced emissions. After-sales services have become essential for maintaining customer relationships and ensuring optimal compressor performance.
  • Gas production and storage projects continue to proliferate, creating new opportunities for compressor deployment. The transition towards cleaner energy sources is expected to fuel additional demand for gas compressors in the coming years. Despite these positive trends, the market faces challenges related to regulatory compliance and the need for continuous innovation to meet evolving customer needs.

How is this Gas Compressors Industry segmented?

The gas compressors industry research report provides comprehensive data (region-wise segment analysis), with forecasts and estimates in "USD billion" for the period 2025-2029, as well as historical data from 2019-2023 for the following segments.

  • Product
    • PD compressors
    • Roller crushers
  • End-user
    • Oil and gas
    • Power generation
    • Chemicals and petrochemicals
    • Mining
    • Others
  • Technology
    • Reciprocating
    • Rotary screw
    • Centrifugal
    • Axial
  • Geography
    • APAC
      • Australia
      • China
      • India
      • Japan
      • South Korea
    • North America
      • US
      • Canada
    • Europe
      • France
      • Germany
      • UK
    • Middle East and Africa
    • South America

By Product Insights

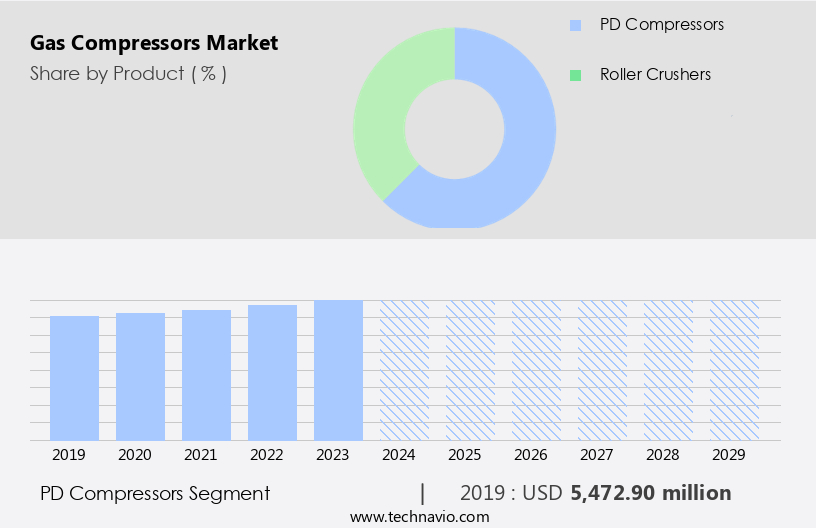
The PD compressors segment is estimated to witness significant growth during the forecast period. The market is driven by expanding industrial activities and rising infrastructure investments, particularly in the midstream sector. Positive displacement (PD) compressors, including reciprocating piston, rotary screw, and rotary vane compressors, dominate the market due to their efficiency in compressing gases. PD compressors function by capturing a certain volume of gas in a chamber and then reducing the chamber size to compress the gas. Operational efficiency, product quality, and customer relationships are key focus areas for market players. After-sales services, such as maintenance, repair, and spare parts supply, are essential for enhancing customer base and ensuring long-term customer relationships.

Technological advancements, including improved materials, IoT integration, and dynamic compressors with variable speed drives, are crucial for increasing compressor efficiency and reducing carbon emissions. Environmental awareness and stringent regulatory standards necessitate the deployment of cleaner energy sources and net-zero emissions solutions. The market is further influenced by pipeline network expansion, LNG projects, and storage capacity investments.

Gas Compressors Market Size

Get a glance at the market report of share of various segments Request Free Sample

The PD compressors segment was valued at USD 5.47 billion in 2019 and showed a gradual increase during the forecast period.

Regional Analysis

APAC is estimated to contribute 53% to the growth of the global market during the forecast period.Technavio's analysts have elaborately explained the regional trends and drivers that shape the market during the forecast period.

Gas Compressors Market Share by Geography

For more insights on the market size of various regions, Request Free Sample

The market in APAC is projected to dominate the global landscape due to significant investments in natural gas infrastructure, particularly in China. With over 31 tcm of technically recoverable shale gas resources, China is a major contributor to the market's revenue growth. The country's commitment to invest around USD160 billion in shale oil development and USD 33 billion in future projects presents lucrative opportunities for both domestic and foreign investors. The expanding industrial activities and exploration efforts in the region are driving the demand for compressor units, compressor trains, and dynamic compressors in various industrial processes and power generation.

Compressor designs continue to evolve with improved materials, enhanced sealing mechanisms, and technological advancements to ensure operational efficiency, energy efficiency, and reduced carbon emissions. The midstream sector's pipeline network expansion and replacement projects, LNG projects, and polypropylene plant construction are significant contributors to the market's growth. Strategic partnerships, IoT integration, and regulatory standards are key factors shaping the market dynamics. The market's focus on sustainability and net-zero emissions is driving the demand for cleaner energy sources and carbon capture, utilization, and storage units.

Market Dynamics

Our researchers analyzed the data with 2024 as the base year, along with the key drivers, trends, and challenges. A holistic analysis of drivers will help companies refine their marketing strategies to gain a competitive advantage.

What are the key market drivers leading to the rise in the adoption of Gas Compressors Industry?

  • An increasing need for energy-efficient gas compressor systems is the key driver of the market. The oil and gas industry is prioritizing energy efficiency and emissions reduction, driving the demand for advanced compressor technologies. Regulatory bodies in Europe and North America are implementing regulations to ensure industrial equipment, including compressors, adhere to regional standards. The high electricity consumption of compressors, which accounts for approximately 70% of their total lifetime costs, is a significant factor influencing their adoption.
  • With nearly eight horsepower of electricity required to produce one horsepower of compressed gas, energy efficiency is a crucial consideration in the compressor market. This trend underscores the importance of implementing energy-efficient compressors to minimize electricity consumption and reduce overall costs.

What are the market trends shaping the Gas Compressors Industry?

  • An increasing strategic alliances among companies is the upcoming market trend. In the dynamic compressor market, companies recognize the significance of strategic mergers and acquisitions to expand their offerings and enter new markets. This approach enables manufacturers to provide their customers with comprehensive, dependable, and technologically advanced products and services. However, the compressor industry confronts increasing technological and strategic demands, as well as the need for effective after-sales services. To maintain market growth and enhance competitive advantages, consolidation becomes essential.
  • For instance, Hitachi's acquisition of Northern California Distributor General Air Compressors in November 2023 is a strategic move to differentiate products and boost profit margins. Mergers and acquisitions play a crucial role in helping market players adapt to evolving market conditions and stay competitive.

What challenges does the Gas Compressors Industry face during its growth?

  • The resistance to new technology adoption is a key challenge affecting the industry growth. Gas compressors play a vital role in the oil and gas industry, providing essential pressure increases for various applications. The total cost of owning and operating a gas compressor over a 10-year period is approximately composed of three main components: electricity consumption (74%), equipment cost (12%), and maintenance expenses (14%). 
  • The escalating raw material prices and labor costs have significantly influenced the manufacturing cost of these compressors, leading to an increase in their overall lifecycle cost. This trend underscores the importance of energy efficiency and cost-effective maintenance strategies for gas compressor users in the oil and gas sector.

Exclusive Customer Landscape

The gas compressors market forecasting report includes the adoption lifecycle of the market, covering from the innovator's stage to the laggard's stage. It focuses on adoption rates in different regions based on penetration. Furthermore, the gas compressors market report also includes key purchase criteria and drivers of price sensitivity to help companies evaluate and develop their market growth analysis strategies.

Gas Compressors Market Share by Geography

 Customer Landscape

Key Companies & Market Insights

Companies are implementing various strategies, such as strategic alliances, gas compressors market forecast, partnerships, mergers and acquisitions, geographical expansion, and product/service launches, to enhance their presence in the industry.

Accudyne Systems Inc.: The company offers gas compressors system which has high efficiency that deliver consistently high performance in the critical industries and serve environments with flow control systems for oil and gas industry.

The industry research and growth report includes detailed analyses of the competitive landscape of the market and information about key companies, including:

  • Accudyne Systems Inc.
  • Aerzener Maschinenfabrik GmbH
  • Atlas Copco AB
  • BAUER COMPRESSORS INC
  • BOGE
  • Burckhardt Compression
  • Ebara Corp.
  • Elgi Equipments Ltd
  • Gardner Denver
  • General Electric Co.
  • Hitachi Ltd.
  • IDEX Corp.
  • Ingersoll Rand Inc.
  • J.P Sauer and Sohn Maschinenbau GmbH
  • KAESER KOMPRESSOREN SE
  • Kobe Steel Ltd.
  • Mitsubishi Heavy Industries Ltd.
  • Siemens AG
  • Sulzer Ltd.
  • The Procter and Gamble Co.

Qualitative and quantitative analysis of companies has been conducted to help clients understand the wider business environment as well as the strengths and weaknesses of key industry players. Data is qualitatively analyzed to categorize companies as pure play, category-focused, industry-focused, and diversified; it is quantitatively analyzed to categorize companies as dominant, leading, strong, tentative, and weak.

Research Analyst Overview

The global compressor market encompasses a wide range of mechanical devices employed in various industries to compress gases for diverse applications. Compressors play a crucial role in enhancing operational efficiency, reducing energy consumption, and addressing environmental concerns in numerous sectors. As industrial activities expand and cleaner energy sources gain prominence, the demand for compressors is on the rise. This trend is particularly noticeable in the midstream sector, where compressor trains are essential for gas transportation and storage. The increasing focus on net-zero emissions and stringent environmental regulations is driving the adoption of more efficient compressor designs and enhanced sealing mechanisms.

The gas compressor market is witnessing significant technological advancements, with dynamic compressors and variable speed drives gaining popularity due to their energy efficiency and flexibility. These compressors enable better control over pressure and flow rates, contributing to overall system efficiency and reducing pressure losses. The expanding industrial activities in various sectors, including manufacturing, power generation, and oil and gas, are leading to increased demand for compressors. In the oil and gas industry, compressors are used for gas production, exploration efforts, and natural gas transportation. Offshore gas fields and LNG projects require specialized compressor units, such as nitrogen gas compressors, to ensure the safe and efficient production and transportation of natural gas.

The midstream sector is undergoing significant infrastructure investments to expand pipeline networks and replace aging infrastructure. These projects necessitate the deployment of compressor trains to maintain the required pressure and transport capacity. In addition, the increasing demand for cleaner energy sources and the energy transition plan is driving the development of renewable energy projects, which in turn is leading to the deployment of compressors for liquefaction capacity and power generation. The customer base for compressors is diverse, ranging from general manufacturing industries to specific applications such as polypropylene plants. Customer relationships are crucial in this market, as the reliability and performance of compressors can significantly impact the productivity and profitability of industrial processes.

The compressor market is also witnessing product diversification, with manufacturers focusing on sustainable products and improved materials to cater to the growing environmental awareness. Strategic partnerships and collaborations are becoming increasingly common to facilitate research and development and to address the evolving market dynamics. The market for compressors is influenced by various factors, including natural gas prices, regulatory standards, and technological innovation. The increasing focus on energy efficiency and transport efficiency is driving the adoption of advanced control systems and IoT integration to optimize compressor performance and reduce energy consumption. In summary, the compressor market is a dynamic and evolving landscape, driven by the expanding industrial activities, the energy transition plan, and the growing focus on environmental sustainability. The market is witnessing significant technological advancements, with compressor designs becoming more efficient and sustainable to meet the evolving needs of various industries.

Market Scope

Report Coverage

Details

Page number

229

Base year

2024

Historic period

2019-2023

Forecast period

2025-2029

Growth momentum & CAGR

Accelerate at a CAGR of 5.2%

Market growth 2025-2029

USD 2.88 billion

Market structure

Fragmented

YoY growth 2024-2025(%)

4.7

Key countries

US, China, Japan, India, UK, South Korea, Germany, Canada, France, and Australia

Competitive landscape

Leading Companies, Market Positioning of Companies, Competitive Strategies, and Industry Risks

Request Free Sample

What are the Key Data Covered in this Gas Compressors Market Research and Growth Report?

  • CAGR of the Gas Compressors industry during the forecast period
  • Detailed information on factors that will drive the growth and forecasting between 2025 and 2029
  • Precise estimation of the size of the market and its contribution of the industry in focus to the parent market
  • Accurate predictions about upcoming growth and trends and changes in consumer behaviour
  • Growth of the market across APAC, North America, Europe, Middle East and Africa, and South America
  • Thorough analysis of the market's competitive landscape and detailed information about companies
  • Comprehensive analysis of factors that will challenge the gas compressors market growth of industry companies

We can help! Our analysts can customize this gas compressors market research report to meet your requirements.

Get in touch

1 Executive Summary

  • 1.1 Market overview
    • Executive Summary - Chart on Market Overview
    • Executive Summary - Data Table on Market Overview
    • Executive Summary - Chart on Global Market Characteristics
    • Executive Summary - Chart on Market by Geography
    • Executive Summary - Chart on Market Segmentation by Product
    • Executive Summary - Chart on Market Segmentation by End-user
    • Executive Summary - Chart on Market Segmentation by Technology
    • Executive Summary - Chart on Incremental Growth
    • Executive Summary - Data Table on Incremental Growth
    • Executive Summary - Chart on Company Market Positioning

2 Technavio Analysis

  • 2.1 Analysis of price sensitivity, lifecycle, customer purchase basket, adoption rates, and purchase criteria
    • Analysis of price sensitivity, lifecycle, customer purchase basket, adoption rates, and purchase criteria
  • 2.2 Criticality of inputs and Factors of differentiation
    • Overview on criticality of inputs and factors of differentiation
  • 2.3 Factors of disruption
    • Overview on factors of disruption
  • 2.4 Impact of drivers and challenges
    • Impact of drivers and challenges in 2024 and 2029

3 Market Landscape

  • 3.1 Market ecosystem
    • Parent Market
    • Data Table on - Parent Market
  • 3.2 Market characteristics
    • Market characteristics analysis
  • 3.3 Value chain analysis
    • Value chain analysis

4 Market Sizing

  • 4.1 Market definition
    • Offerings of companies included in the market definition
  • 4.2 Market segment analysis
    • Market segments
  • 4.3 Market size 2024
    • 4.4 Market outlook: Forecast for 2024-2029
      • Chart on Global - Market size and forecast 2024-2029 ($ million)
      • Data Table on Global - Market size and forecast 2024-2029 ($ million)
      • Chart on Global Market: Year-over-year growth 2024-2029 (%)
      • Data Table on Global Market: Year-over-year growth 2024-2029 (%)

    5 Historic Market Size

    • 5.1 Global Gas Compressors Market 2019 - 2023
      • Historic Market Size - Data Table on Global Gas Compressors Market 2019 - 2023 ($ million)
    • 5.2 Product segment analysis 2019 - 2023
      • Historic Market Size - Product Segment 2019 - 2023 ($ million)
    • 5.3 End-user segment analysis 2019 - 2023
      • Historic Market Size - End-user Segment 2019 - 2023 ($ million)
    • 5.4 Technology segment analysis 2019 - 2023
      • Historic Market Size - Technology Segment 2019 - 2023 ($ million)
    • 5.5 Geography segment analysis 2019 - 2023
      • Historic Market Size - Geography Segment 2019 - 2023 ($ million)
    • 5.6 Country segment analysis 2019 - 2023
      • Historic Market Size - Country Segment 2019 - 2023 ($ million)

    6 Qualitative Analysis

    • 6.1 AI Impact on Global Gas Compressors Market

      7 Five Forces Analysis

      • 7.1 Five forces summary
        • Five forces analysis - Comparison between 2024 and 2029
      • 7.2 Bargaining power of buyers
        • Bargaining power of buyers - Impact of key factors 2024 and 2029
      • 7.3 Bargaining power of suppliers
        • Bargaining power of suppliers - Impact of key factors in 2024 and 2029
      • 7.4 Threat of new entrants
        • Threat of new entrants - Impact of key factors in 2024 and 2029
      • 7.5 Threat of substitutes
        • Threat of substitutes - Impact of key factors in 2024 and 2029
      • 7.6 Threat of rivalry
        • Threat of rivalry - Impact of key factors in 2024 and 2029
      • 7.7 Market condition
        • Chart on Market condition - Five forces 2024 and 2029

      8 Market Segmentation by Product

      • 8.1 Market segments
        • Chart on Product - Market share 2024-2029 (%)
        • Data Table on Product - Market share 2024-2029 (%)
      • 8.2 Comparison by Product
        • Chart on Comparison by Product
        • Data Table on Comparison by Product
      • 8.3 PD compressors - Market size and forecast 2024-2029
        • Chart on PD compressors - Market size and forecast 2024-2029 ($ million)
        • Data Table on PD compressors - Market size and forecast 2024-2029 ($ million)
        • Chart on PD compressors - Year-over-year growth 2024-2029 (%)
        • Data Table on PD compressors - Year-over-year growth 2024-2029 (%)
      • 8.4 Roller crushers - Market size and forecast 2024-2029
        • Chart on Roller crushers - Market size and forecast 2024-2029 ($ million)
        • Data Table on Roller crushers - Market size and forecast 2024-2029 ($ million)
        • Chart on Roller crushers - Year-over-year growth 2024-2029 (%)
        • Data Table on Roller crushers - Year-over-year growth 2024-2029 (%)
      • 8.5 Market opportunity by Product
        • Market opportunity by Product ($ million)
        • Data Table on Market opportunity by Product ($ million)

      9 Market Segmentation by End-user

      • 9.1 Market segments
        • Chart on End-user - Market share 2024-2029 (%)
        • Data Table on End-user - Market share 2024-2029 (%)
      • 9.2 Comparison by End-user
        • Chart on Comparison by End-user
        • Data Table on Comparison by End-user
      • 9.3 Oil and gas - Market size and forecast 2024-2029
        • Chart on Oil and gas - Market size and forecast 2024-2029 ($ million)
        • Data Table on Oil and gas - Market size and forecast 2024-2029 ($ million)
        • Chart on Oil and gas - Year-over-year growth 2024-2029 (%)
        • Data Table on Oil and gas - Year-over-year growth 2024-2029 (%)
      • 9.4 Power generation - Market size and forecast 2024-2029
        • Chart on Power generation - Market size and forecast 2024-2029 ($ million)
        • Data Table on Power generation - Market size and forecast 2024-2029 ($ million)
        • Chart on Power generation - Year-over-year growth 2024-2029 (%)
        • Data Table on Power generation - Year-over-year growth 2024-2029 (%)
      • 9.5 Chemicals and petrochemicals - Market size and forecast 2024-2029
        • Chart on Chemicals and petrochemicals - Market size and forecast 2024-2029 ($ million)
        • Data Table on Chemicals and petrochemicals - Market size and forecast 2024-2029 ($ million)
        • Chart on Chemicals and petrochemicals - Year-over-year growth 2024-2029 (%)
        • Data Table on Chemicals and petrochemicals - Year-over-year growth 2024-2029 (%)
      • 9.6 Mining - Market size and forecast 2024-2029
        • Chart on Mining - Market size and forecast 2024-2029 ($ million)
        • Data Table on Mining - Market size and forecast 2024-2029 ($ million)
        • Chart on Mining - Year-over-year growth 2024-2029 (%)
        • Data Table on Mining - Year-over-year growth 2024-2029 (%)
      • 9.7 Others - Market size and forecast 2024-2029
        • Chart on Others - Market size and forecast 2024-2029 ($ million)
        • Data Table on Others - Market size and forecast 2024-2029 ($ million)
        • Chart on Others - Year-over-year growth 2024-2029 (%)
        • Data Table on Others - Year-over-year growth 2024-2029 (%)
      • 9.8 Market opportunity by End-user
        • Market opportunity by End-user ($ million)
        • Data Table on Market opportunity by End-user ($ million)

      10 Market Segmentation by Technology

      • 10.1 Market segments
        • Chart on Technology - Market share 2024-2029 (%)
        • Data Table on Technology - Market share 2024-2029 (%)
      • 10.2 Comparison by Technology
        • Chart on Comparison by Technology
        • Data Table on Comparison by Technology
      • 10.3 Reciprocating - Market size and forecast 2024-2029
        • Chart on Reciprocating - Market size and forecast 2024-2029 ($ million)
        • Data Table on Reciprocating - Market size and forecast 2024-2029 ($ million)
        • Chart on Reciprocating - Year-over-year growth 2024-2029 (%)
        • Data Table on Reciprocating - Year-over-year growth 2024-2029 (%)
      • 10.4 Rotary screw - Market size and forecast 2024-2029
        • Chart on Rotary screw - Market size and forecast 2024-2029 ($ million)
        • Data Table on Rotary screw - Market size and forecast 2024-2029 ($ million)
        • Chart on Rotary screw - Year-over-year growth 2024-2029 (%)
        • Data Table on Rotary screw - Year-over-year growth 2024-2029 (%)
      • 10.5 Centrifugal - Market size and forecast 2024-2029
        • Chart on Centrifugal - Market size and forecast 2024-2029 ($ million)
        • Data Table on Centrifugal - Market size and forecast 2024-2029 ($ million)
        • Chart on Centrifugal - Year-over-year growth 2024-2029 (%)
        • Data Table on Centrifugal - Year-over-year growth 2024-2029 (%)
      • 10.6 Axial - Market size and forecast 2024-2029
        • Chart on Axial - Market size and forecast 2024-2029 ($ million)
        • Data Table on Axial - Market size and forecast 2024-2029 ($ million)
        • Chart on Axial - Year-over-year growth 2024-2029 (%)
        • Data Table on Axial - Year-over-year growth 2024-2029 (%)
      • 10.7 Market opportunity by Technology
        • Market opportunity by Technology ($ million)
        • Data Table on Market opportunity by Technology ($ million)

      11 Customer Landscape

      • 11.1 Customer landscape overview
        • Analysis of price sensitivity, lifecycle, customer purchase basket, adoption rates, and purchase criteria

      12 Geographic Landscape

      • 12.1 Geographic segmentation
        • Chart on Market share by geography 2024-2029 (%)
        • Data Table on Market share by geography 2024-2029 (%)
      • 12.2 Geographic comparison
        • Chart on Geographic comparison
        • Data Table on Geographic comparison
      • 12.3 APAC - Market size and forecast 2024-2029
        • Chart on APAC - Market size and forecast 2024-2029 ($ million)
        • Data Table on APAC - Market size and forecast 2024-2029 ($ million)
        • Chart on APAC - Year-over-year growth 2024-2029 (%)
        • Data Table on APAC - Year-over-year growth 2024-2029 (%)
      • 12.4 North America - Market size and forecast 2024-2029
        • Chart on North America - Market size and forecast 2024-2029 ($ million)
        • Data Table on North America - Market size and forecast 2024-2029 ($ million)
        • Chart on North America - Year-over-year growth 2024-2029 (%)
        • Data Table on North America - Year-over-year growth 2024-2029 (%)
      • 12.5 Europe - Market size and forecast 2024-2029
        • Chart on Europe - Market size and forecast 2024-2029 ($ million)
        • Data Table on Europe - Market size and forecast 2024-2029 ($ million)
        • Chart on Europe - Year-over-year growth 2024-2029 (%)
        • Data Table on Europe - Year-over-year growth 2024-2029 (%)
      • 12.6 Middle East and Africa - Market size and forecast 2024-2029
        • Chart on Middle East and Africa - Market size and forecast 2024-2029 ($ million)
        • Data Table on Middle East and Africa - Market size and forecast 2024-2029 ($ million)
        • Chart on Middle East and Africa - Year-over-year growth 2024-2029 (%)
        • Data Table on Middle East and Africa - Year-over-year growth 2024-2029 (%)
      • 12.7 South America - Market size and forecast 2024-2029
        • Chart on South America - Market size and forecast 2024-2029 ($ million)
        • Data Table on South America - Market size and forecast 2024-2029 ($ million)
        • Chart on South America - Year-over-year growth 2024-2029 (%)
        • Data Table on South America - Year-over-year growth 2024-2029 (%)
      • 12.8 US - Market size and forecast 2024-2029
        • Chart on US - Market size and forecast 2024-2029 ($ million)
        • Data Table on US - Market size and forecast 2024-2029 ($ million)
        • Chart on US - Year-over-year growth 2024-2029 (%)
        • Data Table on US - Year-over-year growth 2024-2029 (%)
      • 12.9 China - Market size and forecast 2024-2029
        • Chart on China - Market size and forecast 2024-2029 ($ million)
        • Data Table on China - Market size and forecast 2024-2029 ($ million)
        • Chart on China - Year-over-year growth 2024-2029 (%)
        • Data Table on China - Year-over-year growth 2024-2029 (%)
      • 12.10 Japan - Market size and forecast 2024-2029
        • Chart on Japan - Market size and forecast 2024-2029 ($ million)
        • Data Table on Japan - Market size and forecast 2024-2029 ($ million)
        • Chart on Japan - Year-over-year growth 2024-2029 (%)
        • Data Table on Japan - Year-over-year growth 2024-2029 (%)
      • 12.11 India - Market size and forecast 2024-2029
        • Chart on India - Market size and forecast 2024-2029 ($ million)
        • Data Table on India - Market size and forecast 2024-2029 ($ million)
        • Chart on India - Year-over-year growth 2024-2029 (%)
        • Data Table on India - Year-over-year growth 2024-2029 (%)
      • 12.12 South Korea - Market size and forecast 2024-2029
        • Chart on South Korea - Market size and forecast 2024-2029 ($ million)
        • Data Table on South Korea - Market size and forecast 2024-2029 ($ million)
        • Chart on South Korea - Year-over-year growth 2024-2029 (%)
        • Data Table on South Korea - Year-over-year growth 2024-2029 (%)
      • 12.13 UK - Market size and forecast 2024-2029
        • Chart on UK - Market size and forecast 2024-2029 ($ million)
        • Data Table on UK - Market size and forecast 2024-2029 ($ million)
        • Chart on UK - Year-over-year growth 2024-2029 (%)
        • Data Table on UK - Year-over-year growth 2024-2029 (%)
      • 12.14 Germany - Market size and forecast 2024-2029
        • Chart on Germany - Market size and forecast 2024-2029 ($ million)
        • Data Table on Germany - Market size and forecast 2024-2029 ($ million)
        • Chart on Germany - Year-over-year growth 2024-2029 (%)
        • Data Table on Germany - Year-over-year growth 2024-2029 (%)
      • 12.15 Canada - Market size and forecast 2024-2029
        • Chart on Canada - Market size and forecast 2024-2029 ($ million)
        • Data Table on Canada - Market size and forecast 2024-2029 ($ million)
        • Chart on Canada - Year-over-year growth 2024-2029 (%)
        • Data Table on Canada - Year-over-year growth 2024-2029 (%)
      • 12.16 France - Market size and forecast 2024-2029
        • Chart on France - Market size and forecast 2024-2029 ($ million)
        • Data Table on France - Market size and forecast 2024-2029 ($ million)
        • Chart on France - Year-over-year growth 2024-2029 (%)
        • Data Table on France - Year-over-year growth 2024-2029 (%)
      • 12.17 Australia - Market size and forecast 2024-2029
        • Chart on Australia - Market size and forecast 2024-2029 ($ million)
        • Data Table on Australia - Market size and forecast 2024-2029 ($ million)
        • Chart on Australia - Year-over-year growth 2024-2029 (%)
        • Data Table on Australia - Year-over-year growth 2024-2029 (%)
      • 12.18 Market opportunity by geography
        • Market opportunity by geography ($ million)
        • Data Tables on Market opportunity by geography ($ million)

      13 Drivers, Challenges, and Opportunity/Restraints

      • 13.1 Market drivers
        • 13.2 Market challenges
          • 13.3 Impact of drivers and challenges
            • Impact of drivers and challenges in 2024 and 2029
          • 13.4 Market opportunities/restraints

            14 Competitive Landscape

            • 14.1 Overview
              • 14.2 Competitive Landscape
                • Overview on criticality of inputs and factors of differentiation
              • 14.3 Landscape disruption
                • Overview on factors of disruption
              • 14.4 Industry risks
                • Impact of key risks on business

              15 Competitive Analysis

              • 15.1 Companies profiled
                • Companies covered
              • 15.2 Company ranking index
                • Company ranking index
              • 15.3 Market positioning of companies
                • Matrix on companies position and classification
              • 15.4 Accudyne Systems Inc.
                • Accudyne Systems Inc. - Overview
                • Accudyne Systems Inc. - Product / Service
                • Accudyne Systems Inc. - Key offerings
                • SWOT
              • 15.5 Aerzener Maschinenfabrik GmbH
                • Aerzener Maschinenfabrik GmbH - Overview
                • Aerzener Maschinenfabrik GmbH - Product / Service
                • Aerzener Maschinenfabrik GmbH - Key offerings
                • SWOT
              • 15.6 Atlas Copco AB
                • Atlas Copco AB - Overview
                • Atlas Copco AB - Business segments
                • Atlas Copco AB - Key news
                • Atlas Copco AB - Key offerings
                • Atlas Copco AB - Segment focus
                • SWOT
              • 15.7 BAUER COMPRESSORS INC
                • BAUER COMPRESSORS INC - Overview
                • BAUER COMPRESSORS INC - Product / Service
                • BAUER COMPRESSORS INC - Key offerings
                • SWOT
              • 15.8 BOGE
                • BOGE - Overview
                • BOGE - Product / Service
                • BOGE - Key offerings
                • SWOT
              • 15.9 Burckhardt Compression
                • Burckhardt Compression - Overview
                • Burckhardt Compression - Product / Service
                • Burckhardt Compression - Key offerings
                • SWOT
              • 15.10 Ebara Corp.
                • Ebara Corp. - Overview
                • Ebara Corp. - Business segments
                • Ebara Corp. - Key news
                • Ebara Corp. - Key offerings
                • Ebara Corp. - Segment focus
                • SWOT
              • 15.11 Elgi Equipments Ltd
                • Elgi Equipments Ltd - Overview
                • Elgi Equipments Ltd - Business segments
                • Elgi Equipments Ltd - Key offerings
                • Elgi Equipments Ltd - Segment focus
                • SWOT
              • 15.12 Gardner Denver
                • Gardner Denver - Overview
                • Gardner Denver - Product / Service
                • Gardner Denver - Key offerings
                • SWOT
              • 15.13 General Electric Co.
                • General Electric Co. - Overview
                • General Electric Co. - Business segments
                • General Electric Co. - Key news
                • General Electric Co. - Key offerings
                • General Electric Co. - Segment focus
                • SWOT
              • 15.14 Hitachi Ltd.
                • Hitachi Ltd. - Overview
                • Hitachi Ltd. - Business segments
                • Hitachi Ltd. - Key news
                • Hitachi Ltd. - Key offerings
                • Hitachi Ltd. - Segment focus
                • SWOT
              • 15.15 IDEX Corp.
                • IDEX Corp. - Overview
                • IDEX Corp. - Business segments
                • IDEX Corp. - Key news
                • IDEX Corp. - Key offerings
                • IDEX Corp. - Segment focus
                • SWOT
              • 15.16 Ingersoll Rand Inc.
                • Ingersoll Rand Inc. - Overview
                • Ingersoll Rand Inc. - Business segments
                • Ingersoll Rand Inc. - Key offerings
                • Ingersoll Rand Inc. - Segment focus
                • SWOT
              • 15.17 Kobe Steel Ltd.
                • Kobe Steel Ltd. - Overview
                • Kobe Steel Ltd. - Business segments
                • Kobe Steel Ltd. - Key news
                • Kobe Steel Ltd. - Key offerings
                • Kobe Steel Ltd. - Segment focus
                • SWOT
              • 15.18 The Procter and Gamble Co.
                • The Procter and Gamble Co. - Overview
                • The Procter and Gamble Co. - Business segments
                • The Procter and Gamble Co. - Key offerings
                • The Procter and Gamble Co. - Segment focus
                • SWOT

              16 Appendix

              • 16.1 Scope of the report
                • 16.2 Inclusions and exclusions checklist
                  • Inclusions checklist
                  • Exclusions checklist
                • 16.3 Currency conversion rates for US$
                  • Currency conversion rates for US$
                • 16.4 Research methodology
                  • Research methodology
                • 16.5 Data procurement
                  • Information sources
                • 16.6 Data validation
                  • Data validation
                • 16.7 Validation techniques employed for market sizing
                  • Validation techniques employed for market sizing
                • 16.8 Data synthesis
                  • Data synthesis
                • 16.9 360 degree market analysis
                  • 360 degree market analysis
                • 16.10 List of abbreviations
                  • List of abbreviations

                Research Methodology

                Technavio presents a detailed picture of the market by way of study, synthesis, and summation of data from multiple sources. The analysts have presented the various facets of the market with a particular focus on identifying the key industry influencers. The data thus presented is comprehensive, reliable, and the result of extensive research, both primary and secondary.

                INFORMATION SOURCES

                Primary sources

                • Manufacturers and suppliers
                • Channel partners
                • Industry experts
                • Strategic decision makers

                Secondary sources

                • Industry journals and periodicals
                • Government data
                • Financial reports of key industry players
                • Historical data
                • Press releases

                DATA ANALYSIS

                Data Synthesis

                • Collation of data
                • Estimation of key figures
                • Analysis of derived insights

                Data Validation

                • Triangulation with data models
                • Reference against proprietary databases
                • Corroboration with industry experts

                REPORT WRITING

                Qualitative

                • Market drivers
                • Market challenges
                • Market trends
                • Five forces analysis

                Quantitative

                • Market size and forecast
                • Market segmentation
                • Geographical insights
                • Competitive landscape

                Interested in this report?

                Get your sample now to see our research methodology and insights!

                Download Now

                Frequently Asked Questions

                Gas Compressors market growth will increase by $ 2882.8 mn during 2025-2029 .

                The Gas Compressors market is expected to grow at a CAGR of 5.2% during 2025-2029 .

                Gas Compressors market is segmented by Product( PD compressors, Roller crushers) End-user( Oil and gas, Power generation, Chemicals and petrochemicals, Mining, Others) Technology( Reciprocating, Rotary screw, Centrifugal, Axial, South America)

                Accudyne Systems Inc., Aerzener Maschinenfabrik GmbH, Atlas Copco AB, BAUER COMPRESSORS INC, BOGE, Burckhardt Compression, Ebara Corp., Elgi Equipments Ltd, Gardner Denver, General Electric Co., Hitachi Ltd., IDEX Corp., Ingersoll Rand Inc., J.P Sauer and Sohn Maschinenbau GmbH, KAESER KOMPRESSOREN SE, Kobe Steel Ltd., Mitsubishi Heavy Industries Ltd., Siemens AG, Sulzer Ltd., The Procter and Gamble Co. are a few of the key vendors in the Gas Compressors market.

                APAC will register the highest growth rate of 53% among the other regions. Therefore, the Gas Compressors market in APAC is expected to garner significant business opportunities for the vendors during the forecast period.

                US, China, Japan, India, UK, South Korea, Germany, Canada, France, Australia

                • Increasing need for energy-efficient gas compressor systemsThere is a rising need to follow the energy efficiency criteria and reduce emissions in the oil and gas market. One of the key objectives of increasing energy efficiency is to reduce carbon emissions and make the market eco-friendlier. Regional government authorities is the driving factor this market.
                • especially in Europe and North America is the driving factor this market.
                • are taking initiatives to guarantee that various types of industrial equipment is the driving factor this market.
                • such as compressors is the driving factor this market.
                • conform to the respective regional regulations. Lowering electricity consumption is also a factor in adopting new compressors in this market. Nearly eight Hp of electricity is required to produce one Hp of compressed gas is the driving factor this market.
                • and around 70% of the total lifetime costs of compressors comprise electricity consumption. Based on the location of the refinery and local power costs is the driving factor this market.
                • electricity costs can be substantial. It can be as high as twice the initial cost of the gas compressor. On average is the driving factor this market.
                • in a gas compressor with a power rating of 100 Hp worth about $40 is the driving factor this market.
                • 000 is the driving factor this market.
                • the total power consumption charges will be worth around $800 is the driving factor this market.
                • 000 over a period of 10 years of operation. To raise overall energy efficiency is the driving factor this market.
                • the foremost requirement for industrial end-users is to adopt compressors that incorporate efficient and reliable controls. For instance is the driving factor this market.
                • KAESER KOMPRESSOREN is the driving factor this market.
                • in association with Siemens is the driving factor this market.
                • has developed the latest technology incorporated in compressor control. It has an industrial-based PC with an Intel microprocessor inside it. Five different types of compressor control configurations that monitor the compressor operation are available is the driving factor this market.
                • thus increasing energy savings. Compressors can be monitored and controlled from remote locations anywhere in the world with the help of this Sigma controller. This has encouraged the oil and gas market to reduce its power consumption by replacing its old gas compressors with new energy-efficient gas compressors. Thus is the driving factor this market.
                • the increasing need for energy-efficient gas compressor systems will drive the global gas compressors market during the forecast period. is the driving factor this market.

                The Gas Compressors market vendors should focus on grabbing business opportunities from the PD compressors segment as it accounted for the largest market share in the base year.