
Gasoline As A Fuel Market Size 2026-2030
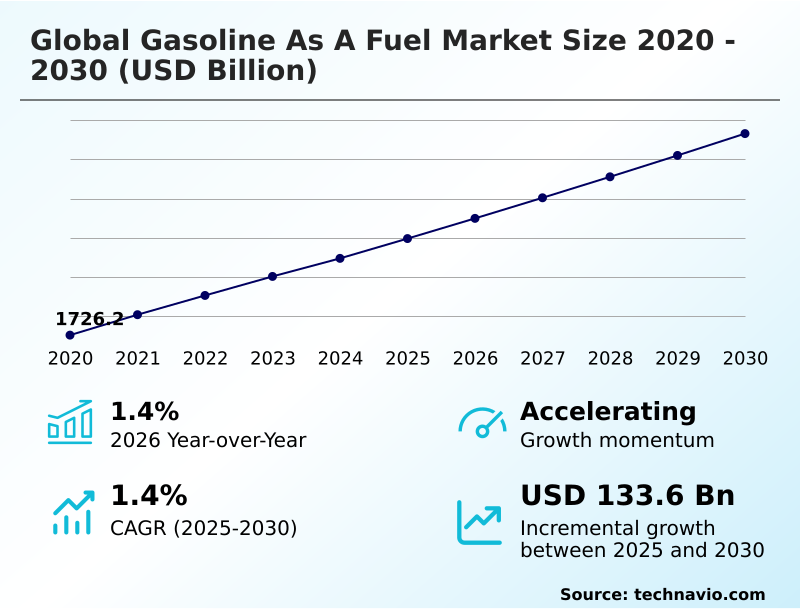
The gasoline as a fuel market size is valued to increase by USD 133.6 billion, at a CAGR of 1.4% from 2025 to 2030. Increasing number of automobiles worldwide will drive the gasoline as a fuel market.
Major Market Trends & Insights
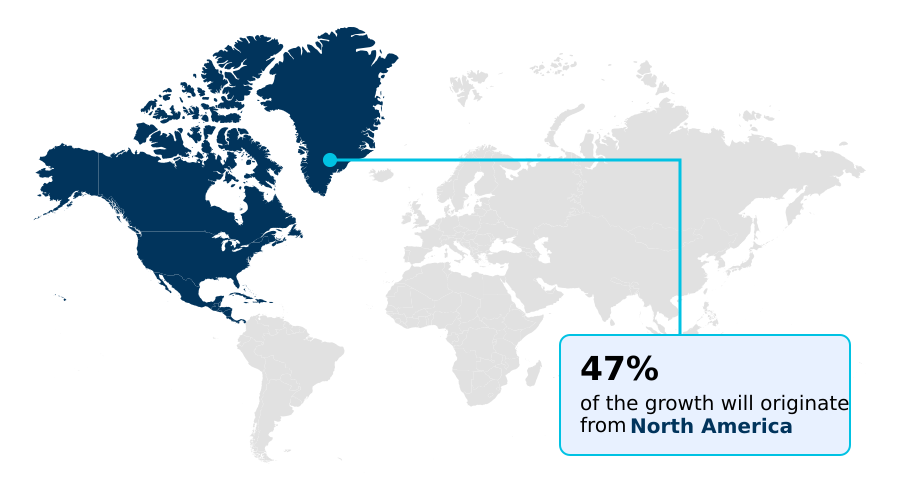
- North America dominated the market and accounted for a 47.4% growth during the forecast period.
- By Application - Passenger vehicles segment was valued at USD 1008.1 billion in 2024
- By Distribution Channel - Fuel stations segment accounted for the largest market revenue share in 2024
Market Size & Forecast
- Market Opportunities: USD 256.5 billion
- Market Future Opportunities: USD 133.6 billion
- CAGR from 2025 to 2030 : 1.4%
Market Summary
- The gasoline as a fuel market is navigating a complex period of transition, defined by both resilient demand and structural shifts. The bedrock of consumption remains the vast fleet of vehicles powered by spark-ignited internal combustion engines, which rely on the high fuel energy density that gasoline provides.
- Key market drivers include rising vehicle ownership in emerging economies and the expanding use of gasoline in non-automotive applications, such as portable power generation and light commercial equipment. Concurrently, the industry is shaped by trends toward higher-performance fuels, with increasing demand for high-octane fuels and advanced gasoline formulation to support modern turbocharged engines and gasoline direct injection (GDI) systems.
- For instance, logistics companies are optimizing their light-duty vehicle fleet by adopting telematics to monitor fuel usage, which has led to a 15% improvement in combustion efficiency and route planning.
- However, the market faces significant headwinds from fuel price volatility linked to crude oil feedstock costs and stringent regulations mandating lower greenhouse gas (ghg) emissions and the integration of renewable components like ethanol blending. This dynamic requires refiners to balance investments in downstream refining capacity with a long-term decarbonization strategy, a challenge that defines the industry's strategic outlook.
What will be the Size of the Gasoline As A Fuel Market during the forecast period?
Get Key Insights on Market Forecast (PDF) Get Free Sample
How is the Gasoline As A Fuel Market Segmented?
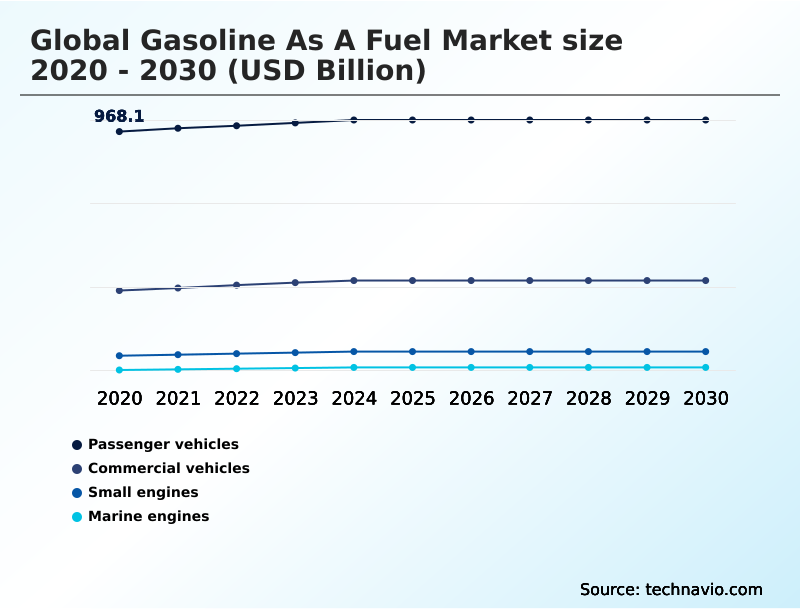
The gasoline as a fuel industry research report provides comprehensive data (region-wise segment analysis), with forecasts and estimates in "USD billion" for the period 2026-2030, as well as historical data from 2020-2024 for the following segments.
- Application
- Passenger vehicles
- Commercial vehicles
- Small engines
- Marine engines
- Distribution channel
- Fuel stations
- Direct supply to fleets
- Online fuel delivery services
- Type
- Conventional gasoline
- Reformulated gasoline
- Oxygenated gasoline
- Geography
- North America
- US
- Canada
- Mexico
- Europe
- Germany
- France
- Italy
- APAC
- China
- India
- Japan
- South America
- Brazil
- Argentina
- Middle East and Africa
- Saudi Arabia
- UAE
- South Africa
- Rest of World (ROW)
- North America
By Application Insights
The passenger vehicles segment is estimated to witness significant growth during the forecast period.
The passenger vehicles segment remains a cornerstone of the transportation fuel market, primarily sustained by the vast global fleet of internal combustion engine (ICE) vehicles.
Demand is increasingly shaped by advanced technologies like gasoline direct injection (GDI) and turbocharging, which necessitate high-octane fuels to achieve optimal combustion efficiency.
As consumer mobility patterns evolve, the light-duty vehicle fleet is adapting, with a notable preference for larger vehicles maintaining volume demand. The ongoing energy transition influences gasoline formulation, with a push toward cleaner-burning gasoline to support broader decarbonization strategy goals.
Despite the rise of alternatives, the total cost of ownership (TCO) for many consumers keeps ICE vehicles relevant, with hybrid models now accounting for over 9% of new vehicle registrations, bridging the gap to full electrification.
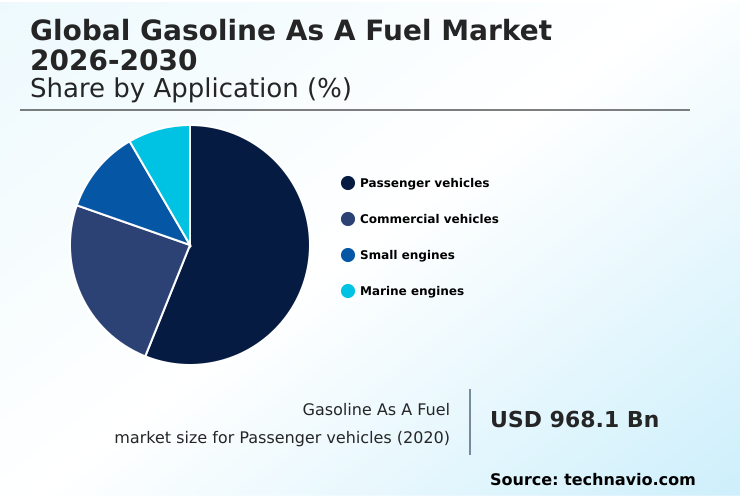
The Passenger vehicles segment was valued at USD 1008.1 billion in 2024 and showed a gradual increase during the forecast period.
Regional Analysis
North America is estimated to contribute 47.4% to the growth of the global market during the forecast period.Technavio’s analysts have elaborately explained the regional trends and drivers that shape the market during the forecast period.
See How Gasoline As A Fuel Market Demand is Rising in North America Get Free Sample
The geographic landscape of the gasoline market is undergoing a significant realignment. North America, accounting for 47.4% of incremental growth, remains a dominant consumer, but its mature market focuses on downstream asset optimization and supply chain resilience.
Refiners are adapting to flat domestic demand by leveraging advanced fractional distillation techniques and exporting surplus products.
In contrast, APAC is the epicenter of growth, with countries expanding downstream refining capacity to meet rising domestic demand and reduce reliance on imports, enhancing national energy security. This regional build-out is creating new trade flows and increasing competition.
For example, new mega-refineries in the Middle East and APAC, designed with deep petrochemical integration, are achieving a 10% higher operational efficiency compared to older facilities in Europe.
This shift not only displaces traditional suppliers but also intensifies geopolitical supply risks as the global fuel trade reorients toward these new production hubs.
Market Dynamics
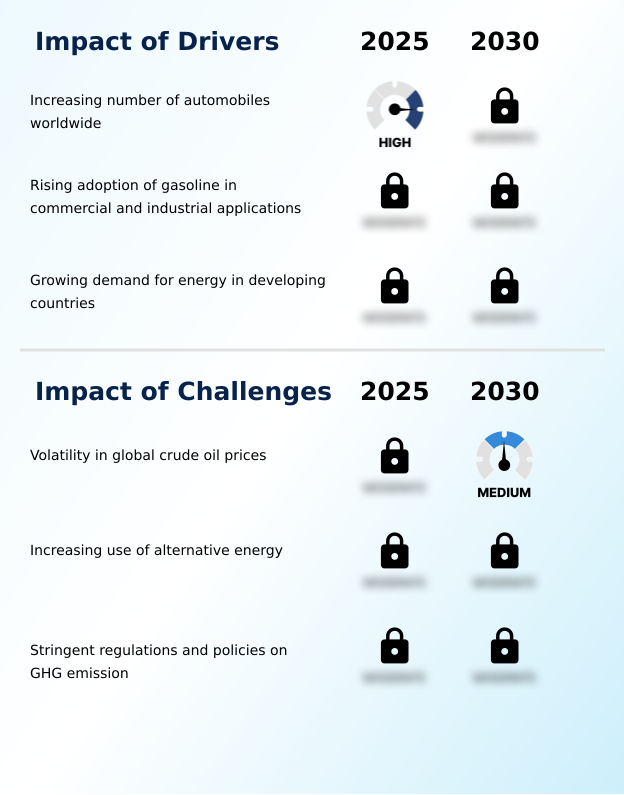
Our researchers analyzed the data with 2025 as the base year, along with the key drivers, trends, and challenges. A holistic analysis of drivers will help companies refine their marketing strategies to gain a competitive advantage.
- The strategic direction of the gasoline as a fuel market is increasingly influenced by nuanced factors beyond simple consumption figures. A critical area of focus is the impact of ethanol blending on engine performance, particularly in legacy vehicles not designed for higher concentrations.
- This is closely related to the role of gasoline in hybrid electric vehicles, where it acts as a range extender and power source, sustaining demand even as electrification progresses. The industry's growth trajectory is heavily dependent on gasoline demand in emerging economies, where rising incomes are fueling first-time vehicle purchases.
- Within this context, the demand for high-octane fuel for turbocharged engines is a key value-added segment. Refiners are also tasked with producing reformulated gasoline for emission control areas to meet stringent air quality mandates.
- From a consumer perspective, the cost-benefit of premium vs regular gasoline remains a central purchasing decision, while for industrial users, ensuring a reliable supply of gasoline for portable generators is paramount. For fleet managers, optimizing supply chain logistics for remote fuel delivery is a significant operational challenge.
- Operational planning must account for the impact of CAFE standards on gasoline consumption, which has driven manufacturers to innovate, resulting in a fleet-wide fuel economy improvement of over 25% in the last decade. The challenges of gasoline distribution networks are compounded by the impact of crude oil prices on gasoline market stability.
- This complex interplay of factors defines the ongoing transition from gasoline to alternative fuels, demanding sophisticated strategies from all market participants.
What are the key market drivers leading to the rise in the adoption of Gasoline As A Fuel Industry?
- A primary driver for the gasoline market is the expanding global fleet of automobiles, particularly in developing economies where vehicle ownership continues to rise.
- The resilience of the gasoline market is primarily driven by expanding consumer mobility patterns in developing nations, where the light-duty vehicle fleet is growing. This sustained demand necessitates significant fuel infrastructure investment to ensure supply meets consumption.
- The increased availability of crude oil feedstock, partly due to innovations in light-tight oil production, helps stabilize supply chains against geopolitical supply risks.
- Furthermore, gasoline's role as a high-density fuel energy carrier remains unmatched for many applications, supporting its continued use.
- Advances in engine technology have led to a notable 15% improvement in combustion efficiency in newer vehicles compared to models from a decade ago, helping to moderate overall demand growth while still underpinning the market's foundation.
What are the market trends shaping the Gasoline As A Fuel Industry?
- A notable market trend is the increasing utilization of portable gasoline generators for backup power. This is driven by needs for greater energy resilience in residential and commercial settings.
- Key trends in the gasoline market reflect a push toward specialization and energy diversification. The rise of premium fuels, defined by a higher octane rating (ron), is driven by modern engine technology, with sales in this segment showing a 12% year-over-year increase in some developed markets.
- Concurrently, the increasing use of gasoline-powered backup power solutions for residential and commercial applications underscores the fuel's role in supply chain resilience during grid outages. In the small engines sector, manufacturers are innovating to reduce two-stroke engine emissions by over 40% to comply with new environmental standards.
- The growing demand for non-ethanol gasoline in marine and recreational applications also highlights a niche but profitable market segment focused on performance and engine longevity, diversifying revenue streams for distributors.
What challenges does the Gasoline As A Fuel Industry face during its growth?
- Significant volatility in global crude oil prices presents a primary challenge, creating uncertainty in production costs and retail pricing for the gasoline industry.
- The gasoline market faces significant challenges, primarily from structural shifts toward decarbonization and persistent fuel price volatility. Stringent environmental regulations impose high regulatory compliance cost on refiners, forcing them to invest in upgrading processes like catalytic cracking and alkylation to produce cleaner fuels. This has led to a 5% increase in operational expenditures for some older facilities.
- Additionally, aggressive fuel taxation policy in many regions and mandates for increased ethanol blending create downward pressure on conventional gasoline demand. Refiners must carefully manage refinery utilization rates, which have seen fluctuations of up to 10% in certain markets due to uncertain demand signals, complicating long-term investment decisions within a broader decarbonization strategy.
Exclusive Technavio Analysis on Customer Landscape
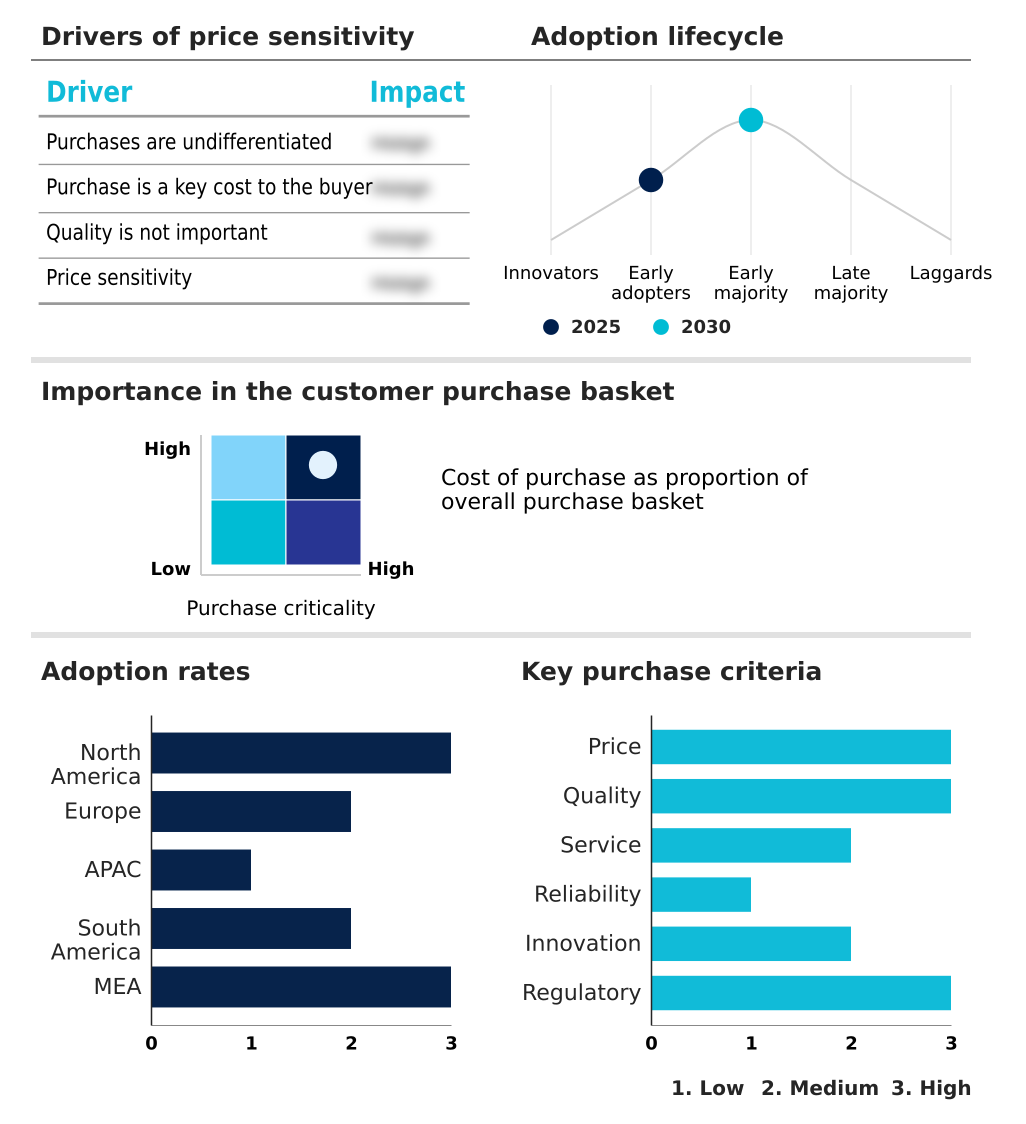
The gasoline as a fuel market forecasting report includes the adoption lifecycle of the market, covering from the innovator’s stage to the laggard’s stage. It focuses on adoption rates in different regions based on penetration. Furthermore, the gasoline as a fuel market report also includes key purchase criteria and drivers of price sensitivity to help companies evaluate and develop their market growth analysis strategies.
Customer Landscape of Gasoline As A Fuel Industry
Competitive Landscape
Companies are implementing various strategies, such as strategic alliances, gasoline as a fuel market forecast, partnerships, mergers and acquisitions, geographical expansion, and product/service launches, to enhance their presence in the industry.
BP Plc - Analysis indicates a focus on providing multi-tiered gasoline grades, including E15 blends and premium options, engineered to enhance engine performance and efficiency for a diverse vehicle fleet.
The industry research and growth report includes detailed analyses of the competitive landscape of the market and information about key companies, including:
- BP Plc
- Chevron Corp.
- Emirates National Oil Co.
- Exxon Mobil Corp.
- Flint Hills Resources
- Indian Oil Corp. Ltd.
- Kuwait Petroleum Corp.
- Marathon Petroleum Corp.
- PBF Energy Inc.
- PetroChina Co. Ltd.
- Petroleos de Venezuela SA
- Reliance Industries Ltd.
- Rosneft Oil Co.
- Saudi Arabian Oil Co.
- Shell plc
- Suncor Energy Inc.
- Valero Energy Corp.
Qualitative and quantitative analysis of companies has been conducted to help clients understand the wider business environment as well as the strengths and weaknesses of key industry players. Data is qualitatively analyzed to categorize companies as pure play, category-focused, industry-focused, and diversified; it is quantitatively analyzed to categorize companies as dominant, leading, strong, tentative, and weak.
Recent Development and News in Gasoline as a fuel market
- In August 2024, Indian Oil Corp. Ltd. reported that it had achieved a nationwide 15% ethanol blending rate in gasoline, advancing its renewable fuel objectives.
- In October 2024, Marathon Petroleum Corp. announced the formation of a dedicated Renewable Diesel business segment, signaling a strategic pivot to diversify its downstream product portfolio.
- In November 2024, EzFill Holdings finalized its acquisition of the mobile fueling division from Yoshi Mobility, consolidating its position in the on-demand fuel delivery market.
- In January 2025, Generac Power Systems launched a new line of portable gasoline generators, featuring a high-capacity 8000W model compliant with updated ANSI/PGMA G300-2023 carbon monoxide safety standards.
Dive into Technavio’s robust research methodology, blending expert interviews, extensive data synthesis, and validated models for unparalleled Gasoline As A Fuel Market insights. See full methodology.
| Market Scope | |
|---|---|
| Page number | 300 |
| Base year | 2025 |
| Historic period | 2020-2024 |
| Forecast period | 2026-2030 |
| Growth momentum & CAGR | Accelerate at a CAGR of 1.4% |
| Market growth 2026-2030 | USD 133.6 billion |
| Market structure | Fragmented |
| YoY growth 2025-2026(%) | 1.4% |
| Key countries | US, Canada, Mexico, Germany, France, Italy, UK, Spain, The Netherlands, China, India, Japan, South Korea, Australia, Indonesia, Brazil, Argentina, Chile, Saudi Arabia, UAE, South Africa, Egypt and Turkey |
| Competitive landscape | Leading Companies, Market Positioning of Companies, Competitive Strategies, and Industry Risks |
Research Analyst Overview
- The gasoline as a fuel market remains integral to global mobility, underpinned by the high fuel energy density of the liquid hydrocarbon mixture produced through fractional distillation. The existing infrastructure is built around the spark-ignited internal combustion engine (ICE), with modern variants featuring gasoline direct injection (GDI) and high-compression engines that demand high-octane fuels.
- Refinery utilization rates are a key indicator of market health, as facilities work to produce a specific gasoline formulation, including reformulated gasoline (RFG) and oxygenated gasoline, to meet regional mandates. A key boardroom decision revolves around investment in downstream refining capacity versus pivoting to carbon-neutral fuels.
- The production of specific gasoline blendstock is adjusted to manage Reid Vapor Pressure (RVP) and meet varying seasonal requirements, often involving ethanol blending. For example, optimizing the catalytic cracking process and alkylation process has enabled some refiners to increase their yield of high-value components by 5%, directly impacting profitability.
- The industry continues to develop cleaner-burning gasoline and low-sulfur fuel while facing competition from synthetic fuels. This transition is evident in the development of fuel oxygenates and low-carbon components to meet strict fuel detergent standards and address two-stroke engine emissions and four-stroke engine technology advancements.
What are the Key Data Covered in this Gasoline As A Fuel Market Research and Growth Report?
-
What is the expected growth of the Gasoline As A Fuel Market between 2026 and 2030?
-
USD 133.6 billion, at a CAGR of 1.4%
-
-
What segmentation does the market report cover?
-
The report is segmented by Application (Passenger vehicles, Commercial vehicles, Small engines, and Marine engines), Distribution Channel (Fuel stations, Direct supply to fleets, and Online fuel delivery services), Type (Conventional gasoline, Reformulated gasoline, and Oxygenated gasoline) and Geography (North America, Europe, APAC, South America, Middle East and Africa)
-
-
Which regions are analyzed in the report?
-
North America, Europe, APAC, South America and Middle East and Africa
-
-
What are the key growth drivers and market challenges?
-
Increasing number of automobiles worldwide, Volatility in global crude oil prices
-
-
Who are the major players in the Gasoline As A Fuel Market?
-
BP Plc, Chevron Corp., Emirates National Oil Co., Exxon Mobil Corp., Flint Hills Resources, Indian Oil Corp. Ltd., Kuwait Petroleum Corp., Marathon Petroleum Corp., PBF Energy Inc., PetroChina Co. Ltd., Petroleos de Venezuela SA, Reliance Industries Ltd., Rosneft Oil Co., Saudi Arabian Oil Co., Shell plc, Suncor Energy Inc. and Valero Energy Corp.
-
Market Research Insights
- The gasoline market is shaped by competing dynamics of energy security and a global decarbonization strategy. While fuel price volatility remains a persistent challenge, the industry is adapting through innovations in the fuel supply chain. For example, fleets engaged in last-mile delivery services have achieved a 10% reduction in operational expenses by optimizing routes and leveraging advanced fuel management systems.
- Adherence to stringent corporate average fuel economy (CAFE) and renewable fuel standards is driving the adoption of more efficient engine technologies.
- This has led to new vehicle models demonstrating up to a 15% improvement in fuel economy, directly impacting the total cost of ownership (TCO) for consumers and commercial operators alike, even as the push to lower greenhouse gas (GHG) emissions intensifies.
We can help! Our analysts can customize this gasoline as a fuel market research report to meet your requirements.
 RIA -
RIA - 
