Gastroparesis Drugs Market Analysis North America, Europe, Asia, Rest of World (ROW) - US, China, Germany, UK, Canada, India, Japan, South Korea, France, Italy - Size and Forecast 2025-2029

Gastroparesis Drugs Market Analysis North America, Europe, Asia, Rest of World (ROW) - US, China, Germany, UK, Canada, India, Japan, South Korea, France, Italy - Size and Forecast 2025-2029

Published: Dec 2024 198 Pages SKU: IRTNTR76697

Market Overview at a Glance

$1.34 B
Market Opportunity
3.5%
CAGR
3.4
YoY growth 2024-2025(%)

Gastroparesis Drugs Market Size 2025-2029

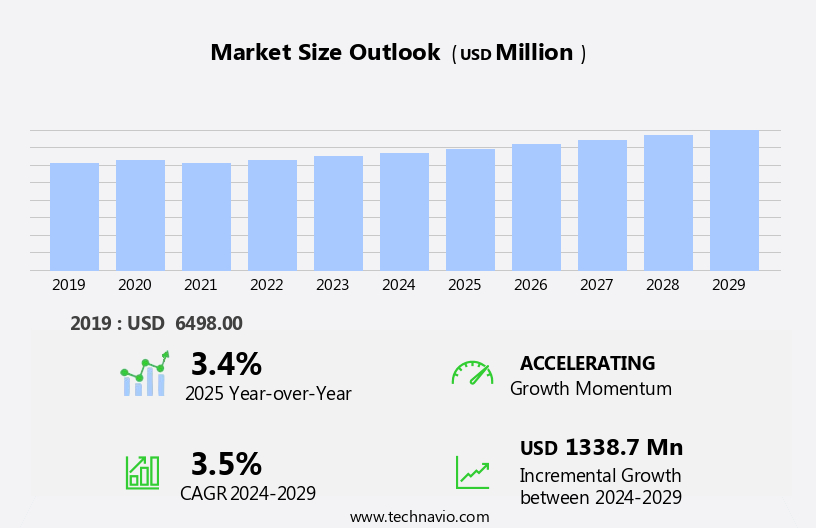
The gastroparesis drugs market size is forecast to increase by USD 1.34 billion at a CAGR of 3.5% between 2024 and 2029.

  • The market is witnessing significant growth due to the rising global burden of diabetes, a primary cause of gastroparesis. Diabetes affects the nerves that control the muscles of the stomach, leading to delayed gastric emptying. According to the International Diabetes Federation, the global prevalence of diabetes reached 463 million in 2019, and this number is projected to increase to 700 million by 2045. This trend presents a substantial growth opportunity for the market. Moreover, emerging markets, particularly in Asia Pacific, are expected to offer lucrative growth opportunities due to increasing awareness and diagnosis rates. However, the market faces challenges from stringent regulatory guidelines.
  • For instance, the US Food and Drug Administration (FDA) requires rigorous clinical trials and post-marketing surveillance for gastroparesis drugs. These factors necessitate strategic planning and investment in research and development for market players to capitalize on growth opportunities and navigate regulatory challenges effectively. Companies seeking to enter or expand in the market must focus on developing innovative solutions that address unmet medical needs while complying with regulatory requirements.

What will be the Size of the Gastroparesis Drugs Market during the forecast period?

Gastroparesis Drugs Market Size

 Request Free Sample

  • The gastroparesis drug market in the US is experiencing significant activity due to the rising prevalence of gastroparesis, a digestive disorder characterized by delayed emptying of the stomach. Factors driving market growth include the increasing incidence of diabetes, a known risk factor for gastroparesis, and lifestyle factors such as tobacco and alcohol consumption. The market is also witnessing an influx of innovative drugs, including metopimazine, erythromycin, metoclopramide, tradipitant, and deudomperidone, which offer improved symptom management for patients. Clinical trials for new antiemetics are underway to address unmet needs in gastroparesis treatment, such as addressing the underlying cause of the condition rather than just managing symptoms.
  • However, concerns regarding the safety of certain gastroparesis drugs, including metoclopramide and Reglan, due to side effects like liver injury and neuroleptic malignant syndrome, may hinder market growth. Additionally, digestive disruptions caused by acute cholecystitis and pancreatitis can lead to gastroparesis, further expanding the market scope.

How is this Gastroparesis Drugs Industry segmented?

The gastroparesis drugs industry research report provides comprehensive data (region-wise segment analysis), with forecasts and estimates in "USD million" for the period 2025-2029, as well as historical data from 2019-2023 for the following segments.
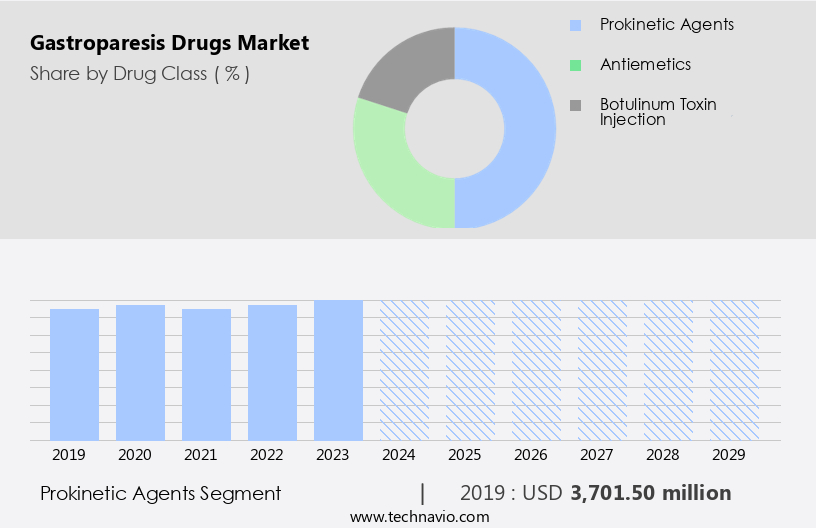
  • Drug Class
    • Prokinetic agents
    • Antiemetics
    • Botulinum toxin injection
  • Disease Type
    • Idiopathic gastroparesis
    • Diabetic gastroparesis
    • Post-surgical gastroparesis
  • Drug
    • Aminosalicylates
    • Digestive enzymes
    • Proton Pump Inhibitors
    • Laxatives
    • Anti-Emetics
    • Aminosalicylates
    • Digestive enzymes
    • Proton Pump Inhibitors
    • Laxatives
    • Anti-Emetics
  • Route of Administration
    • Oral
    • Injectable
    • Others
    • Oral
    • Injectable
    • Others
  • Geography
    • North America
      • US
      • Canada
    • Europe
      • France
      • Germany
      • Italy
      • UK
    • Asia
      • China
      • India
      • Japan
      • South Korea
    • Rest of World (ROW)

    By Drug Class Insights

    The prokinetic agents segment is estimated to witness significant growth during the forecast period.

    Prokinetic drugs play a crucial role in managing gastroparesis symptoms by addressing the underlying issue of delayed stomach emptying. These medications, such as metoclopramide and domperidone, are popular due to their ability to improve stomach motility. However, not all prokinetic agents guarantee a corresponding improvement in stomach emptying. A few have been withdrawn from the market. Some prokinetic medications, including metoclopramide, also exhibit antiemetic properties. explores innovative drugs like ghrelin, motilin, 5-HT4 receptor agonists, and dopamine receptors for their potential in gastroparesis treatment. These drugs offer fewer side effects and proven efficacy. Tobacco consumption and alcohol intake can hinder the effectiveness of these medications and contribute to gastroparesis symptoms.

    Additionally, complications from surgical procedures, diabetes, and blood sugar regulation, as well as autonomic neuropathy in diabetic cases, can exacerbate gastroparesis symptoms. Enteral nutrition, specialized care, and surgical interventions may be necessary for severe cases. Gastroparesis can also be associated with conditions like acute pancreatitis and acute cholecystitis. Symptoms such as vomiting, nausea, abdominal discomfort, and nutrient absorption complications require careful management. Clinical trials and FDA clearance are essential for bringing new treatments to market.

    Gastroparesis Drugs Market Size

    Get a glance at the market report of share of various segments Request Free Sample

    The Prokinetic agents segment was valued at USD 3.7 billion in 2019 and showed a gradual increase during the forecast period.
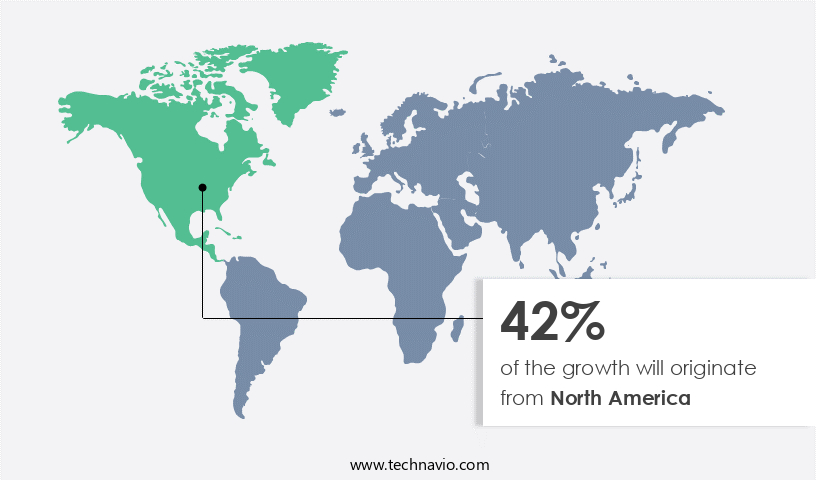
    Regional Analysis

    North America is estimated to contribute 42% to the growth of the global market during the forecast period.Technavio’s analysts have elaborately explained the regional trends and drivers that shape the market during the forecast period.

    Gastroparesis Drugs Market Share by Geography

    For more insights on the market size of various regions, Request Free Sample

    The market in North America is experiencing growth due to the rising prevalence of diabetes, a major risk factor for the condition. According to the Centers for Disease Control and Prevention (CDC), over 130 million adults in the US had diabetes in 2022. Obesity, caused by unhealthy diets and sedentary lifestyles, is a significant contributor to the increasing diabetes prevalence. Type 2 diabetes, which accounts for 90%-95% of all diabetes cases in the US, is particularly prevalent. Gastroparesis, a condition characterized by hindered digestion and resulting symptoms such as vomiting, abdominal discomfort, and nutrient absorption complications, affects individuals with diabetes more frequently.

    Factors such as tobacco consumption and alcohol use can also contribute to gastroparesis. In the medical community, various treatments are employed for gastroparesis management, including metoclopramide, prokinetic agents like domperidone, and antiemetics like metopimazine. In some cases, surgical procedures, enteral nutrition, and specialized care may be necessary. has led to the development of innovative drugs like tradipitant for symptom management and erythromycin for motility enhancement. Clinical trials and FDA clearance are ongoing for these and other potential treatments. Gastroparesis can complicate acute conditions like acute pancreatitis and acute cholecystitis, necessitating prompt and effective treatment. The market for gastroparesis drugs is expected to continue growing as researchers and pharmaceutical companies work to improve treatment options for this debilitating condition.

    Market Dynamics

    Our researchers analyzed the data with 2024 as the base year, along with the key drivers, trends, and challenges. A holistic analysis of drivers will help companies refine their marketing strategies to gain a competitive advantage.

    What are the key market drivers leading to the rise in the adoption of Gastroparesis Drugs Industry?

    • Rising global burden of diabetes is the key driver of the market. 

    • Diabetes, a chronic condition affecting over 537 million adults worldwide, impairs the body's ability to use insulin effectively or produce sufficient insulin, leading to hyperglycemia and potential damage to vital organs. By 2030, this number is projected to rise to 643 million, and further increase to 783 million by 2045. The prevalence of both Type 1 and Type 2 diabetes significantly increases the risk of developing gastroparesis. This condition, characterized by delayed gastric emptying, can result in severe discomfort and complications, making timely intervention crucial.
    • The market is driven by the rising prevalence of diabetes, increasing awareness, and advancements in treatment options. The market is expected to grow steadily due to the unmet medical needs and the significant burden of diabetes on the global population.

    What are the market trends shaping the Gastroparesis Drugs Industry?

    • Increasing growth opportunities in emerging markets is the upcoming market trend. 

    • The gastrointestinal disorders market is witnessing significant growth due to the increasing number of undiagnosed and untreated cases, particularly in emerging economies. According to , the incidence and prevalence of chronic gastrointestinal disorders, such as gastroparesis, have been increasing in Asia, including China and India. To capitalize on this trend, companies are expanding their businesses in these regions to generate substantial revenue and increase their market presence. Additionally, these companies are investing in expanding their research and development teams and manufacturing facilities to improve their product portfolios and launch new offerings, thereby creating new growth opportunities.
    • For instance, Abbott, a leading market player, has been continuously expanding its research and development capabilities in emerging markets like Brazil, India, and China. This strategic move will enable the company to cater to the growing demand for gastrointestinal disorder treatments and strengthen its market position.

    What challenges does the Gastroparesis Drugs Industry face during its growth?

    • Stringent regulatory guidelines is a key challenge affecting the industry growth. 

    • In The market, regulatory authorities such as the US Food and Drug Administration (FDA) and the European Medicines Agency (EMA) play a crucial role in ensuring the safety and efficacy of drugs. These agencies rigorously examine various factors, including pharmacological data, pharmacodynamic effects, and drug interactions, before approving a drug. Failure to meet these criteria can result in a complete response letter (CRL) or rejection.
    • In response to a CRL, the drug applicant must provide additional data to address the regulatory concerns. The stringent regulatory approval process is essential to maintaining the highest standards of drug quality and safety.

    Exclusive Customer Landscape

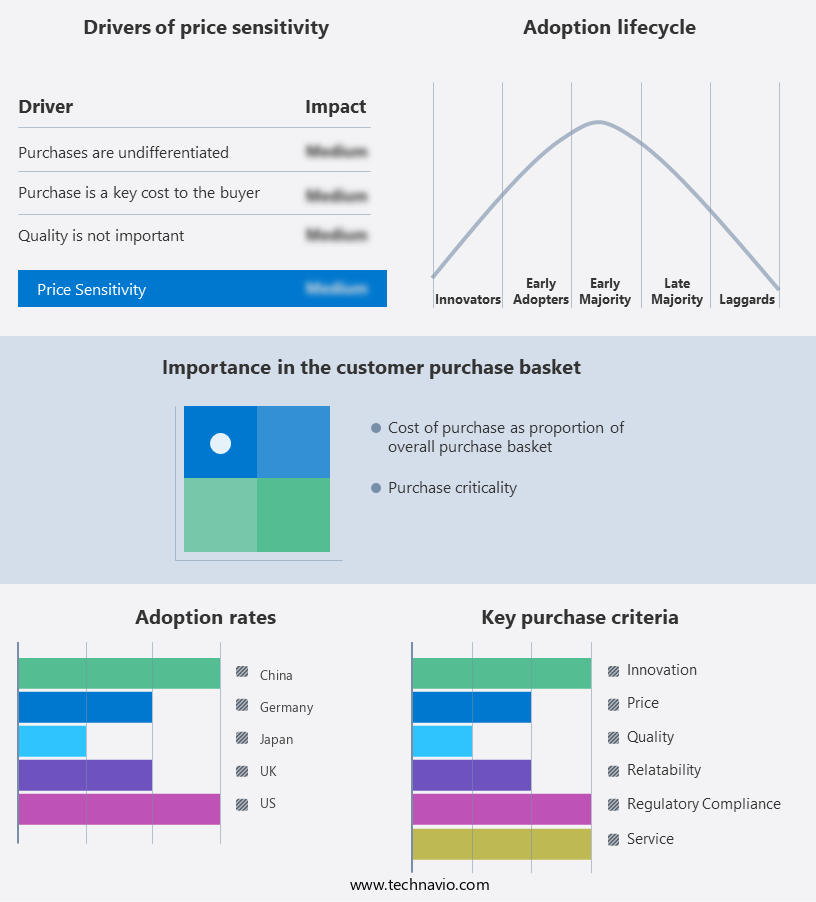
    The gastroparesis drugs market forecasting report includes the adoption lifecycle of the market, covering from the innovator’s stage to the laggard’s stage. It focuses on adoption rates in different regions based on penetration. Furthermore, the gastroparesis drugs market report also includes key purchase criteria and drivers of price sensitivity to help companies evaluate and develop their market growth analysis strategies.

    Gastroparesis Drugs Market Share by Geography

     Customer Landscape

    Key Companies & Market Insights

    Companies are implementing various strategies, such as strategic alliances, gastroparesis drugs market forecast, partnerships, mergers and acquisitions, geographical expansion, and product/service launches, to enhance their presence in the industry.

    Abbott Laboratories - The company specializes in providing innovative solutions for gastroparesis, including FDA-approved medications such as Ganaton OD and Ganaton. These drugs aim to improve gastric emptying and alleviate symptoms associated with this condition. With a focus on advancing medical research and development, the company's offerings cater to a global market, delivering effective treatments for individuals suffering from gastroparesis.

    The industry research and growth report includes detailed analyses of the competitive landscape of the market and information about key companies, including:

    • Abbott Laboratories
    • AbbVie Inc.
    • Aclipse Therapeutics
    • ANI Pharmaceuticals Inc.
    • Bausch Health Companies Inc.
    • Cadila Pharmaceuticals Ltd.
    • Eisai Co. Ltd.
    • Evoke Pharma Inc.
    • GlaxoSmithKline Plc
    • Ipca Laboratories
    • Johnson and Johnson Inc.
    • Medtronic Plc
    • Neurogastrx Inc.
    • Otsuka Pharmaceutical Co. Ltd.
    • Pfizer Inc.
    • Processa Pharmaceuticals Inc.
    • Rhythm Pharmaceuticals Inc.
    • Takeda Pharmaceutical Co. Ltd.
    • Theravance Biopharma Inc.
    • Vanda Pharmaceuticals Inc.

    Qualitative and quantitative analysis of companies has been conducted to help clients understand the wider business environment as well as the strengths and weaknesses of key industry players. Data is qualitatively analyzed to categorize companies as pure play, category-focused, industry-focused, and diversified; it is quantitatively analyzed to categorize companies as dominant, leading, strong, tentative, and weak.

    Research Analyst Overview

    The gastroparesis market encompasses a range of pharmaceutical solutions designed to manage the symptoms of this debilitating condition. Gastroparesis, a motility disorder characterized by delayed emptying of the stomach, can be caused by various factors including diabetes, tobacco consumption, and certain medications. The symptoms of gastroparesis can significantly impact patients' quality of life, leading to vomiting, abdominal discomfort, and hindering the digestion and absorption of nutrients. The condition can also complicate blood sugar regulation in diabetic cases. Several classes of drugs are employed in the treatment of gastroparesis, including prokinetic agents, antiemetics, and enteral nutrition supplements.

    Prokinetic agents, such as metoclopramide and domperidone, stimulate gastrointestinal motility, helping to move food through the stomach more efficiently. Antiemetics, like metopimazine and tradipitant, alleviate nausea and vomiting. Enteral nutrition supplements provide essential nutrients to patients experiencing feeding intolerance. The development of innovative drugs continues to expand the gastroparesis treatment landscape. For instance, Neurogastrx's proprietary technology, which utilizes electrical stimulation to improve gastric emptying, holds promise for patients with refractory gastroparesis. Gastroparesis can also arise as a complication following surgical procedures or in cases of autonomic neuropathy. In such instances, specialized care and interventions, including surgical procedures and lifestyle modifications, may be necessary for effective management.

    The gastroparesis market is influenced by several factors, including the prevalence of risk factors, such as diabetes and tobacco consumption, and the availability of effective treatment options. The regulatory landscape, including FDA clearance and clinical trials, also plays a significant role in shaping market dynamics. The condition can be exacerbated by various factors, including alcohol consumption and acute conditions like cholecystitis and pancreatitis. These complications can further hinder nutrient absorption and worsen symptoms. Pharmaceutical companies, including Ani Pharmaceuticals and Evoke Pharma, are actively involved in the development of new treatments for gastroparesis. Their efforts aim to address unmet medical needs and improve patient outcomes.

    In summary, the gastroparesis market comprises a diverse range of treatment options designed to manage the symptoms of this complex condition. The market is influenced by various factors, including patient demographics, regulatory landscape, and the availability of innovative treatments. Effective management of gastroparesis requires a multifaceted approach, incorporating pharmacological interventions, lifestyle modifications, and, in some cases, surgical procedures.

    Market Scope

    Report Coverage

    Details

    Page number

    198

    Base year

    2024

    Historic period

    2019-2023

    Forecast period

    2025-2029

    Growth momentum & CAGR

    Accelerate at a CAGR of 3.5%

    Market growth 2025-2029

    USD 1338.7 million

    Market structure

    Fragmented

    YoY growth 2024-2025(%)

    3.4

    Key countries

    US, China, Germany, UK, Canada, India, Japan, South Korea, France, and Italy

    Competitive landscape

    Leading Companies, Market Positioning of Companies, Competitive Strategies, and Industry Risks

    Request Free Sample

    What are the Key Data Covered in this Gastroparesis Drugs Market Research and Growth Report?

    • CAGR of the Gastroparesis Drugs industry during the forecast period
    • Detailed information on factors that will drive the growth and forecasting between 2025 and 2029
    • Precise estimation of the size of the market and its contribution of the industry in focus to the parent market
    • Accurate predictions about upcoming growth and trends and changes in consumer behaviour
    • Growth of the market across North America, Europe, Asia, and Rest of World (ROW)
    • Thorough analysis of the market’s competitive landscape and detailed information about companies
    • Comprehensive analysis of factors that will challenge the gastroparesis drugs market growth of industry companies

    We can help! Our analysts can customize this gastroparesis drugs market research report to meet your requirements.

    Get in touch


    1 Executive Summary

    • 1.1 Market overview
      • Executive Summary - Chart on Market Overview
      • Executive Summary - Data Table on Market Overview
      • Executive Summary - Chart on Global Market Characteristics
      • Executive Summary - Chart on Market by Geography
      • Executive Summary - Chart on Market Segmentation by Drug Class
      • Executive Summary - Chart on Market Segmentation by Disease Type
      • Executive Summary - Chart on Incremental Growth
      • Executive Summary - Data Table on Incremental Growth
      • Executive Summary - Chart on Company Market Positioning

    2 Technavio Analysis

    • 2.1 Analysis of price sensitivity, lifecycle, customer purchase basket, adoption rates, and purchase criteria
      • Analysis of price sensitivity, lifecycle, customer purchase basket, adoption rates, and purchase criteria
    • 2.2 Criticality of inputs and Factors of differentiation
      • Overview on criticality of inputs and factors of differentiation
    • 2.3 Factors of disruption
      • Overview on factors of disruption
    • 2.4 Impact of drivers and challenges
      • Impact of drivers and challenges in 2024 and 2029

    3 Market Landscape

    • 3.1 Market ecosystem
      • Parent Market
      • Data Table on - Parent Market
    • 3.2 Market characteristics
      • Market characteristics analysis
    • 3.3 Value chain analysis
      • Value chain analysis

    4 Market Sizing

    • 4.1 Market definition
      • Offerings of companies included in the market definition
    • 4.2 Market segment analysis
      • Market segments
    • 4.3 Market size 2024
      • 4.4 Market outlook: Forecast for 2024-2029
        • Chart on Global - Market size and forecast 2024-2029 ($ million)
        • Data Table on Global - Market size and forecast 2024-2029 ($ million)
        • Chart on Global Market: Year-over-year growth 2024-2029 (%)
        • Data Table on Global Market: Year-over-year growth 2024-2029 (%)

      5 Historic Market Size

      • 5.1 Global Gastroparesis Drugs Market 2019 - 2023
        • Historic Market Size - Data Table on Global Gastroparesis Drugs Market 2019 - 2023 ($ million)
      • 5.2 Drug Class segment analysis 2019 - 2023
        • Historic Market Size - Drug Class Segment 2019 - 2023 ($ million)
      • 5.3 Disease Type segment analysis 2019 - 2023
        • Historic Market Size - Disease Type Segment 2019 - 2023 ($ million)
      • 5.4 Geography segment analysis 2019 - 2023
        • Historic Market Size - Geography Segment 2019 - 2023 ($ million)
      • 5.5 Country segment analysis 2019 - 2023
        • Historic Market Size - Country Segment 2019 - 2023 ($ million)

      6 Qualitative Analysis

      • 6.1 Impact of AI in Global Gastroparesis Drugs Market

        7 Five Forces Analysis

        • 7.1 Five forces summary
          • Five forces analysis - Comparison between 2024 and 2029
        • 7.2 Bargaining power of buyers
          • Bargaining power of buyers - Impact of key factors 2024 and 2029
        • 7.3 Bargaining power of suppliers
          • Bargaining power of suppliers - Impact of key factors in 2024 and 2029
        • 7.4 Threat of new entrants
          • Threat of new entrants - Impact of key factors in 2024 and 2029
        • 7.5 Threat of substitutes
          • Threat of substitutes - Impact of key factors in 2024 and 2029
        • 7.6 Threat of rivalry
          • Threat of rivalry - Impact of key factors in 2024 and 2029
        • 7.7 Market condition
          • Chart on Market condition - Five forces 2024 and 2029

        8 Market Segmentation by Drug Class

        • 8.1 Market segments
          • Chart on Drug Class - Market share 2024-2029 (%)
          • Data Table on Drug Class - Market share 2024-2029 (%)
        • 8.2 Comparison by Drug Class
          • Chart on Comparison by Drug Class
          • Data Table on Comparison by Drug Class
        • 8.3 Prokinetic agents - Market size and forecast 2024-2029
          • Chart on Prokinetic agents - Market size and forecast 2024-2029 ($ million)
          • Data Table on Prokinetic agents - Market size and forecast 2024-2029 ($ million)
          • Chart on Prokinetic agents - Year-over-year growth 2024-2029 (%)
          • Data Table on Prokinetic agents - Year-over-year growth 2024-2029 (%)
        • 8.4 Antiemetics - Market size and forecast 2024-2029
          • Chart on Antiemetics - Market size and forecast 2024-2029 ($ million)
          • Data Table on Antiemetics - Market size and forecast 2024-2029 ($ million)
          • Chart on Antiemetics - Year-over-year growth 2024-2029 (%)
          • Data Table on Antiemetics - Year-over-year growth 2024-2029 (%)
        • 8.5 Botulinum toxin injection - Market size and forecast 2024-2029
          • Chart on Botulinum toxin injection - Market size and forecast 2024-2029 ($ million)
          • Data Table on Botulinum toxin injection - Market size and forecast 2024-2029 ($ million)
          • Chart on Botulinum toxin injection - Year-over-year growth 2024-2029 (%)
          • Data Table on Botulinum toxin injection - Year-over-year growth 2024-2029 (%)
        • 8.6 Market opportunity by Drug Class
          • Market opportunity by Drug Class ($ million)
          • Data Table on Market opportunity by Drug Class ($ million)

        9 Market Segmentation by Disease Type

        • 9.1 Market segments
          • Chart on Disease Type - Market share 2024-2029 (%)
          • Data Table on Disease Type - Market share 2024-2029 (%)
        • 9.2 Comparison by Disease Type
          • Chart on Comparison by Disease Type
          • Data Table on Comparison by Disease Type
        • 9.3 Idiopathic gastroparesis - Market size and forecast 2024-2029
          • Chart on Idiopathic gastroparesis - Market size and forecast 2024-2029 ($ million)
          • Data Table on Idiopathic gastroparesis - Market size and forecast 2024-2029 ($ million)
          • Chart on Idiopathic gastroparesis - Year-over-year growth 2024-2029 (%)
          • Data Table on Idiopathic gastroparesis - Year-over-year growth 2024-2029 (%)
        • 9.4 Diabetic gastroparesis - Market size and forecast 2024-2029
          • Chart on Diabetic gastroparesis - Market size and forecast 2024-2029 ($ million)
          • Data Table on Diabetic gastroparesis - Market size and forecast 2024-2029 ($ million)
          • Chart on Diabetic gastroparesis - Year-over-year growth 2024-2029 (%)
          • Data Table on Diabetic gastroparesis - Year-over-year growth 2024-2029 (%)
        • 9.5 Post-surgical gastroparesis - Market size and forecast 2024-2029
          • Chart on Post-surgical gastroparesis - Market size and forecast 2024-2029 ($ million)
          • Data Table on Post-surgical gastroparesis - Market size and forecast 2024-2029 ($ million)
          • Chart on Post-surgical gastroparesis - Year-over-year growth 2024-2029 (%)
          • Data Table on Post-surgical gastroparesis - Year-over-year growth 2024-2029 (%)
        • 9.6 Market opportunity by Disease Type
          • Market opportunity by Disease Type ($ million)
          • Data Table on Market opportunity by Disease Type ($ million)

        10 Market Segmentation by Drug

        • 10.1 Market segments
          • Chart on Drug - Market share (2024-2029) (%)
          • Data Table on Drug - Market share (2024-2029) (%)
        • 10.2 Comparison by Drug
          • Chart on Comparison by Drug
          • Data Table on Comparison by Drug
        • 10.3 Aminosalicylates - Market size and forecast (2024-2029)
          • Chart on Aminosalicylates - Market size and forecast (2024-2029) ($ million)
          • Data Table on Aminosalicylates - Market size and forecast (2024-2029) ($ million)
          • Chart on Aminosalicylates - Year-over-year growth (2024-2029) (%)
          • Data Table on Aminosalicylates - Year-over-year growth (2024-2029) (%)
        • 10.4 Digestive enzymes - Market size and forecast (2024-2029)
          • Chart on Digestive enzymes - Market size and forecast (2024-2029) ($ million)
          • Data Table on Digestive enzymes - Market size and forecast (2024-2029) ($ million)
          • Chart on Digestive enzymes - Year-over-year growth (2024-2029) (%)
          • Data Table on Digestive enzymes - Year-over-year growth (2024-2029) (%)
        • 10.5 Proton Pump Inhibitors - Market size and forecast (2024-2029)
          • Chart on Proton Pump Inhibitors - Market size and forecast (2024-2029) ($ million)
          • Data Table on Proton Pump Inhibitors - Market size and forecast (2024-2029) ($ million)
          • Chart on Proton Pump Inhibitors - Year-over-year growth (2024-2029) (%)
          • Data Table on Proton Pump Inhibitors - Year-over-year growth (2024-2029) (%)
        • 10.6 Laxatives - Market size and forecast (2024-2029)
          • Chart on Laxatives - Market size and forecast (2024-2029) ($ million)
          • Data Table on Laxatives - Market size and forecast (2024-2029) ($ million)
          • Chart on Laxatives - Year-over-year growth (2024-2029) (%)
          • Data Table on Laxatives - Year-over-year growth (2024-2029) (%)
        • 10.7 - Market size and forecast (2024-2029)
          • Chart on - Market size and forecast (2024-2029) ($ million)
          • Data Table on - Market size and forecast (2024-2029) ($ million)
          • Chart on - Year-over-year growth (2024-2029) (%)
          • Data Table on - Year-over-year growth (2024-2029) (%)
        • 10.8 Anti-Emetics - Market size and forecast (2024-2029)
          • Chart on Anti-Emetics - Market size and forecast (2024-2029) ($ million)
          • Data Table on Anti-Emetics - Market size and forecast (2024-2029) ($ million)
          • Chart on Anti-Emetics - Year-over-year growth (2024-2029) (%)
          • Data Table on Anti-Emetics - Year-over-year growth (2024-2029) (%)
        • 10.9 Market opportunity by Drug
          • Market opportunity by $segment_name ($ million)
          • Data Table on Market opportunity by $segment_name ($ million)

        11 Market Segmentation by Route of Administration

        • 11.1 Market segments
          • Chart on Route of Administration - Market share (2024-2029) (%)
          • Data Table on Route of Administration - Market share (2024-2029) (%)
        • 11.2 Comparison by Route of Administration
          • Chart on Comparison by Route of Administration
          • Data Table on Comparison by Route of Administration
        • 11.3 Oral - Market size and forecast (2024-2029)
          • Chart on Oral - Market size and forecast (2024-2029) ($ million)
          • Data Table on Oral - Market size and forecast (2024-2029) ($ million)
          • Chart on Oral - Year-over-year growth (2024-2029) (%)
          • Data Table on Oral - Year-over-year growth (2024-2029) (%)
        • 11.4 Injectable - Market size and forecast (2024-2029)
          • Chart on Injectable - Market size and forecast (2024-2029) ($ million)
          • Data Table on Injectable - Market size and forecast (2024-2029) ($ million)
          • Chart on Injectable - Year-over-year growth (2024-2029) (%)
          • Data Table on Injectable - Year-over-year growth (2024-2029) (%)
        • 11.5 Others - Market size and forecast (2024-2029)
          • Chart on Others - Market size and forecast (2024-2029) ($ million)
          • Data Table on Others - Market size and forecast (2024-2029) ($ million)
          • Chart on Others - Year-over-year growth (2024-2029) (%)
          • Data Table on Others - Year-over-year growth (2024-2029) (%)
        • 11.6 Market opportunity by Route of Administration
          • Market opportunity by $segment_name ($ million)
          • Data Table on Market opportunity by $segment_name ($ million)

        12 Customer Landscape

        • 12.1 Customer landscape overview
          • Analysis of price sensitivity, lifecycle, customer purchase basket, adoption rates, and purchase criteria

        13 Geographic Landscape

        • 13.1 Geographic segmentation
          • Chart on Market share by geography 2024-2029 (%)
          • Data Table on Market share by geography 2024-2029 (%)
        • 13.2 Geographic comparison
          • Chart on Geographic comparison
          • Data Table on Geographic comparison
        • 13.3 North America - Market size and forecast 2024-2029
          • Chart on North America - Market size and forecast 2024-2029 ($ million)
          • Data Table on North America - Market size and forecast 2024-2029 ($ million)
          • Chart on North America - Year-over-year growth 2024-2029 (%)
          • Data Table on North America - Year-over-year growth 2024-2029 (%)
        • 13.4 Europe - Market size and forecast 2024-2029
          • Chart on Europe - Market size and forecast 2024-2029 ($ million)
          • Data Table on Europe - Market size and forecast 2024-2029 ($ million)
          • Chart on Europe - Year-over-year growth 2024-2029 (%)
          • Data Table on Europe - Year-over-year growth 2024-2029 (%)
        • 13.5 Asia - Market size and forecast 2024-2029
          • Chart on Asia - Market size and forecast 2024-2029 ($ million)
          • Data Table on Asia - Market size and forecast 2024-2029 ($ million)
          • Chart on Asia - Year-over-year growth 2024-2029 (%)
          • Data Table on Asia - Year-over-year growth 2024-2029 (%)
        • 13.6 Rest of World (ROW) - Market size and forecast 2024-2029
          • Chart on Rest of World (ROW) - Market size and forecast 2024-2029 ($ million)
          • Data Table on Rest of World (ROW) - Market size and forecast 2024-2029 ($ million)
          • Chart on Rest of World (ROW) - Year-over-year growth 2024-2029 (%)
          • Data Table on Rest of World (ROW) - Year-over-year growth 2024-2029 (%)
        • 13.7 US - Market size and forecast 2024-2029
          • Chart on US - Market size and forecast 2024-2029 ($ million)
          • Data Table on US - Market size and forecast 2024-2029 ($ million)
          • Chart on US - Year-over-year growth 2024-2029 (%)
          • Data Table on US - Year-over-year growth 2024-2029 (%)
        • 13.8 China - Market size and forecast 2024-2029
          • Chart on China - Market size and forecast 2024-2029 ($ million)
          • Data Table on China - Market size and forecast 2024-2029 ($ million)
          • Chart on China - Year-over-year growth 2024-2029 (%)
          • Data Table on China - Year-over-year growth 2024-2029 (%)
        • 13.9 Germany - Market size and forecast 2024-2029
          • Chart on Germany - Market size and forecast 2024-2029 ($ million)
          • Data Table on Germany - Market size and forecast 2024-2029 ($ million)
          • Chart on Germany - Year-over-year growth 2024-2029 (%)
          • Data Table on Germany - Year-over-year growth 2024-2029 (%)
        • 13.10 UK - Market size and forecast 2024-2029
          • Chart on UK - Market size and forecast 2024-2029 ($ million)
          • Data Table on UK - Market size and forecast 2024-2029 ($ million)
          • Chart on UK - Year-over-year growth 2024-2029 (%)
          • Data Table on UK - Year-over-year growth 2024-2029 (%)
        • 13.11 Canada - Market size and forecast 2024-2029
          • Chart on Canada - Market size and forecast 2024-2029 ($ million)
          • Data Table on Canada - Market size and forecast 2024-2029 ($ million)
          • Chart on Canada - Year-over-year growth 2024-2029 (%)
          • Data Table on Canada - Year-over-year growth 2024-2029 (%)
        • 13.12 India - Market size and forecast 2024-2029
          • Chart on India - Market size and forecast 2024-2029 ($ million)
          • Data Table on India - Market size and forecast 2024-2029 ($ million)
          • Chart on India - Year-over-year growth 2024-2029 (%)
          • Data Table on India - Year-over-year growth 2024-2029 (%)
        • 13.13 Japan - Market size and forecast 2024-2029
          • Chart on Japan - Market size and forecast 2024-2029 ($ million)
          • Data Table on Japan - Market size and forecast 2024-2029 ($ million)
          • Chart on Japan - Year-over-year growth 2024-2029 (%)
          • Data Table on Japan - Year-over-year growth 2024-2029 (%)
        • 13.14 South Korea - Market size and forecast 2024-2029
          • Chart on South Korea - Market size and forecast 2024-2029 ($ million)
          • Data Table on South Korea - Market size and forecast 2024-2029 ($ million)
          • Chart on South Korea - Year-over-year growth 2024-2029 (%)
          • Data Table on South Korea - Year-over-year growth 2024-2029 (%)
        • 13.15 France - Market size and forecast 2024-2029
          • Chart on France - Market size and forecast 2024-2029 ($ million)
          • Data Table on France - Market size and forecast 2024-2029 ($ million)
          • Chart on France - Year-over-year growth 2024-2029 (%)
          • Data Table on France - Year-over-year growth 2024-2029 (%)
        • 13.16 Italy - Market size and forecast 2024-2029
          • Chart on Italy - Market size and forecast 2024-2029 ($ million)
          • Data Table on Italy - Market size and forecast 2024-2029 ($ million)
          • Chart on Italy - Year-over-year growth 2024-2029 (%)
          • Data Table on Italy - Year-over-year growth 2024-2029 (%)
        • 13.17 Market opportunity by geography
          • Market opportunity by geography ($ million)
          • Data Tables on Market opportunity by geography ($ million)

        14 Drivers, Challenges, and Opportunity/Restraints

        • 14.1 Market drivers
          • 14.2 Market challenges
            • 14.3 Impact of drivers and challenges
              • Impact of drivers and challenges in 2024 and 2029
            • 14.4 Market opportunities/restraints

              15 Competitive Landscape

              • 15.1 Overview
                • 15.2 Competitive Landscape
                  • Overview on criticality of inputs and factors of differentiation
                • 15.3 Landscape disruption
                  • Overview on factors of disruption
                • 15.4 Industry risks
                  • Impact of key risks on business

                16 Competitive Analysis

                • 16.1 Companies profiled
                  • Companies covered
                • 16.2 Company ranking index
                  • Company ranking index
                • 16.3 Market positioning of companies
                  • Matrix on companies position and classification
                • 16.4 Abbott Laboratories
                  • Abbott Laboratories - Overview
                  • Abbott Laboratories - Business segments
                  • Abbott Laboratories - Key news
                  • Abbott Laboratories - Key offerings
                  • Abbott Laboratories - Segment focus
                  • SWOT
                • 16.5 AbbVie Inc.
                  • AbbVie Inc. - Overview
                  • AbbVie Inc. - Product / Service
                  • AbbVie Inc. - Key news
                  • AbbVie Inc. - Key offerings
                  • SWOT
                • 16.6 ANI Pharmaceuticals Inc.
                  • ANI Pharmaceuticals Inc. - Overview
                  • ANI Pharmaceuticals Inc. - Product / Service
                  • ANI Pharmaceuticals Inc. - Key offerings
                  • SWOT
                • 16.7 Bausch Health Companies Inc.
                  • Bausch Health Companies Inc. - Overview
                  • Bausch Health Companies Inc. - Business segments
                  • Bausch Health Companies Inc. - Key news
                  • Bausch Health Companies Inc. - Key offerings
                  • Bausch Health Companies Inc. - Segment focus
                  • SWOT
                • 16.8 Cadila Pharmaceuticals Ltd.
                  • Cadila Pharmaceuticals Ltd. - Overview
                  • Cadila Pharmaceuticals Ltd. - Product / Service
                  • Cadila Pharmaceuticals Ltd. - Key offerings
                  • SWOT
                • 16.9 Eisai Co. Ltd.
                  • Eisai Co. Ltd. - Overview
                  • Eisai Co. Ltd. - Business segments
                  • Eisai Co. Ltd. - Key offerings
                  • Eisai Co. Ltd. - Segment focus
                  • SWOT
                • 16.10 Evoke Pharma Inc.
                  • Evoke Pharma Inc. - Overview
                  • Evoke Pharma Inc. - Product / Service
                  • Evoke Pharma Inc. - Key offerings
                  • SWOT
                • 16.11 GlaxoSmithKline Plc
                  • GlaxoSmithKline Plc - Overview
                  • GlaxoSmithKline Plc - Business segments
                  • GlaxoSmithKline Plc - Key news
                  • GlaxoSmithKline Plc - Key offerings
                  • GlaxoSmithKline Plc - Segment focus
                  • SWOT
                • 16.12 Ipca Laboratories
                  • Ipca Laboratories - Overview
                  • Ipca Laboratories - Product / Service
                  • Ipca Laboratories - Key offerings
                  • SWOT
                • 16.13 Medtronic Plc
                  • Medtronic Plc - Overview
                  • Medtronic Plc - Business segments
                  • Medtronic Plc - Key news
                  • Medtronic Plc - Key offerings
                  • Medtronic Plc - Segment focus
                  • SWOT
                • 16.14 Otsuka Pharmaceutical Co. Ltd.
                  • Otsuka Pharmaceutical Co. Ltd. - Overview
                  • Otsuka Pharmaceutical Co. Ltd. - Product / Service
                  • Otsuka Pharmaceutical Co. Ltd. - Key offerings
                  • SWOT
                • 16.15 Pfizer Inc.
                  • Pfizer Inc. - Overview
                  • Pfizer Inc. - Product / Service
                  • Pfizer Inc. - Key news
                  • Pfizer Inc. - Key offerings
                  • SWOT
                • 16.16 Processa Pharmaceuticals Inc.
                  • Processa Pharmaceuticals Inc. - Overview
                  • Processa Pharmaceuticals Inc. - Product / Service
                  • Processa Pharmaceuticals Inc. - Key offerings
                  • SWOT
                • 16.17 Takeda Pharmaceutical Co. Ltd.
                  • Takeda Pharmaceutical Co. Ltd. - Overview
                  • Takeda Pharmaceutical Co. Ltd. - Product / Service
                  • Takeda Pharmaceutical Co. Ltd. - Key news
                  • Takeda Pharmaceutical Co. Ltd. - Key offerings
                  • SWOT
                • 16.18 Vanda Pharmaceuticals Inc.
                  • Vanda Pharmaceuticals Inc. - Overview
                  • Vanda Pharmaceuticals Inc. - Product / Service
                  • Vanda Pharmaceuticals Inc. - Key offerings
                  • SWOT

                17 Appendix

                • 17.1 Scope of the report
                  • 17.2 Inclusions and exclusions checklist
                    • Inclusions checklist
                    • Exclusions checklist
                  • 17.3 Currency conversion rates for US$
                    • Currency conversion rates for US$
                  • 17.4 Research methodology
                    • Research methodology
                  • 17.5 Data procurement
                    • Information sources
                  • 17.6 Data validation
                    • Data validation
                  • 17.7 Validation techniques employed for market sizing
                    • Validation techniques employed for market sizing
                  • 17.8 Data synthesis
                    • Data synthesis
                  • 17.9 360 degree market analysis
                    • 360 degree market analysis
                  • 17.10 List of abbreviations
                    • List of abbreviations

                  Research Methodology

                  Technavio presents a detailed picture of the market by way of study, synthesis, and summation of data from multiple sources. The analysts have presented the various facets of the market with a particular focus on identifying the key industry influencers. The data thus presented is comprehensive, reliable, and the result of extensive research, both primary and secondary.

                  INFORMATION SOURCES

                  Primary sources

                  • Manufacturers and suppliers
                  • Channel partners
                  • Industry experts
                  • Strategic decision makers

                  Secondary sources

                  • Industry journals and periodicals
                  • Government data
                  • Financial reports of key industry players
                  • Historical data
                  • Press releases

                  DATA ANALYSIS

                  Data Synthesis

                  • Collation of data
                  • Estimation of key figures
                  • Analysis of derived insights

                  Data Validation

                  • Triangulation with data models
                  • Reference against proprietary databases
                  • Corroboration with industry experts

                  REPORT WRITING

                  Qualitative

                  • Market drivers
                  • Market challenges
                  • Market trends
                  • Five forces analysis

                  Quantitative

                  • Market size and forecast
                  • Market segmentation
                  • Geographical insights
                  • Competitive landscape

                  Interested in this report?

                  Get your sample now to see our research methodology and insights!

                  Download Now

                  Frequently Asked Questions

                  Gastroparesis Drugs market growth will increase by $ 1338.7 mn during 2025-2029 .

                  The Gastroparesis Drugs market is expected to grow at a CAGR of 3.5% during 2025-2029 .

                  Gastroparesis Drugs market is segmented by Drug Class( Prokinetic agents, Antiemetics, Botulinum toxin injection) Disease Type( Idiopathic gastroparesis, Diabetic gastroparesis, Post-surgical gastroparesis)

                  Abbott Laboratories, AbbVie Inc., Aclipse Therapeutics, ANI Pharmaceuticals Inc., Bausch Health Companies Inc., Cadila Pharmaceuticals Ltd., Eisai Co. Ltd., Evoke Pharma Inc., GlaxoSmithKline Plc, Ipca Laboratories, Johnson and Johnson Inc., Medtronic Plc, Neurogastrx Inc., Otsuka Pharmaceutical Co. Ltd., Pfizer Inc., Processa Pharmaceuticals Inc., Rhythm Pharmaceuticals Inc., Takeda Pharmaceutical Co. Ltd., Theravance Biopharma Inc., Vanda Pharmaceuticals Inc. are a few of the key vendors in the Gastroparesis Drugs market.

                  North America will register the highest growth rate of 42% among the other regions. Therefore, the Gastroparesis Drugs market in North America is expected to garner significant business opportunities for the vendors during the forecast period.

                  US, China, Germany, UK, Canada, India, Japan, South Korea, France, Italy

                  • Rising global burden of diabetesDiabetes is a chronic disease where the body cannot use insulin effectively or the pancreas produces insufficient insulin. Hyperglycemia or increased blood sugar can result in severe damage to key organs in the body or complications is the driving factor this market.
                  • which may become life-threatening to the individual if left untreated. The global burden of diabetes is rising at a rapid pace. In 2021 is the driving factor this market.
                  • approximately 537 million adults aged 20-79 years had diabetes. The total number of people living with diabetes is projected to rise to 643 million by 2030 and 783 million by 2045. The growing prevalence of Type 1 and Type 2 diabetes increases the chances of gastroparesis significantly. Diabetes can harm neurons is the driving factor this market.
                  • including the vagus nerve is the driving factor this market.
                  • as well as unique cells in the stomach wall known as pacemaker cells. The vagus nerve controls the muscles in the small intestine and stomach is the driving factor this market.
                  • and these muscles do not function normally if the vagus nerve is damaged or dies due to diabetes. If this happens is the driving factor this market.
                  • food travels through the digestive system more slowly or cannot pass through the digestive system is the driving factor this market.
                  • which causes paralysis of the stomach (gastroparesis). The factors contributing to the increase in the population diagnosed with diabetes include obesity is the driving factor this market.
                  • smoking is the driving factor this market.
                  • a sedentary lifestyle is the driving factor this market.
                  • and growing urbanization. Furthermore is the driving factor this market.
                  • the incidence of diabetes is higher in the older population. Hence is the driving factor this market.
                  • the increase in the number of people with diabetes globally will add to the burden of gastroparesis and will drive the growth of the market in focus during the forecast period.  is the driving factor this market.

                  The Gastroparesis Drugs market vendors should focus on grabbing business opportunities from the Prokinetic agents segment as it accounted for the largest market share in the base year.