
Gene Therapy Market Size 2024-2028
The gene therapy market size is forecast to increase by USD 6.74 billion, at a CAGR of 23.31% between 2023 and 2028.
- The market is experiencing significant growth, driven by the increasing number of special drug designations granted to gene therapy products. This trend signifies regulatory approval and validation of gene therapy as a viable treatment modality, encouraging further investment and innovation. Another key driver is the expanding research in gene therapy applications for cardiovascular diseases (CVDs) and orphan diseases, which hold immense potential for addressing unmet medical needs and improving patient outcomes. Its applications span diverse fields, including ophthalmology in Japan, where vision-restoring treatments are gaining traction, and infectious disease research in Asia, addressing global health challenges.
- Companies must navigate this obstacle by exploring cost reduction strategies, collaborating with payers and insurers, and demonstrating the long-term value of these therapies to secure reimbursement and patient access. Effective management of these challenges, alongside continued innovation and regulatory support, will enable market players to capitalize on the promising opportunities in the market.
What will be the Size of the Gene Therapy Market during the forecast period?

Explore in-depth regional segment analysis with market size data - historical 2018-2022 and forecasts 2024-2028 - in the full report.
Request Free Sample
The market continues to evolve, driven by advancements in various sectors. Gene replacement therapies, utilizing viral vectors to deliver functional genes, are gaining traction in the treatment of genetic disorders. Gene silencing, a modality that manipulates the expression of mutated genes, is also making strides in healthcare, particularly for chronic conditions. The therapeutic areas spanning from neurology indications to orphan diseases are witnessing significant progress. Gene therapy's mechanism of action, which can include gene augmentation, molecular carriers, and advanced targeted therapies, is revolutionizing precision medicine. Startup companies and biotechnology firms are spearheading innovation, developing delivery systems and preclinical testing for gene therapy products.
Regulatory approval processes, including drug designations and patent portfolio strength, are adapting to accommodate these emerging technologies. Advanced technologies, such as hybrid vector systems and non-viral vectors, are extending the shelf life and commercialization strategies of gene therapy products. Big pharma players are increasingly investing in gene editing therapies, further fueling market growth. Clinical research initiatives, including clinical trials and investment funding, are paving the way for the development of new gene therapy products. Gene therapy's role in cancer treatment and genome sequencing is also expanding, reflecting the vast potential of this dynamic field. The regulatory landscape is evolving to accommodate these medical advancements, with regulatory approval processes becoming more streamlined.
Temperature control and route of administration are crucial considerations in the development of gene therapy products. In the genomics field, gene therapy is playing a pivotal role in the manipulation of genes and biological therapies, leading to therapeutic innovation and improved patient outcomes. The market is a continually unfolding landscape, with ongoing research and development initiatives shaping its future.
How is this Gene Therapy Industry segmented?
The gene therapy industry research report provides comprehensive data (region-wise segment analysis), with forecasts and estimates in "USD million" for the period 2024-2028, as well as historical data from 2018-2022 for the following segments.
- Delivery Mode
- In vivo
- Ex vivo
- Therapy Area
- Oncology
- CNS
- Ophthalmology
- Rare diseases
- Others
- Vector Type
- Viral Vectors
- Non-viral Vectors
- Indication
- Genetic Disorders
- Cancer
- Infectious Diseases
- Application
- Oncology
- Orphan Diseases
- Neurological Disorders
- Cardiovascular Diseases
- Infectious Diseases
- Hematological Disorders
- Geography
- North America
- US
- Canada
- Europe
- France
- Germany
- Italy
- UK
- Middle East and Africa
- Egypt
- KSA
- Oman
- UAE
- APAC
- China
- India
- Japan
- South America
- Argentina
- Brazil
- Rest of World (ROW)
- North America
By Delivery Mode Insights
The in vivo segment is estimated to witness significant growth during the forecast period.
In the realm of medical innovation, in vivo gene therapy represents a groundbreaking technique that delivers genetic material directly into target cells to effect therapeutic change. This approach, which employs various vectors to transfer functional genes into cells, has gained significant traction in numerous scientific fields. Approved gene therapies now incorporate this method to address faulty or absent genes, such as those linked to rare diseases or chronic conditions. The market is marked by continuous advancements in gene delivery techniques, including viral vectors and non-viral carriers. The regulatory landscape is evolving to accommodate these advanced therapies, with regulatory approvals paving the way for commercialization.
Big pharma players and biotechnology firms are investing heavily in gene therapy research, particularly in neurology indications and oncolytic viral therapy. In the genomic field, precision medicine and gene editing modalities are driving innovation, with emerging technologies like CRISPR-Cas9 and RNA interference (RNAi) gaining significant attention. Startup companies and academic institutions are also contributing to the clinical pipeline through preclinical testing and clinical research initiatives. Gene therapy products, including gene augmentation, gene replacement, and cell replacement therapies, are showing promising treatment efficacy for various therapeutic areas, such as genetic disorders and orphan diseases. The market is further enriched by advanced targeted therapies and molecular switches, which offer personalized treatment options.
As the market continues to evolve, temperature control, shelf life, and commercialization strategies become increasingly important considerations. Biological therapies and gene editing therapies, including hybrid vector systems and vector selection, are also key factors influencing patient outcomes and capital investments. In conclusion, in vivo gene therapy is a dynamic and evolving field that holds immense potential for transforming the lives of patients suffering from a range of diseases and disorders. With continued advancements in gene delivery methods, regulatory approval, and scientific understanding, this innovative approach to medicine is poised to make a significant impact on healthcare and the lives of those in need.
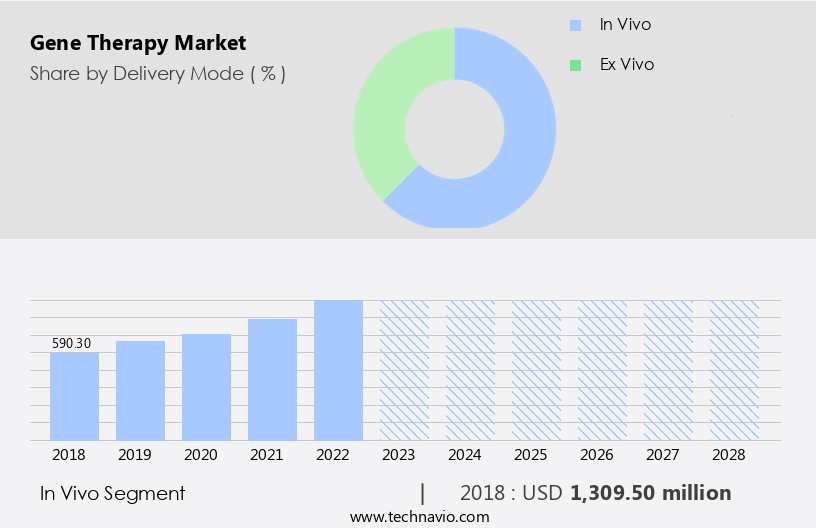
The In vivo segment was valued at USD 1.31 billion in 2018 and showed a gradual increase during the forecast period.
Regional Analysis
North America is estimated to contribute 40% to the growth of the global market during the forecast period.Technavio's analysts have elaborately explained the regional trends and drivers that shape the market during the forecast period.
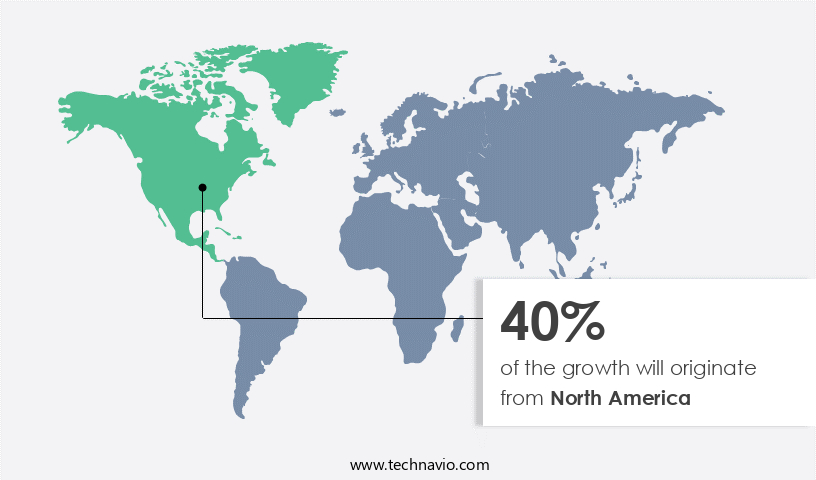
The market is experiencing significant growth, particularly in North America, driven by substantial research and development investments, especially in the US. With hundreds of clinical trials underway in the region, primarily focusing on cancer, HIV/AIDS, and cardiovascular diseases, the market holds immense potential. The prevalence of these conditions, such as the high incidence of various types of cancers, has led to a substantial demand for innovative treatments. Gene therapy, which includes gene silencing, gene replacement, gene augmentation, and gene editing modalities, is a promising area of medical advancement. Biotechnology firms and big pharma players are investing heavily in gene therapy products, leveraging advanced technologies like viral vectors, molecular carriers, and hybrid vector systems.
The regulatory landscape is evolving, with regulatory approvals for gene therapies increasing, enabling commercialization strategies for these innovative treatments. The market encompasses various therapeutic areas, including neurology indications and genetic disorders, and offers potential for cell replacement, precision medicine, and advanced targeted therapies. The market's success relies on preclinical testing, clinical studies, and investment funding to bring these therapies to market. Gene therapy products, such as gene editing therapies and marketed gene therapies, are expected to significantly impact patient outcomes, particularly in chronic conditions. Temperature control and shelf life are critical considerations for these biological therapies.
The market is a dynamic and evolving landscape, with emerging technologies, such as molecular switches and non-viral vectors, poised to make a significant impact.
Market Dynamics
Our researchers analyzed the data with 2023 as the base year, along with the key drivers, trends, and challenges. A holistic analysis of drivers will help companies refine their marketing strategies to gain a competitive advantage.
The Gene Therapy Market is advancing rapidly, with viral vector gene therapies, CAR-T cell therapies, and CRISPR-based therapies revolutionizing healthcare. AAV-based gene therapies target cancer treatment and rare disease treatment, leveraging CRISPR-Cas9 gene editing and lipid nanoparticles for precision. Personalized gene therapies address individual needs, driving growth in the oncology gene therapy market. High-demand searches like best gene therapy for cancer treatment 2025, top CRISPR-based therapies for rare diseases, and best AAV-based gene therapies for neurological disorders reflect patient interest. How to access affordable gene therapies, gene therapy for spinal muscular atrophy benefits, and top CAR-T cell therapies for leukemia guide choices. Non-viral gene therapies for cardiovascular diseases, best gene therapy clinics in USA 2025, how to choose safe gene therapy treatments, and advances in CRISPR-Cas9 gene editing 2025 shape the market's future.
What are the key market drivers leading to the rise in the adoption of Gene Therapy Industry?
- The significant growth in the number of special drug designations is the primary factor fueling market expansion. This designation process, overseen by regulatory authorities, acknowledges a drug's ability to address unmet medical needs, thereby increasing its market potential.
- Gene therapy, a revolutionary approach in healthcare, is gaining significant traction in the treatment of rare diseases and chronic conditions. This field, driven by advancements in gene silencing technologies, precision medicine, and manipulation technologies, is transforming the way we approach disease indications. Regulatory bodies, including the US Food and Drug Administration (FDA) and the European Medicines Agency (EMA), have granted numerous designations, such as orphan drug designation, fast track designation, and breakthrough designation, to gene therapy programs. These designations offer pharmaceutical companies ten years of market exclusivity, tax benefits, and expedited regulatory approval processes. The clinical pipeline in the market is robust, with a focus on disease areas like metachromatic leukodystrophy and oncolytic viral therapy.
- The patent portfolio strength in the genomics field is another factor fueling the growth of this market. The regulatory landscape is evolving to accommodate the unique challenges of gene therapy, with a focus on safety and efficacy. The route of administration for gene therapy is diverse, ranging from viral vectors to direct injection, offering flexibility in treatment options. Clinical research initiatives continue to drive innovation in gene therapy, with the potential to revolutionize healthcare costs and improve patient outcomes.
What are the market trends shaping the Gene Therapy Industry?
- The emerging field of gene therapy is gaining significant attention in the medical community for its potential applications in cardiovascular diseases and orphan conditions. Growing research and development efforts in this area represent the latest market trends.
- Gene therapy, a form of molecular medicine, has gained significant attention in the healthcare industry due to its potential to treat various genetic disorders and diseases. This advanced therapeutic approach involves the use of viral vectors to deliver healthy genes into cells, enabling gene replacement or gene augmentation. The therapeutic areas for gene therapy span across numerous conditions, including neurology indications, oncology, and orphan diseases. The mechanism of action for gene therapy is based on the introduction of functional genes into target cells, thereby restoring or enhancing the production of missing or defective proteins. The development of innovative gene therapy treatments is driven by the need for more effective and targeted therapies, particularly in areas where traditional treatments have limitations.
- Startup companies and advanced technology players are at the forefront of gene therapy research and development, focusing on the creation of novel delivery systems and gene editing modalities. Preclinical testing plays a crucial role in evaluating the safety and efficacy of these treatments before they can progress to clinical trials. Biological therapies, including gene therapy, are increasingly becoming essential components of the pharmaceutical industry's portfolio, with big pharma players investing heavily in research and development. The emphasis on gene therapy lies in its potential to offer long-term solutions for various diseases, including those with high unmet medical needs.
- Advanced targeted therapies, such as gene therapy, are expected to revolutionize the treatment landscape by providing more personalized and precise interventions. Emerging technologies, including gene editing modalities, are also poised to expand the scope of gene therapy applications. In conclusion, the market is experiencing significant growth due to the increasing prevalence of genetic disorders and diseases, the urgency to develop more effective treatments, and the advancements in technology. The potential of gene therapy to offer targeted, long-term solutions makes it a promising area for investment and innovation.
What challenges does the Gene Therapy Industry face during its growth?
- The high cost of treatment is a significant challenge impeding the growth of the industry.
- Gene therapy, a revolutionary approach to treating genetic disorders, involves introducing functional genes into a patient's cells to replace or supplement defective genes. This innovative treatment modality holds significant promise in addressing various genetic conditions. However, the market for gene therapy faces several challenges, including the high cost of manufacturing and clinical trials. The cost of gene therapies ranges from USD300,000 to USD1,200,000, primarily due to the need for personalized treatment and intensive clinical studies. Gene therapy's delivery platforms vary, with viral vectors being the most common method. These vectors, such as adeno-associated viruses (AAV), are used to introduce the modified gene into the patient's cells.
- Temperature control during storage and transportation is crucial to ensure the shelf life and efficacy of gene therapies. Biotechnology firms are investing heavily in gene editing therapies, with a focus on target therapeutic areas like genetic disorders, cancer, and inherited diseases. Clinical studies are underway to evaluate the safety and efficacy of these therapies, with regulatory approval being a significant hurdle. Gene therapy's molecular switches and gene modification techniques offer immense potential in treating various conditions. Cell replacement therapy is another area where gene therapy shows promise. Despite the challenges, the market continues to grow, driven by advancements in genomic research and gene modification technologies.
Exclusive Customer Landscape
The gene therapy market forecasting report includes the adoption lifecycle of the market, covering from the innovator's stage to the laggard's stage. It focuses on adoption rates in different regions based on penetration. Furthermore, the gene therapy market report also includes key purchase criteria and drivers of price sensitivity to help companies evaluate and develop their market growth analysis strategies.

Customer Landscape
Key Companies & Market Insights
Companies are implementing various strategies, such as strategic alliances, gene therapy market forecast, partnerships, mergers and acquisitions, geographical expansion, and product/service launches, to enhance their presence in the industry.
Astellas Pharma Inc. - The company specializes in gene therapy innovations, including the Phase 3 VIITAL Clinical Trial of EB 101. This advanced therapeutic approach harnesses the power of genes to address various health conditions. EB 101, a specific gene therapy solution under development, is currently in the late-stage clinical trial phase. This trial signifies a significant step forward in the scientific community's pursuit of effective, gene-based treatments. The company's commitment to research and development drives its mission to transform lives through groundbreaking gene therapies.
The industry research and growth report includes detailed analyses of the competitive landscape of the market and information about key companies, including:
- Astellas Pharma Inc.
- bluebird bio, Inc.
- CRISPR Therapeutics AG
- Gilead Sciences, Inc.
- Kite Pharma (Gilead Sciences)
- Novartis AG
- Orchard Therapeutics plc
- Pfizer Inc.
- RegenXBio Inc.
- Roche Holding AG
- Sarepta Therapeutics, Inc.
- Spark Therapeutics (Roche)
- uniQure N.V.
- Voyager Therapeutics, Inc.
- VBL Therapeutics
- Vertex Pharmaceuticals Incorporated
- Xencor, Inc.
- Sangamo Therapeutics, Inc.
- Amgen Inc.
- Biogen Inc.
Qualitative and quantitative analysis of companies has been conducted to help clients understand the wider business environment as well as the strengths and weaknesses of key industry players. Data is qualitatively analyzed to categorize companies as pure play, category-focused, industry-focused, and diversified; it is quantitatively analyzed to categorize companies as dominant, leading, strong, tentative, and weak.
Recent Development and News in Gene Therapy Market
- In January 2024, Spark Therapeutics, a leading gene therapy company, announced the US Food and Drug Administration (FDA) approval of its gene therapy, Zynteglo, for the treatment of transfusion-dependent ?-thalassemia. This marked the third gene therapy approval for the company and further solidified its position in the market (Spark Therapeutics, 2024).
- In March 2024, Merck KGaA and CRISPR Therapeutics entered into a strategic collaboration to develop and commercialize CRISPR-based gene-editing therapies. This partnership combined Merck's commercial capabilities with CRISPR's gene-editing technology, aiming to bring innovative treatments to patients (Merck KGaA, 2024).
- In April 2025, Editas Medicine raised USD150 million in a Series C funding round, led by new investor OrbiMed. The funds will support the development of the company's gene editing platform and its pipeline of potential gene therapy treatments (Editas Medicine, 2025).
- In May 2025, the European Commission granted marketing authorization for Novartis' gene therapy, Zolgensma, for the treatment of spinal muscular atrophy in patients under two years of age. This approval expanded the reach of the therapy, which was already approved in the US, to European patients (Novartis, 2025).
Research Analyst Overview
- In the dynamic and evolving the market, traditional medicines are being challenged by innovative treatments based on gene augmentation and editing modalities. Preclinical testing of gene therapy products using viral and non-viral vectors as molecular carriers is underway, with regulatory approval being a crucial milestone. Gene silencing and cell replacement therapies are gaining traction in disease indications such as neurology, with metachromatic leukodystrophy being a notable indication for gene replacement. The clinical pipeline is rich with advanced targeted therapies, including gene therapy for various disease indications, undergoing clinical trials.
- Biological therapies, including gene therapy, require stringent temperature control to ensure shelf life and efficacy. The genomics field continues to drive research initiatives, leading to the development of new gene therapy products and editing modalities. Gene therapy holds promise for treating mutated genes and revolutionizing the healthcare landscape.
Dive into Technavio's robust research methodology, blending expert interviews, extensive data synthesis, and validated models for unparalleled Gene Therapy Market insights. See full methodology.
|
Market Scope |
|
|
Report Coverage |
Details |
|
Page number |
177 |
|
Base year |
2023 |
|
Historic period |
2018-2022 |
|
Forecast period |
2024-2028 |
|
Growth momentum & CAGR |
Accelerate at a CAGR of 23.31% |
|
Market growth 2024-2028 |
USD 6738 million |
|
Market structure |
Fragmented |
|
YoY growth 2023-2024(%) |
18.59 |
|
Key countries |
US, Canada, Germany, UK, Italy, France, China, India, Japan, Brazil, Egypt, UAE, Oman, Argentina, KSA, UAE, Brazil, and Rest of World (ROW) |
|
Competitive landscape |
Leading Companies, Market Positioning of Companies, Competitive Strategies, and Industry Risks |
What are the Key Data Covered in this Gene Therapy Market Research and Growth Report?
- CAGR of the Gene Therapy industry during the forecast period
- Detailed information on factors that will drive the growth and forecasting between 2024 and 2028
- Precise estimation of the size of the market and its contribution of the industry in focus to the parent market
- Accurate predictions about upcoming growth and trends and changes in consumer behaviour
- Growth of the market across North America, Europe, Asia, and Rest of World (ROW)
- Thorough analysis of the market's competitive landscape and detailed information about companies
- Comprehensive analysis of factors that will challenge the gene therapy market growth of industry companies
We can help! Our analysts can customize this gene therapy market research report to meet your requirements.
 RIA -
RIA - 
