
Biotechnology Reagents Market Size 2026-2030
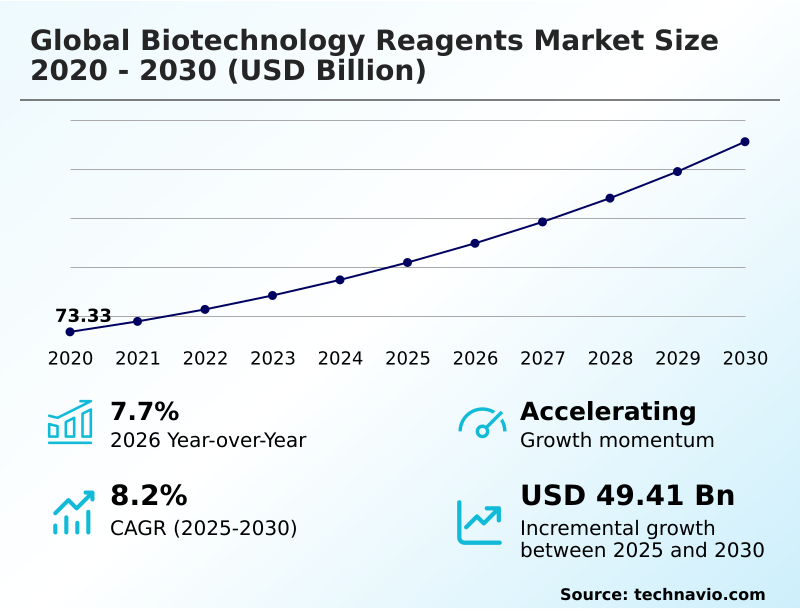
The biotechnology reagents market size is valued to increase by USD 49.41 billion, at a CAGR of 8.2% from 2025 to 2030. Industrialization of high-fidelity reagents for genomic and proteomic applications will drive the biotechnology reagents market.
Major Market Trends & Insights
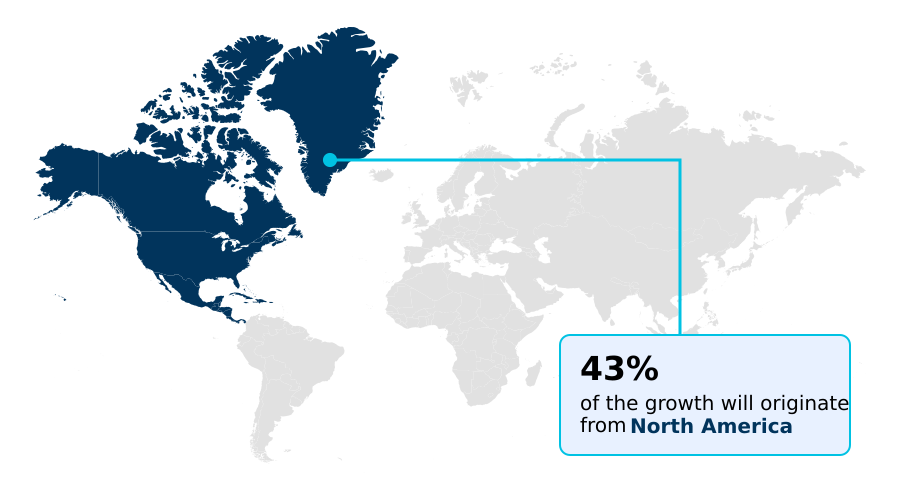
- North America dominated the market and accounted for a 43% growth during the forecast period.
- By Technology - Chromatography segment was valued at USD 31.60 billion in 2024
- By Application - Protein synthesis and purification segment accounted for the largest market revenue share in 2024
Market Size & Forecast
- Market Opportunities: USD 77.78 billion
- Market Future Opportunities: USD 49.41 billion
- CAGR from 2025 to 2030 : 8.2%
Market Summary
- The biotechnology reagents market is undergoing a significant transformation, driven by the increasing complexity of biotherapeutics and the rising demand for precision in research and diagnostics. This evolution is marked by a definitive shift from basic chemical supplies to highly specialized, application-specific kits designed for advanced workflows like single-cell analysis and next-generation sequencing.
- A key factor is the integration of AI, which is optimizing reagent formulation for enhanced stability and performance. For instance, a contract research organization can leverage AI-powered platforms to screen reagent compositions, reducing development timelines for new assays by identifying the most stable formulations before physical synthesis, thereby accelerating drug discovery pipelines.
- However, the industry grapples with challenges related to global supply chain integrity, highlighted by new bio-industrial security mandates that necessitate a costly and complex reshoring of manufacturing for critical components like pcr enzymes and cell culture media.
- This dynamic landscape requires vendors to balance innovation in areas like gmp-grade reagents with the strategic imperative of building resilient, localized supply networks to ensure uninterrupted delivery to clinical and research laboratories.
What will be the Size of the Biotechnology Reagents Market during the forecast period?
Get Key Insights on Market Forecast (PDF) Get Free Sample
How is the Biotechnology Reagents Market Segmented?
The biotechnology reagents industry research report provides comprehensive data (region-wise segment analysis), with forecasts and estimates in "USD million" for the period 2026-2030, as well as historical data from 2020-2024 for the following segments.
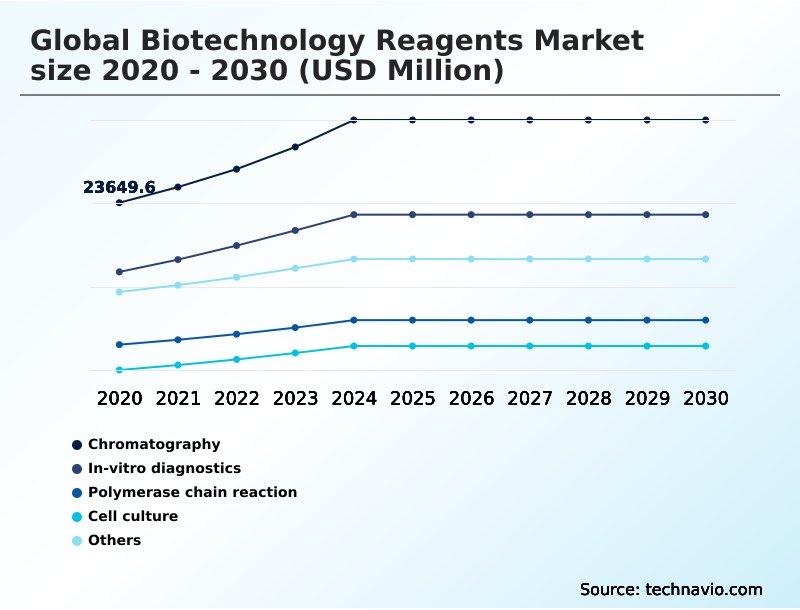
- Technology
- Chromatography
- In-vitro diagnostics
- Polymerase chain reaction
- Cell culture
- Others
- Application
- Protein synthesis and purification
- Gene expression
- DNA and RNA analysis
- Drug testing
- Product
- Life science reagents
- Analytical reagents
- Others
- Geography
- North America
- US
- Canada
- Mexico
- Europe
- Germany
- France
- UK
- Asia
- Rest of World (ROW)
- North America
By Technology Insights
The chromatography segment is estimated to witness significant growth during the forecast period.
The chromatography segment is foundational to biopharmaceutical development, enabling the essential separation and purification of complex biological molecules. Market dynamics are driven by the rising demand for high-purity chromatography reagents and affinity chromatography products for therapeutic antibody production.
A significant transition is underway toward automated high-throughput screening systems, which rely on consistent gmp-grade reagents and stabilized enzymes to ensure reproducibility. This shift has enabled laboratories to reduce solvent consumption by up to 30%.
The push for sustainable reagent manufacturing is also fostering innovation in bio-based solvents and recyclable resins, aligning with corporate sustainability goals.
As new chemical entities become more complex, the reliance on high-resolution chromatographic separation using specialized protein-based reagents remains absolute for pharmaceutical quality control.
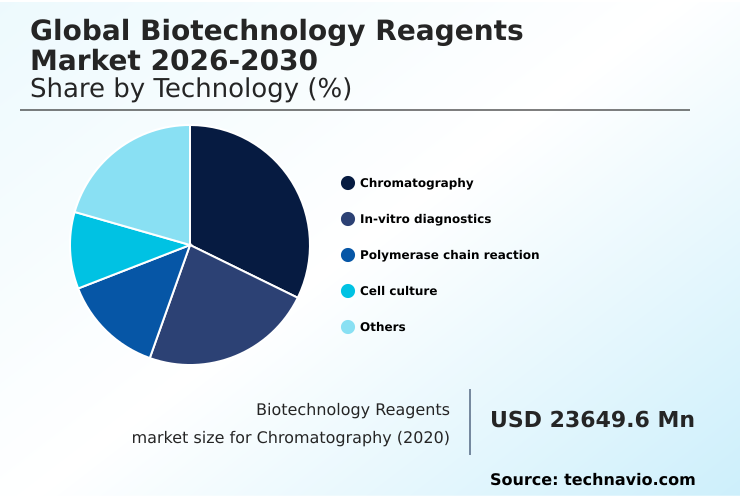
The Chromatography segment was valued at USD 31.60 billion in 2024 and showed a gradual increase during the forecast period.
Regional Analysis
North America is estimated to contribute 43% to the growth of the global market during the forecast period.Technavio’s analysts have elaborately explained the regional trends and drivers that shape the market during the forecast period.
See How Biotechnology Reagents Market Demand is Rising in North America Get Free Sample
The geographic landscape of the biotechnology reagents market is characterized by a dual focus on established and emerging regions.
North America, contributing over 42% of the global market, leads in innovation, driven by extensive R&D in autologous cell therapies and a high adoption rate of laboratory automation reagents.
The region's focus on proteomic applications and high-dimensional flow cytometry sustains demand for premium products.
In contrast, Asia is the fastest-growing region, with a CAGR of 9.3%, fueled by its expanding role as a global hub for biopharmaceutical development and sovereign biomanufacturing.
This growth creates substantial demand for cell culture media and materials for continuous bioprocessing. The development of organ-on-a-chip technology and mrna reagents is a key trend in both regions, highlighting the global push toward more sophisticated research tools.
Market Dynamics
Our researchers analyzed the data with 2025 as the base year, along with the key drivers, trends, and challenges. A holistic analysis of drivers will help companies refine their marketing strategies to gain a competitive advantage.
- The global biotechnology reagents market 2026-2030 is witnessing a pivotal evolution, driven by the need for greater precision and efficiency in life sciences. The demand for high-fidelity reagents for genomics is surging, propelled by advancements in next-generation sequencing library preparation and the expanding use of reagents for dna and rna analysis in clinical settings.
- In parallel, the development of advanced reagents for gene therapy and the use of recombinant reagents for cell culture are becoming cornerstones of modern biomanufacturing. This has intensified the focus on gmp-grade reagents for biomanufacturing to ensure safety and consistency.
- The market for ready-to-use poc reagent kits is also expanding, supported by innovations that allow for reliable ivd reagents for biomarker detection outside traditional labs. A key trend is the use of ai for predictive stability modeling, which optimizes the shelf-life of sensitive biologicals.
- This is particularly crucial given the cost inflation of biologic reagents and the challenges of securing life science supply chains. Applications such as chromatography for antibody purification and pcr for nucleic acid amplification continue to be vital, while emerging areas like reagents for liquid biopsy applications are creating new growth avenues.
- Firms are also focused on sustainable reagent life-cycle management and the adoption of human-relevant in-vitro testing models using serum-free cell culture media. Consequently, there is strong demand for reagents for gene expression studies, protein synthesis, and high-throughput screening to accelerate drug discovery pipelines.
- Companies adopting localized supply chains report initial setup costs that are up to 60% higher than global models but project a long-term reduction in supply disruption risks.
What are the key market drivers leading to the rise in the adoption of Biotechnology Reagents Industry?
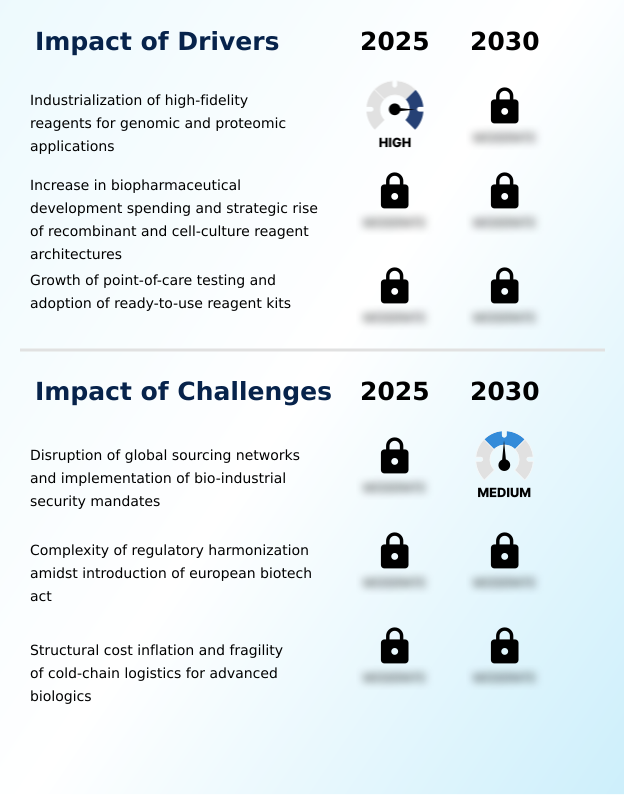
- The industrialization of high-fidelity reagents for advanced genomic and proteomic applications is a key driver propelling market growth.
- Market growth is significantly driven by escalating investment in genomic research tools and the industrialization of high-fidelity reagents for proteomic applications and drug discovery workflows.
- The expansion of biopharmaceutical development, particularly for therapeutic antibody production, necessitates advanced reagents like fluorescently labeled antibodies and viral vector reagents.
- The rise of point-of-care diagnostics is another critical driver, with standardized clinical diagnostic kits improving testing accessibility and delivering results 60% faster than traditional lab-based methods.
- The adoption of laboratory automation leverages reagents with superior ambient-temperature stability, enhancing operational efficiency by over 30%.
- This convergence of advanced research needs and diagnostic demand fuels the market's expansion, particularly for reagents used in single-cell analysis reagents and companion diagnostics.
What are the market trends shaping the Biotechnology Reagents Industry?
- The formulation of AI-optimized reagents and the integration of predictive stability modeling represent a key emerging trend. This shift enhances product efficacy and shelf-life across the industry.
- Key trends are reshaping the market, led by the adoption of human-relevant testing models and new approach methodologies. This shift away from animal-derived inputs toward chemically defined media and animal-origin-free reagents enhances the predictive accuracy of preclinical studies by over 25%.
- Concurrently, the integration of green chemistry principles and the circular economy in lab supplies is compelling vendors to focus on sustainable reagent manufacturing. These initiatives have been shown to reduce hazardous waste by up to 45% in compliant facilities. The use of digital twin reagents allows for virtual performance simulations, optimizing resource use.
- Innovations in monoclonal antibodies and molecular biology enzymes, coupled with advances in spatial transcriptomics, are enabling deeper biological insights and accelerating drug discovery.
What challenges does the Biotechnology Reagents Industry face during its growth?
- The disruption of global sourcing networks, coupled with the implementation of stringent bio-industrial security mandates, presents a significant challenge to the industry's growth trajectory.
- The market faces significant headwinds from ongoing supply chain disruptions and the implementation of stringent bio-industrial security protocols, which can extend project lead times by over 25%. The complexity of regulatory harmonization in biotech, particularly between major markets, introduces uncertainty and increases compliance costs, with some firms reporting a 15% rise in administrative overhead for multi-jurisdictional product launches.
- Furthermore, structural cost inflation for raw materials and the fragility of cold-chain logistics for biologics strain operational budgets. Developing more robust, isotopically labeled standards and reagents with enhanced stability is critical but capital-intensive. These challenges are compelling a strategic pivot toward localized, resilient supply networks and driving innovation in room-temperature stable formulations for pcr enzymes and in-vitro diagnostics reagents.
Exclusive Technavio Analysis on Customer Landscape
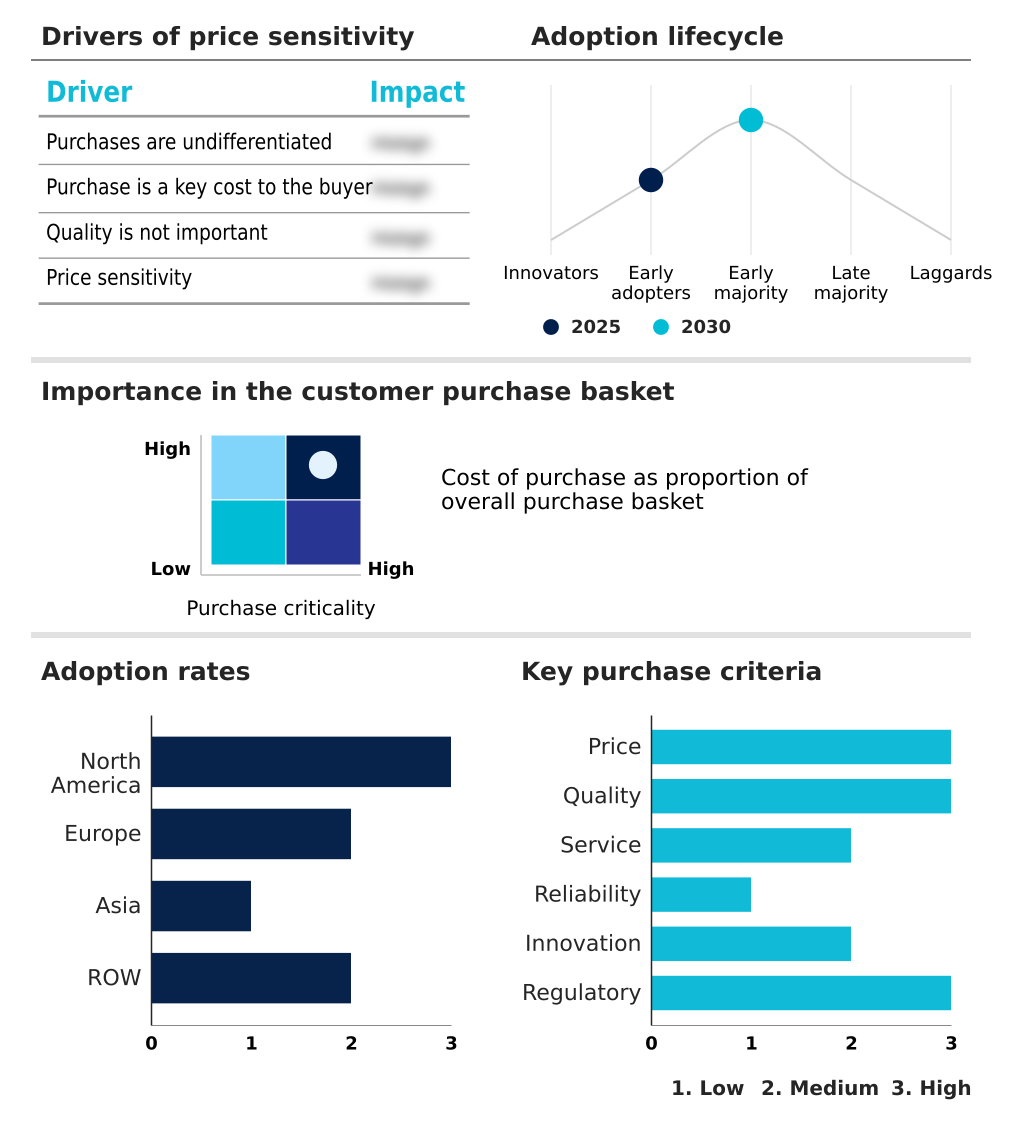
The biotechnology reagents market forecasting report includes the adoption lifecycle of the market, covering from the innovator’s stage to the laggard’s stage. It focuses on adoption rates in different regions based on penetration. Furthermore, the biotechnology reagents market report also includes key purchase criteria and drivers of price sensitivity to help companies evaluate and develop their market growth analysis strategies.
Customer Landscape of Biotechnology Reagents Industry
Competitive Landscape
Companies are implementing various strategies, such as strategic alliances, biotechnology reagents market forecast, partnerships, mergers and acquisitions, geographical expansion, and product/service launches, to enhance their presence in the industry.
Abbott Laboratories - The company provides a diverse range of biotechnology reagents, including immunoassay, molecular diagnostic, and hematology solutions, enhancing the efficiency and accuracy of clinical laboratory operations.
The industry research and growth report includes detailed analyses of the competitive landscape of the market and information about key companies, including:
- Abbott Laboratories
- Agilent Technologies Inc.
- Beckman Coulter Inc.
- Becton Dickinson and Co.
- Bio Rad Laboratories Inc.
- BioMerieux SA
- F. Hoffmann La Roche Ltd.
- Illumina Inc.
- Lonza Group Ltd.
- Merck KGaA
- Meridian Bioscience Inc.
- New England Biolabs Inc.
- Promega Corp.
- QIAGEN N.V.
- Revvity Inc.
- Siemens AG
- Sysmex Corp.
- Takara Bio Inc.
- Thermo Fisher Scientific Inc.
- Waters Corp.
Qualitative and quantitative analysis of companies has been conducted to help clients understand the wider business environment as well as the strengths and weaknesses of key industry players. Data is qualitatively analyzed to categorize companies as pure play, category-focused, industry-focused, and diversified; it is quantitatively analyzed to categorize companies as dominant, leading, strong, tentative, and weak.
Recent Development and News in Biotechnology reagents market
- In December 2025, the United States enacted the Fiscal Year 2026 National Defense Authorization Act, which incorporated the BIOSECURE Act, prohibiting federal agencies from procuring biotechnology equipment or services from designated companies of concern.
- In December 2025, the European Commission released its proposal for the European Biotech Act, a major regulatory framework designed to streamline permitting and accelerate clinical development across the European Union.
- In November 2025, PCR Biosystems introduced its new Lyo-Ready Inhibitor-Tolerant reagents, developed to simplify the creation of lyophilized molecular diagnostic kits that do not require cold-chain logistics.
- In July 2025, Siemens Healthineers AG announced that it received the My Green Lab ACT Ecolabel Certification for over one hundred and fifty of its globally used immunoassay and clinical chemistry reagents.
Dive into Technavio’s robust research methodology, blending expert interviews, extensive data synthesis, and validated models for unparalleled Biotechnology Reagents Market insights. See full methodology.
| Market Scope | |
|---|---|
| Page number | 310 |
| Base year | 2025 |
| Historic period | 2020-2024 |
| Forecast period | 2026-2030 |
| Growth momentum & CAGR | Accelerate at a CAGR of 8.2% |
| Market growth 2026-2030 | USD 49412.8 million |
| Market structure | Fragmented |
| YoY growth 2025-2026(%) | 7.7% |
| Key countries | US, Canada, Mexico, Germany, France, UK, Italy, Spain, The Netherlands, China, Japan, India, South Korea, Thailand, Indonesia, Brazil, Saudi Arabia, UAE, Turkey, Argentina, Colombia, South Africa and Israel |
| Competitive landscape | Leading Companies, Market Positioning of Companies, Competitive Strategies, and Industry Risks |
Research Analyst Overview
- The biotechnology reagents market is transitioning from a component-based supply model to an integrated, workflow-centric ecosystem. This shift is driven by the industry's demand for reproducibility and efficiency, particularly in high-growth areas like next-generation sequencing and protein purification. The emphasis is now on validated kits that combine high-fidelity polymerases, custom oligonucleotides, and other protein-based reagents to minimize experimental variability.
- For instance, the use of automation-compatible, pre-formulated lyophilized reagents can reduce manual error rates by over 40%, a critical factor influencing boardroom decisions on R&D capital expenditure and operational strategy. Furthermore, the development of advanced electrophoresis reagents and diagnostic dyes for applications such as liquid biopsy and crispr-based screening is redefining diagnostic and therapeutic pathways.
- As regulatory scrutiny intensifies, the adoption of gmp-grade reagents, including reverse transcriptases, dna polymerases, primers, and nucleotides for nucleic acid amplification, has become a competitive differentiator, ensuring that research seamlessly translates into clinical applications. Success now hinges on providing end-to-end solutions that guarantee performance from sample to result.
What are the Key Data Covered in this Biotechnology Reagents Market Research and Growth Report?
-
What is the expected growth of the Biotechnology Reagents Market between 2026 and 2030?
-
USD 49.41 billion, at a CAGR of 8.2%
-
-
What segmentation does the market report cover?
-
The report is segmented by Technology (Chromatography, In-vitro diagnostics, Polymerase chain reaction, Cell culture, and Others), Application (Protein synthesis and purification, Gene expression, DNA and RNA analysis, and Drug testing, ), Product (Life science reagents, Analytical reagents, and Others) and Geography (North America, Europe, Asia, Rest of World (ROW))
-
-
Which regions are analyzed in the report?
-
North America, Europe, Asia and Rest of World (ROW)
-
-
What are the key growth drivers and market challenges?
-
Industrialization of high-fidelity reagents for genomic and proteomic applications, Disruption of global sourcing networks and implementation of bio-industrial security mandates
-
-
Who are the major players in the Biotechnology Reagents Market?
-
Abbott Laboratories, Agilent Technologies Inc., Beckman Coulter Inc., Becton Dickinson and Co., Bio Rad Laboratories Inc., BioMerieux SA, F. Hoffmann La Roche Ltd., Illumina Inc., Lonza Group Ltd., Merck KGaA, Meridian Bioscience Inc., New England Biolabs Inc., Promega Corp., QIAGEN N.V., Revvity Inc., Siemens AG, Sysmex Corp., Takara Bio Inc., Thermo Fisher Scientific Inc. and Waters Corp.
-
Market Research Insights
- The market is shaped by a dynamic interplay of technological innovation and stringent regulatory demands. The rise of precision medicine reagents and companion diagnostics development is creating significant opportunities, with firms leveraging ai-optimized reagent formulation to accelerate product development. This approach has demonstrated the ability to reduce assay optimization time by over 40% in some cases.
- Concurrently, the push for sovereign biomanufacturing is reshaping supply chains, forcing companies to adopt new models to ensure continuity. The adoption of good manufacturing practice standards is no longer optional but a baseline requirement, increasing compliance costs by an estimated 10-15% for many producers.
- The focus on ambient-temperature stability for clinical diagnostic kits is also critical, particularly for expanding access to point-of-care diagnostics in emerging markets, where maintaining cold-chain logistics for biologics remains a persistent challenge.
We can help! Our analysts can customize this biotechnology reagents market research report to meet your requirements.
 RIA -
RIA - 
