Generative AI In Material Science Market Analysis, Size, and Forecast 2025-2029: North America (US, Canada, and Mexico), Europe (Germany, UK, and France), APAC (China, Japan, and India), South America (Brazil, Argentina, and Colombia), Middle East and Africa (Saudi Arabia, UAE, and South Africa), and Rest of World (ROW)

Generative AI In Material Science Market Analysis, Size, and Forecast 2025-2029:
North America (US, Canada, and Mexico), Europe (Germany, UK, and France), APAC (China, Japan, and India), South America (Brazil, Argentina, and Colombia), Middle East and Africa (Saudi Arabia, UAE, and South Africa), and Rest of World (ROW)

Published: Dec 2025 309 Pages SKU: IRTNTR80996

Market Overview at a Glance

$1.71 B
Market Opportunity
27.9%
CAGR 2024 - 2029
46.9%
North America Growth
$246.6 Mn
Materials discovery and design segment 2023

Generative AI In Material Science Market Size 2025-2029

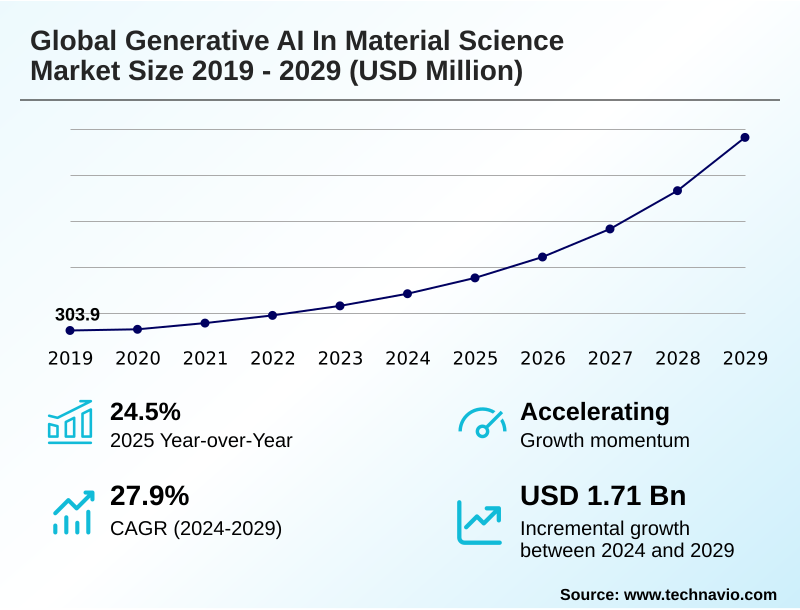
The generative ai in material science market size is valued to increase by USD 1.71 billion, at a CAGR of 27.9% from 2024 to 2029. Intensifying industrial demand for next-generation materials will drive the generative ai in material science market.

Major Market Trends & Insights

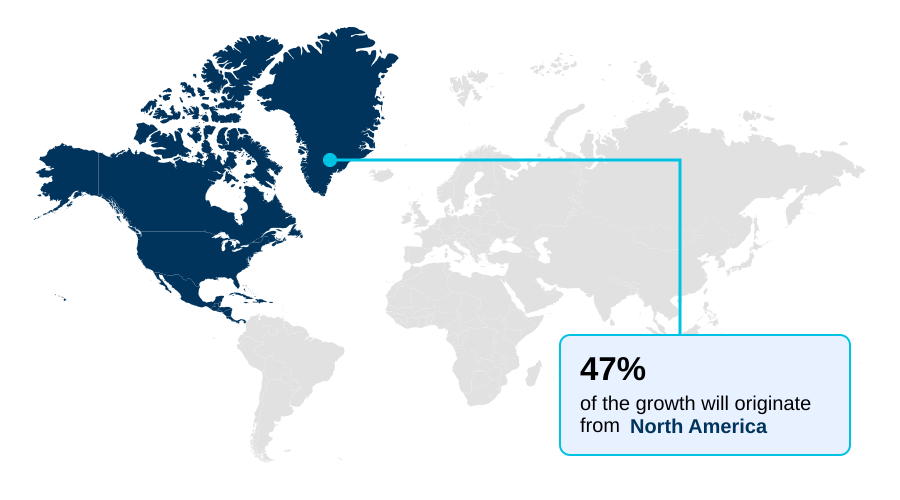
  • North America dominated the market and accounted for a 46.9% growth during the forecast period.
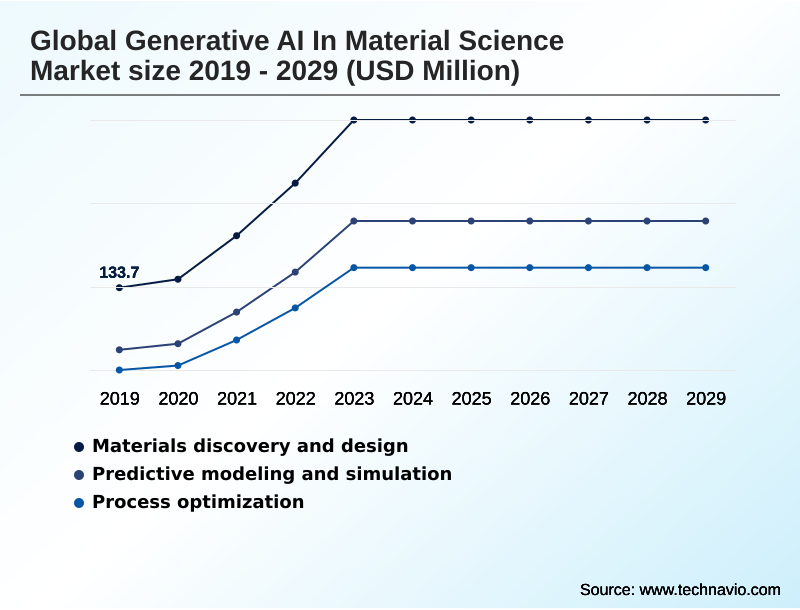
  • By Type - Materials discovery and design segment was valued at USD 246.6 million in 2023
  • By Deployment - Cloud-Based segment accounted for the largest market revenue share in 2023

Market Size & Forecast

  • Market Opportunities: USD 2.11 billion
  • Market Future Opportunities: USD 1.71 billion
  • CAGR from 2024 to 2029 : 27.9%

Market Summary

  • The generative AI in material science market is fundamentally reshaping industrial innovation by replacing traditional, linear R&D with accelerated, purpose-driven discovery. This market utilizes sophisticated algorithms to learn underlying physical principles from vast datasets, enabling an inverse design methodology where desired properties dictate the creation of novel molecular structures.
  • This approach is critical in sectors facing material limitations, such as an aerospace firm seeking to develop a new lightweight alloy with specific thermal resistance and tensile strength. Instead of years of iterative testing, generative models can propose and computationally validate thousands of candidates in weeks.
  • This capability is pivotal for developing everything from advanced battery cathode materials to sustainable polymers. However, realizing this potential is contingent on overcoming significant hurdles related to data quality and the practical synthesizability of computationally designed materials, which requires a deep integration of AI with physical laboratory validation.
  • The convergence of high-performance computing, algorithmic advancements, and urgent industrial demand defines the dynamic landscape.

What will be the Size of the Generative AI In Material Science Market during the forecast period?

Get Key Insights on Market Forecast (PDF) Request Free Sample

How is the Generative AI In Material Science Market Segmented?

The generative ai in material science industry research report provides comprehensive data (region-wise segment analysis), with forecasts and estimates in "USD million" for the period 2025-2029, as well as historical data from 2019-2023 for the following segments.

  • Type
    • Materials discovery and design
    • Predictive modeling and simulation
    • Process optimization
  • Deployment
    • Cloud based
    • On premises
    • Hybrid
  • Application
    • Pharmaceuticals and chemicals
    • Automotive and aerospace
    • Electronics and semiconductors
    • Energy storage and conversion
    • Others
  • Geography
    • North America
      • US
      • Canada
      • Mexico
    • Europe
      • Germany
      • UK
      • France
    • APAC
      • China
      • Japan
      • India
    • South America
      • Brazil
      • Argentina
      • Colombia
    • Middle East and Africa
      • Saudi Arabia
      • UAE
      • South Africa
    • Rest of World (ROW)

By Type Insights

The materials discovery and design segment is estimated to witness significant growth during the forecast period.

The materials discovery and design segment is pioneering a paradigm shift, moving beyond traditional R&D toward advanced computational materials science.

This evolution centers on inverse design methodology, where generative adversarial networks (GANs) and other models create novel molecular structures to meet predefined performance targets.

This approach is not merely theoretical; its application in designing solid-state electrolyte candidates has been shown to reduce initial screening timelines by over 90% compared to conventional methods.

The core objective is to leverage materials informatics and high-performance computing (HPC) to navigate and unlock vast, unexplored areas of chemical space exploration.

This enables the de novo design of next-generation electronics and high-energy-density batteries, making it the primary engine of innovation in the market.

Request Free Sample

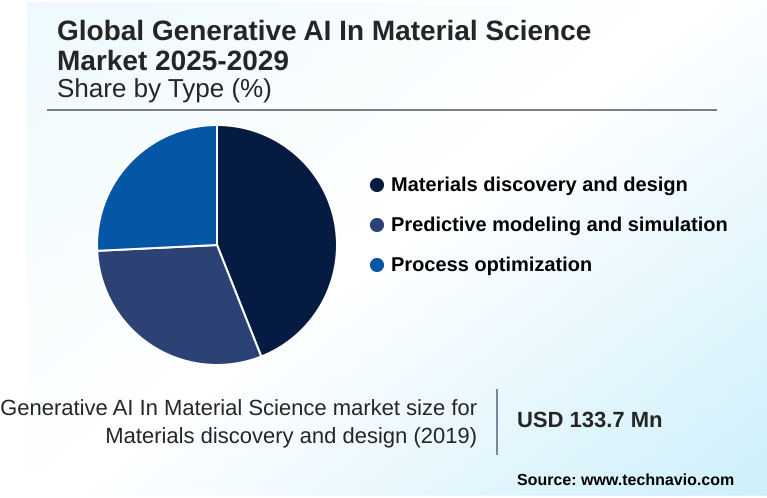
The Materials discovery and design segment was valued at USD 246.6 million in 2023 and showed a gradual increase during the forecast period.

Request Free Sample

Regional Analysis

North America is estimated to contribute 46.9% to the growth of the global market during the forecast period.Technavio’s analysts have elaborately explained the regional trends and drivers that shape the market during the forecast period.

See How Generative AI In Material Science Market Demand is Rising in North America Request Free Sample

The geographic landscape of the generative AI in material science market is led by North America, which commands over 46% of the global opportunity, driven by its robust venture capital ecosystem and a high concentration of specialized talent.

The region hosts numerous self-driving laboratories focused on creating battery cathode materials and rare-earth-free magnets.

Europe is a strong secondary market, focusing its materials characterization efforts on sustainability and supporting the circular economy materials transition, with initiatives aiming for a 30% improvement in resource efficiency.

Meanwhile, the APAC region, backed by significant government investment, leverages the technology for manufacturing and securing technological self-sufficiency in strategic areas like decarbonization technologies.

The development of advanced aluminum alloys and ceramic matrix composites is a key focus, with regional players aiming to reduce reliance on foreign technology.

Market Dynamics

Our researchers analyzed the data with 2024 as the base year, along with the key drivers, trends, and challenges. A holistic analysis of drivers will help companies refine their marketing strategies to gain a competitive advantage.

  • The practical application of generative AI in material science is rapidly expanding across diverse industrial challenges, moving beyond theoretical models to deliver tangible results. A primary focus is on generative AI for lightweight alloy design, crucial for the aerospace and automotive sectors, where new compositions are computationally generated to meet stringent strength-to-weight targets.
  • In parallel, AI-driven catalyst discovery for carbon capture is gaining momentum, as inverse design of rare-earth-free magnets and custom catalysts enables the creation of materials with superior performance. Predictive modeling for battery material stability is essential for the energy transition, with generative AI for solid-state electrolyte discovery accelerating the development of safer, high-capacity batteries.
  • This is complemented by foundation models for green hydrogen catalyst design, which address another key energy challenge. In the polymer and plastics industries, multi-objective optimization in polymer design and using generative AI to design biodegradable plastics are tackling sustainability goals head-on.
  • The semiconductor industry is also a major beneficiary, using generative AI in semiconductor material exploration and generative models for next-generation semiconductors to overcome the limitations of silicon. This breadth of applications, from developing high-strength steel with generative models to AI-assisted design of biocompatible polymers, underscores the technology's transformative potential.
  • For instance, the efficiency gains in this space are significant, with AI platforms for advanced composite materials demonstrating an ability to shorten development cycles by more than half compared to conventional methods.

What are the key market drivers leading to the rise in the adoption of Generative AI In Material Science Industry?

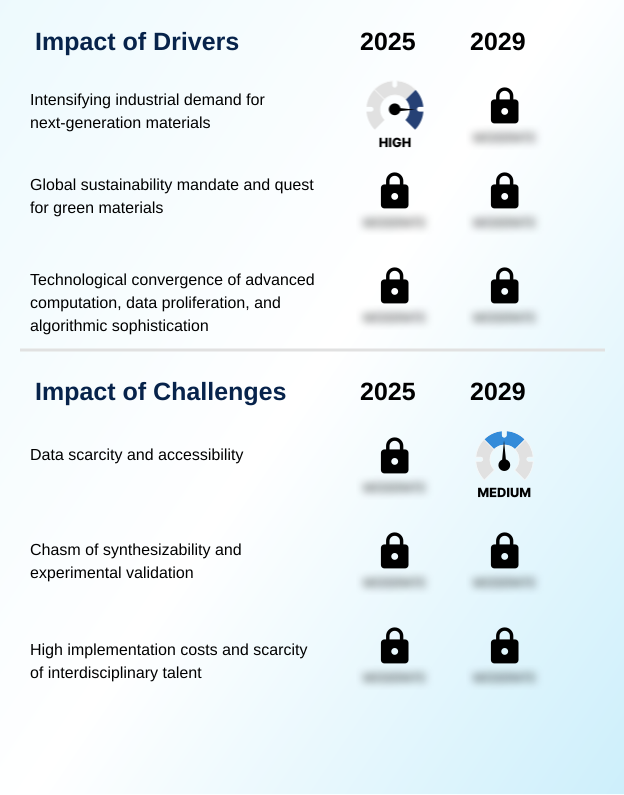
  • The market is primarily driven by intensifying industrial demand for next-generation materials with unprecedented performance characteristics across sectors like aerospace, automotive, and electronics.

  • The growth of the generative AI in material science market is propelled by a confluence of powerful drivers.
  • The foremost is intense industrial demand for next-generation materials like high-strength steel alloys and biocompatible polymers, where traditional R&D can no longer meet accelerated timelines. Generative AI addresses this by enabling rapid materials discovery and design.
  • Secondly, the global mandate for sustainability is creating a significant pull for circular economy materials and decarbonization technologies. AI-designed catalysts for green chemistry principles have demonstrated a potential to increase carbon capture efficiency by over 30%.
  • Finally, the technological convergence of advanced computation and data proliferation, including physics-based simulations and quantum simulation, is a critical enabler.
  • The accessibility of cloud-native R&D platforms has reduced upfront R&D costs for some firms by 50%, democratizing access to powerful material exploration tools.

What are the market trends shaping the Generative AI In Material Science Industry?

  • A key market trend is the integration of generative AI with autonomous laboratories. This creates closed-loop discovery platforms that automate the design-build-test-learn cycle for accelerated material innovation.

  • Key trends are reshaping the generative AI in material science market, moving from theoretical prediction to automated, end-to-end material innovation solutions. The integration of generative AI with self-driving laboratories is creating closed-loop discovery platforms, where automated synthesis and materials characterization are directly guided by AI. This approach can accelerate discovery cycles by up to 10 times compared to manual methods.
  • Another significant trend is the development of domain-specific foundation models, which are pre-trained on vast datasets of molecular structures and material properties, lowering the entry barrier for organizations. Furthermore, the industry is shifting towards multi-objective optimization, enabling the design of materials that balance performance, cost, and manufacturability.
  • This approach has improved the commercial viability of AI-designed sustainable polymers by 40% by ensuring they can be produced at scale.

What challenges does the Generative AI In Material Science Industry face during its growth?

  • A key challenge affecting industry growth is the scarcity of high-quality, accessible, and standardized data required to train robust and generalizable AI models.

  • Despite its potential, the generative AI in material science market faces significant challenges that temper its growth. The primary hurdle is data scarcity and the lack of standardized, high-quality information needed for robust predictive modeling and simulation and force field integration. This can lead to model inaccuracies of up to 20% when applied to novel material classes.
  • Another major challenge is the chasm between computational prediction and physical viability, as many AI-generated materials are difficult to synthesize. This synthesis pathway prediction issue is a critical bottleneck. Lastly, high implementation costs and a severe scarcity of interdisciplinary talent are significant barriers, with talent shortages driving up project labor costs by an estimated 35%.
  • This makes it difficult for smaller entities to adopt advanced techniques like large quantitative models (LQMs) for process optimization.

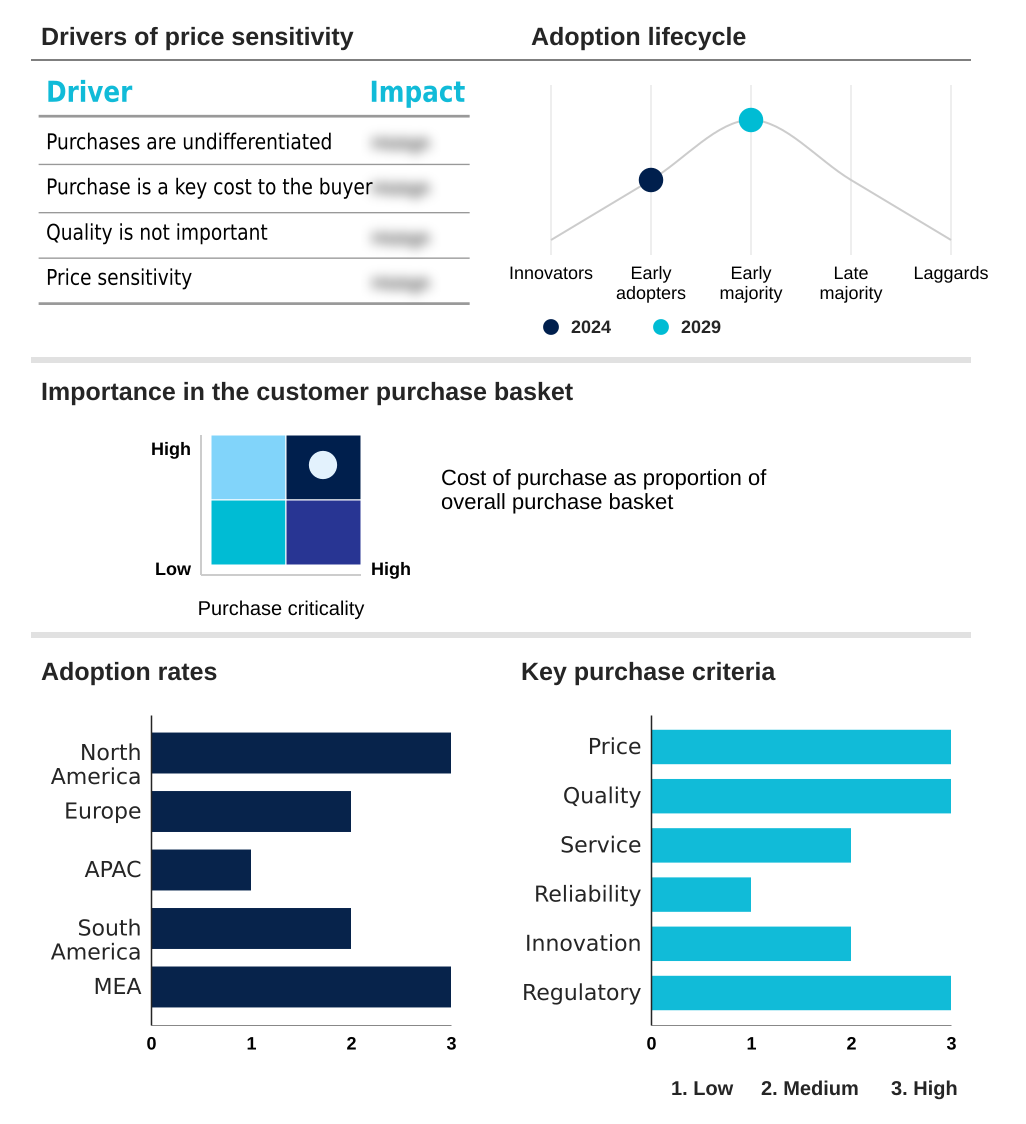
Exclusive Technavio Analysis on Customer Landscape

The generative ai in material science market forecasting report includes the adoption lifecycle of the market, covering from the innovator’s stage to the laggard’s stage. It focuses on adoption rates in different regions based on penetration. Furthermore, the generative ai in material science market report also includes key purchase criteria and drivers of price sensitivity to help companies evaluate and develop their market growth analysis strategies.

Customer Landscape of Generative AI In Material Science Industry

Competitive Landscape

Companies are implementing various strategies, such as strategic alliances, generative ai in material science market forecast, partnerships, mergers and acquisitions, geographical expansion, and product/service launches, to enhance their presence in the industry.

Aionics Inc. - Delivers a dedicated materials informatics platform using AI to accelerate chemical and material product development through virtual lab functionalities and integrated data management.

The industry research and growth report includes detailed analyses of the competitive landscape of the market and information about key companies, including:

  • Aionics Inc.
  • Arzeda Corp.
  • BASF SE
  • Citrine Informatics Inc.
  • Dassault Systemes SE
  • DeepMaterials LLC
  • Google LLC
  • IBM Corp.
  • Kebotix Inc.
  • Mat3ra Inc.
  • MaterialsZone Ltd.
  • Microsoft Corp.
  • NVIDIA Corp.
  • Optibrium
  • Orbital Materials Inc.
  • Phaseshift Inc.
  • Quantum Generative Materials LLC
  • sandboxAQ
  • Schrodinger Inc.

Qualitative and quantitative analysis of companies has been conducted to help clients understand the wider business environment as well as the strengths and weaknesses of key industry players. Data is qualitatively analyzed to categorize companies as pure play, category-focused, industry-focused, and diversified; it is quantitatively analyzed to categorize companies as dominant, leading, strong, tentative, and weak.

Recent Development and News in Generative ai in material science market

  • In October 2024, BASF SE announced a strategic partnership with Kebotix Inc. to build a fully autonomous, AI-driven laboratory for discovering sustainable polymers, integrating Kebotix's self-driving lab technology with BASF's extensive materials data.
  • In November 2024, NVIDIA Corp. launched 'NVIDIA Chimera,' a new cloud platform featuring foundation models specifically pre-trained on chemical and materials science data to accelerate the design of novel alloys and catalysts.
  • In January 2025, Dassault Systemes SE completed the acquisition of Phaseshift Inc. for an undisclosed sum, integrating Phaseshift's rapid alloy design (RAD) platform into its BIOVIA portfolio to enhance its multi-objective material design capabilities.
  • In April 2025, Orbital Materials Inc. announced it had secured a USD 50 million Series B funding round to scale its AI-powered platform, Orb, for designing cleantech materials, including novel carbon capture sorbents and green hydrogen catalysts.

Dive into Technavio’s robust research methodology, blending expert interviews, extensive data synthesis, and validated models for unparalleled Generative AI In Material Science Market insights. See full methodology.

Market Scope
Page number 309
Base year 2024
Historic period 2019-2023
Forecast period 2025-2029
Growth momentum & CAGR Accelerate at a CAGR of 27.9%
Market growth 2025-2029 USD 1705.3 million
Market structure Fragmented
YoY growth 2024-2025(%) 24.5%
Key countries US, Canada, Mexico, Germany, UK, France, Italy, The Netherlands, Spain, China, Japan, India, South Korea, Australia, Indonesia, Brazil, Argentina, Colombia, Saudi Arabia, UAE, South Africa, Israel and Turkey
Competitive landscape Leading Companies, Market Positioning of Companies, Competitive Strategies, and Industry Risks

Request Free Sample

Research Analyst Overview

  • The generative AI in material science market is fundamentally altering the innovation pipeline, driven by the maturation of core technologies like generative adversarial networks (GANs) and, more recently, transformers and diffusion models. These algorithms enable a sophisticated inverse design methodology, allowing for the de novo design of materials with precisely tailored characteristics.
  • The application of graph neural networks (GNNs) and tools like Graph Networks for Materials Exploration (GNoME) is facilitating unprecedented chemical space exploration, leading to the discovery of millions of new crystalline materials. This computational power is being applied to solve critical industrial problems, from creating novel metal-organic frameworks (MOFs) for carbon capture to designing high-performance solid-state battery materials.
  • The integration of high-performance computing (HPC) with high-throughput screening has been particularly impactful. For instance, a single project demonstrated the ability to screen over 32 million potential material candidates, a scale that drastically accelerates the identification of viable options for real-world applications. This capability is enabling breakthroughs in atomistic design, molecular dynamics simulation, and understanding complex structure-property relationships.

What are the Key Data Covered in this Generative AI In Material Science Market Research and Growth Report?

  • What is the expected growth of the Generative AI In Material Science Market between 2025 and 2029?

    • USD 1.71 billion, at a CAGR of 27.9%

  • What segmentation does the market report cover?

    • The report is segmented by Type (Materials discovery and design, Predictive modeling and simulation, Process optimization), Deployment (Cloud-Based, On-Premises, Hybrid), Application (Pharmaceuticals and chemicals, Electronics and semiconductors, Energy storage and conversion, Automotive and aerospace, Others) and Geography (North America, Europe, APAC, South America, Middle East and Africa)

  • Which regions are analyzed in the report?

    • North America, Europe, APAC, South America and Middle East and Africa

  • What are the key growth drivers and market challenges?

    • Intensifying industrial demand for next-generation materials, Data scarcity and accessibility

  • Who are the major players in the Generative AI In Material Science Market?

    • Aionics Inc., Arzeda Corp., BASF SE, Citrine Informatics Inc., Dassault Systemes SE, DeepMaterials LLC, Google LLC, IBM Corp., Kebotix Inc., Mat3ra Inc., MaterialsZone Ltd., Microsoft Corp., NVIDIA Corp., Optibrium, Orbital Materials Inc., Phaseshift Inc., Quantum Generative Materials LLC, sandboxAQ and Schrodinger Inc.

Market Research Insights

  • The generative AI in material science market is defined by a dynamic interplay of technological advancements and strategic industrial imperatives. The adoption of autonomous laboratories for material innovation solutions is accelerating R&D cycles, with some automated platforms demonstrating a 70% reduction in experimental validation time.
  • Concurrently, physics-based simulations, enhanced by AI-driven molecular prediction and real-time experiment suggestion, are becoming central to AI-guided product development. This has enabled firms to improve formulation optimization accuracy by over 25% compared to traditional modeling. The pursuit of supply chain resilience is another critical factor, pushing industries toward discovering alternative materials.
  • This approach is facilitated by cloud-native R&D platforms that offer scalable computational power, making advanced atomistic simulation accessible to a broader range of organizations and driving innovation in process optimization and materials discovery and design.

We can help! Our analysts can customize this generative ai in material science market research report to meet your requirements.

Get in touch

1. Executive Summary

1.1 Market overview

Executive Summary - Chart on Market Overview
Executive Summary - Data Table on Market Overview
Executive Summary - Chart on Global Market Characteristics
Executive Summary - Chart on Market by Geography
Executive Summary - Chart on Market Segmentation by Type
Executive Summary - Chart on Market Segmentation by Deployment
Executive Summary - Chart on Market Segmentation by Application
Executive Summary - Chart on Incremental Growth
Executive Summary - Data Table on Incremental Growth
Executive Summary - Chart on Company Market Positioning

2. Technavio Analysis

2.1 Analysis of price sensitivity, lifecycle, customer purchase basket, adoption rates, and purchase criteria

2.2 Criticality of inputs and Factors of differentiation

Chart on Overview on criticality of inputs and factors of differentiation

2.3 Factors of disruption

Chart on Overview on factors of disruption

2.4 Impact of drivers and challenges

Chart on Impact of drivers and challenges in 2024 and 2029

3. Market Landscape

3.1 Market ecosystem

Chart on Parent Market
Data Table on - Parent Market

3.2 Market characteristics

Chart on Market characteristics analysis

3.3 Value chain analysis

Chart on Value chain analysis

4. Market Sizing

4.1 Market definition

Data Table on Offerings of companies included in the market definition

4.2 Market segment analysis

Market segments

4.3 Market size 2024

4.4 Market outlook: Forecast for 2024-2029

Chart on Global - Market size and forecast 2024-2029 ($ million)
Data Table on Global - Market size and forecast 2024-2029 ($ million)
Chart on Global Market: Year-over-year growth 2024-2029 (%)
Data Table on Global Market: Year-over-year growth 2024-2029 (%)

5. Historic Market Size

5.1 Global Generative AI In Material Science Market 2019 - 2023

Historic Market Size - Data Table on Global Generative AI In Material Science Market 2019 - 2023 ($ million)

5.2 Type segment analysis 2019 - 2023

Historic Market Size - Type Segment 2019 - 2023 ($ million)

5.3 Deployment segment analysis 2019 - 2023

Historic Market Size - Deployment Segment 2019 - 2023 ($ million)

5.4 Application segment analysis 2019 - 2023

Historic Market Size - Application Segment 2019 - 2023 ($ million)

5.5 Geography segment analysis 2019 - 2023

Historic Market Size - Geography Segment 2019 - 2023 ($ million)

5.6 Country segment analysis 2019 - 2023

Historic Market Size - Country Segment 2019 - 2023 ($ million)

6. Five Forces Analysis

6.1 Five forces summary

Five forces analysis - Comparison between 2024 and 2029

6.2 Bargaining power of buyers

Bargaining power of buyers - Impact of key factors 2024 and 2029

6.3 Bargaining power of suppliers

Bargaining power of suppliers - Impact of key factors in 2024 and 2029

6.4 Threat of new entrants

Threat of new entrants - Impact of key factors in 2024 and 2029

6.5 Threat of substitutes

Threat of substitutes - Impact of key factors in 2024 and 2029

6.6 Threat of rivalry

Threat of rivalry - Impact of key factors in 2024 and 2029

6.7 Market condition

Chart on Market condition - Five forces 2024 and 2029

7. Market Segmentation by Type

7.1 Market segments

Chart on Type - Market share 2024-2029 (%)
Data Table on Type - Market share 2024-2029 (%)

7.2 Comparison by Type

Chart on Comparison by Type
Data Table on Comparison by Type

7.3 Materials discovery and design - Market size and forecast 2024-2029

Chart on Materials discovery and design - Market size and forecast 2024-2029 ($ million)
Data Table on Materials discovery and design - Market size and forecast 2024-2029 ($ million)
Chart on Materials discovery and design - Year-over-year growth 2024-2029 (%)
Data Table on Materials discovery and design - Year-over-year growth 2024-2029 (%)

7.4 Predictive modeling and simulation - Market size and forecast 2024-2029

Chart on Predictive modeling and simulation - Market size and forecast 2024-2029 ($ million)
Data Table on Predictive modeling and simulation - Market size and forecast 2024-2029 ($ million)
Chart on Predictive modeling and simulation - Year-over-year growth 2024-2029 (%)
Data Table on Predictive modeling and simulation - Year-over-year growth 2024-2029 (%)

7.5 Process optimization - Market size and forecast 2024-2029

Chart on Process optimization - Market size and forecast 2024-2029 ($ million)
Data Table on Process optimization - Market size and forecast 2024-2029 ($ million)
Chart on Process optimization - Year-over-year growth 2024-2029 (%)
Data Table on Process optimization - Year-over-year growth 2024-2029 (%)

7.6 Market opportunity by Type

Market opportunity by Type ($ million)
Data Table on Market opportunity by Type ($ million)

8. Market Segmentation by Deployment

8.1 Market segments

Chart on Deployment - Market share 2024-2029 (%)
Data Table on Deployment - Market share 2024-2029 (%)

8.2 Comparison by Deployment

Chart on Comparison by Deployment
Data Table on Comparison by Deployment

8.3 Cloud based - Market size and forecast 2024-2029

Chart on Cloud based - Market size and forecast 2024-2029 ($ million)
Data Table on Cloud based - Market size and forecast 2024-2029 ($ million)
Chart on Cloud based - Year-over-year growth 2024-2029 (%)
Data Table on Cloud based - Year-over-year growth 2024-2029 (%)

8.4 On premises - Market size and forecast 2024-2029

Chart on On premises - Market size and forecast 2024-2029 ($ million)
Data Table on On premises - Market size and forecast 2024-2029 ($ million)
Chart on On premises - Year-over-year growth 2024-2029 (%)
Data Table on On premises - Year-over-year growth 2024-2029 (%)

8.5 Hybrid - Market size and forecast 2024-2029

Chart on Hybrid - Market size and forecast 2024-2029 ($ million)
Data Table on Hybrid - Market size and forecast 2024-2029 ($ million)
Chart on Hybrid - Year-over-year growth 2024-2029 (%)
Data Table on Hybrid - Year-over-year growth 2024-2029 (%)

8.6 Market opportunity by Deployment

Market opportunity by Deployment ($ million)
Data Table on Market opportunity by Deployment ($ million)

9. Market Segmentation by Application

9.1 Market segments

Chart on Application - Market share 2024-2029 (%)
Data Table on Application - Market share 2024-2029 (%)

9.2 Comparison by Application

Chart on Comparison by Application
Data Table on Comparison by Application

9.3 Pharmaceuticals and chemicals - Market size and forecast 2024-2029

Chart on Pharmaceuticals and chemicals - Market size and forecast 2024-2029 ($ million)
Data Table on Pharmaceuticals and chemicals - Market size and forecast 2024-2029 ($ million)
Chart on Pharmaceuticals and chemicals - Year-over-year growth 2024-2029 (%)
Data Table on Pharmaceuticals and chemicals - Year-over-year growth 2024-2029 (%)

9.4 Automotive and aerospace - Market size and forecast 2024-2029

Chart on Automotive and aerospace - Market size and forecast 2024-2029 ($ million)
Data Table on Automotive and aerospace - Market size and forecast 2024-2029 ($ million)
Chart on Automotive and aerospace - Year-over-year growth 2024-2029 (%)
Data Table on Automotive and aerospace - Year-over-year growth 2024-2029 (%)

9.5 Electronics and semiconductors - Market size and forecast 2024-2029

Chart on Electronics and semiconductors - Market size and forecast 2024-2029 ($ million)
Data Table on Electronics and semiconductors - Market size and forecast 2024-2029 ($ million)
Chart on Electronics and semiconductors - Year-over-year growth 2024-2029 (%)
Data Table on Electronics and semiconductors - Year-over-year growth 2024-2029 (%)

9.6 Energy storage and conversion - Market size and forecast 2024-2029

Chart on Energy storage and conversion - Market size and forecast 2024-2029 ($ million)
Data Table on Energy storage and conversion - Market size and forecast 2024-2029 ($ million)
Chart on Energy storage and conversion - Year-over-year growth 2024-2029 (%)
Data Table on Energy storage and conversion - Year-over-year growth 2024-2029 (%)

9.7 Others - Market size and forecast 2024-2029

Chart on Others - Market size and forecast 2024-2029 ($ million)
Data Table on Others - Market size and forecast 2024-2029 ($ million)
Chart on Others - Year-over-year growth 2024-2029 (%)
Data Table on Others - Year-over-year growth 2024-2029 (%)

9.8 Market opportunity by Application

Market opportunity by Application ($ million)
Data Table on Market opportunity by Application ($ million)

10. Customer Landscape

10.1 Customer landscape overview

Analysis of price sensitivity, lifecycle, customer purchase basket, adoption rates, and purchase criteria

11. Geographic Landscape

11.1 Geographic segmentation

Chart on Market share by geography 2024-2029 (%)
Data Table on Market share by geography 2024-2029 (%)

11.2 Geographic comparison

Chart on Geographic comparison
Data Table on Geographic comparison

11.3 North America - Market size and forecast 2024-2029

Chart on North America - Market size and forecast 2024-2029 ($ million)
Data Table on North America - Market size and forecast 2024-2029 ($ million)
Chart on North America - Year-over-year growth 2024-2029 (%)
Data Table on North America - Year-over-year growth 2024-2029 (%)
Chart on Regional Comparison - North America
Data Table on Regional Comparison - North America

11.3.1 US - Market size and forecast 2024-2029

Chart on US - Market size and forecast 2024-2029 ($ million)
Data Table on US - Market size and forecast 2024-2029 ($ million)
Chart on US - Year-over-year growth 2024-2029 (%)
Data Table on US - Year-over-year growth 2024-2029 (%)

11.3.2 Canada - Market size and forecast 2024-2029

Chart on Canada - Market size and forecast 2024-2029 ($ million)
Data Table on Canada - Market size and forecast 2024-2029 ($ million)
Chart on Canada - Year-over-year growth 2024-2029 (%)
Data Table on Canada - Year-over-year growth 2024-2029 (%)

11.3.3 Mexico - Market size and forecast 2024-2029

Chart on Mexico - Market size and forecast 2024-2029 ($ million)
Data Table on Mexico - Market size and forecast 2024-2029 ($ million)
Chart on Mexico - Year-over-year growth 2024-2029 (%)
Data Table on Mexico - Year-over-year growth 2024-2029 (%)

11.4 Europe - Market size and forecast 2024-2029

Chart on Europe - Market size and forecast 2024-2029 ($ million)
Data Table on Europe - Market size and forecast 2024-2029 ($ million)
Chart on Europe - Year-over-year growth 2024-2029 (%)
Data Table on Europe - Year-over-year growth 2024-2029 (%)
Chart on Regional Comparison - Europe
Data Table on Regional Comparison - Europe

11.4.1 Germany - Market size and forecast 2024-2029

Chart on Germany - Market size and forecast 2024-2029 ($ million)
Data Table on Germany - Market size and forecast 2024-2029 ($ million)
Chart on Germany - Year-over-year growth 2024-2029 (%)
Data Table on Germany - Year-over-year growth 2024-2029 (%)

11.4.2 UK - Market size and forecast 2024-2029

Chart on UK - Market size and forecast 2024-2029 ($ million)
Data Table on UK - Market size and forecast 2024-2029 ($ million)
Chart on UK - Year-over-year growth 2024-2029 (%)
Data Table on UK - Year-over-year growth 2024-2029 (%)

11.4.3 France - Market size and forecast 2024-2029

Chart on France - Market size and forecast 2024-2029 ($ million)
Data Table on France - Market size and forecast 2024-2029 ($ million)
Chart on France - Year-over-year growth 2024-2029 (%)
Data Table on France - Year-over-year growth 2024-2029 (%)

11.4.4 Italy - Market size and forecast 2024-2029

Chart on Italy - Market size and forecast 2024-2029 ($ million)
Data Table on Italy - Market size and forecast 2024-2029 ($ million)
Chart on Italy - Year-over-year growth 2024-2029 (%)
Data Table on Italy - Year-over-year growth 2024-2029 (%)

11.4.5 The Netherlands - Market size and forecast 2024-2029

Chart on The Netherlands - Market size and forecast 2024-2029 ($ million)
Data Table on The Netherlands - Market size and forecast 2024-2029 ($ million)
Chart on The Netherlands - Year-over-year growth 2024-2029 (%)
Data Table on The Netherlands - Year-over-year growth 2024-2029 (%)

11.4.6 Spain - Market size and forecast 2024-2029

Chart on Spain - Market size and forecast 2024-2029 ($ million)
Data Table on Spain - Market size and forecast 2024-2029 ($ million)
Chart on Spain - Year-over-year growth 2024-2029 (%)
Data Table on Spain - Year-over-year growth 2024-2029 (%)

11.5 APAC - Market size and forecast 2024-2029

Chart on APAC - Market size and forecast 2024-2029 ($ million)
Data Table on APAC - Market size and forecast 2024-2029 ($ million)
Chart on APAC - Year-over-year growth 2024-2029 (%)
Data Table on APAC - Year-over-year growth 2024-2029 (%)
Chart on Regional Comparison - APAC
Data Table on Regional Comparison - APAC

11.5.1 China - Market size and forecast 2024-2029

Chart on China - Market size and forecast 2024-2029 ($ million)
Data Table on China - Market size and forecast 2024-2029 ($ million)
Chart on China - Year-over-year growth 2024-2029 (%)
Data Table on China - Year-over-year growth 2024-2029 (%)

11.5.2 Japan - Market size and forecast 2024-2029

Chart on Japan - Market size and forecast 2024-2029 ($ million)
Data Table on Japan - Market size and forecast 2024-2029 ($ million)
Chart on Japan - Year-over-year growth 2024-2029 (%)
Data Table on Japan - Year-over-year growth 2024-2029 (%)

11.5.3 India - Market size and forecast 2024-2029

Chart on India - Market size and forecast 2024-2029 ($ million)
Data Table on India - Market size and forecast 2024-2029 ($ million)
Chart on India - Year-over-year growth 2024-2029 (%)
Data Table on India - Year-over-year growth 2024-2029 (%)

11.5.4 South Korea - Market size and forecast 2024-2029

Chart on South Korea - Market size and forecast 2024-2029 ($ million)
Data Table on South Korea - Market size and forecast 2024-2029 ($ million)
Chart on South Korea - Year-over-year growth 2024-2029 (%)
Data Table on South Korea - Year-over-year growth 2024-2029 (%)

11.5.5 Australia - Market size and forecast 2024-2029

Chart on Australia - Market size and forecast 2024-2029 ($ million)
Data Table on Australia - Market size and forecast 2024-2029 ($ million)
Chart on Australia - Year-over-year growth 2024-2029 (%)
Data Table on Australia - Year-over-year growth 2024-2029 (%)

11.5.6 Indonesia - Market size and forecast 2024-2029

Chart on Indonesia - Market size and forecast 2024-2029 ($ million)
Data Table on Indonesia - Market size and forecast 2024-2029 ($ million)
Chart on Indonesia - Year-over-year growth 2024-2029 (%)
Data Table on Indonesia - Year-over-year growth 2024-2029 (%)

11.6 South America - Market size and forecast 2024-2029

Chart on South America - Market size and forecast 2024-2029 ($ million)
Data Table on South America - Market size and forecast 2024-2029 ($ million)
Chart on South America - Year-over-year growth 2024-2029 (%)
Data Table on South America - Year-over-year growth 2024-2029 (%)
Chart on Regional Comparison - South America
Data Table on Regional Comparison - South America

11.6.1 Brazil - Market size and forecast 2024-2029

Chart on Brazil - Market size and forecast 2024-2029 ($ million)
Data Table on Brazil - Market size and forecast 2024-2029 ($ million)
Chart on Brazil - Year-over-year growth 2024-2029 (%)
Data Table on Brazil - Year-over-year growth 2024-2029 (%)

11.6.2 Argentina - Market size and forecast 2024-2029

Chart on Argentina - Market size and forecast 2024-2029 ($ million)
Data Table on Argentina - Market size and forecast 2024-2029 ($ million)
Chart on Argentina - Year-over-year growth 2024-2029 (%)
Data Table on Argentina - Year-over-year growth 2024-2029 (%)

11.6.3 Colombia - Market size and forecast 2024-2029

Chart on Colombia - Market size and forecast 2024-2029 ($ million)
Data Table on Colombia - Market size and forecast 2024-2029 ($ million)
Chart on Colombia - Year-over-year growth 2024-2029 (%)
Data Table on Colombia - Year-over-year growth 2024-2029 (%)

11.7 Middle East and Africa - Market size and forecast 2024-2029

Chart on Middle East and Africa - Market size and forecast 2024-2029 ($ million)
Data Table on Middle East and Africa - Market size and forecast 2024-2029 ($ million)
Chart on Middle East and Africa - Year-over-year growth 2024-2029 (%)
Data Table on Middle East and Africa - Year-over-year growth 2024-2029 (%)
Chart on Regional Comparison - Middle East and Africa
Data Table on Regional Comparison - Middle East and Africa

11.7.1 Saudi Arabia - Market size and forecast 2024-2029

Chart on Saudi Arabia - Market size and forecast 2024-2029 ($ million)
Data Table on Saudi Arabia - Market size and forecast 2024-2029 ($ million)
Chart on Saudi Arabia - Year-over-year growth 2024-2029 (%)
Data Table on Saudi Arabia - Year-over-year growth 2024-2029 (%)

11.7.2 UAE - Market size and forecast 2024-2029

Chart on UAE - Market size and forecast 2024-2029 ($ million)
Data Table on UAE - Market size and forecast 2024-2029 ($ million)
Chart on UAE - Year-over-year growth 2024-2029 (%)
Data Table on UAE - Year-over-year growth 2024-2029 (%)

11.7.3 South Africa - Market size and forecast 2024-2029

Chart on South Africa - Market size and forecast 2024-2029 ($ million)
Data Table on South Africa - Market size and forecast 2024-2029 ($ million)
Chart on South Africa - Year-over-year growth 2024-2029 (%)
Data Table on South Africa - Year-over-year growth 2024-2029 (%)

11.7.4 Israel - Market size and forecast 2024-2029

Chart on Israel - Market size and forecast 2024-2029 ($ million)
Data Table on Israel - Market size and forecast 2024-2029 ($ million)
Chart on Israel - Year-over-year growth 2024-2029 (%)
Data Table on Israel - Year-over-year growth 2024-2029 (%)

11.7.5 Turkey - Market size and forecast 2024-2029

Chart on Turkey - Market size and forecast 2024-2029 ($ million)
Data Table on Turkey - Market size and forecast 2024-2029 ($ million)
Chart on Turkey - Year-over-year growth 2024-2029 (%)
Data Table on Turkey - Year-over-year growth 2024-2029 (%)

11.8 Market opportunity by geography

Market opportunity by geography ($ million)
Data Tables on Market opportunity by geography ($ million)

12. Drivers, Challenges, and Opportunity

12.1 Market drivers

Intensifying industrial demand for next-generation materials
Global sustainability mandate and quest for green materials
Technological convergence of advanced computation, data proliferation, and algorithmic sophistication

12.2 Market challenges

Data scarcity and accessibility
Chasm of synthesizability and experimental validation
High implementation costs and scarcity of interdisciplinary talent

12.3 Impact of drivers and challenges

Impact of drivers and challenges in 2024 and 2029

12.4 Market opportunities

Integration with autonomous laboratories to create closed-loop discovery platforms
Development of domain-specific foundation models for materials science
Shift towards multi-objective and manufacturability-aware design

13. Competitive Landscape

13.1 Overview

13.2

Overview on criticality of inputs and factors of differentiation

13.3 Landscape disruption

Overview on factors of disruption

13.4 Industry risks

Impact of key risks on business

14. Competitive Analysis

14.1 Companies profiled

Companies covered

14.2 Company ranking index

14.3 Market positioning of companies

Matrix on companies position and classification

14.4 Arzeda Corp.

Arzeda Corp. - Overview
Arzeda Corp. - Product / Service
Arzeda Corp. - Key offerings
SWOT

14.5 BASF SE

BASF SE - Overview
BASF SE - Business segments
BASF SE - Key news
BASF SE - Key offerings
BASF SE - Segment focus
SWOT

14.6 Citrine Informatics Inc.

Citrine Informatics Inc. - Overview
Citrine Informatics Inc. - Product / Service
Citrine Informatics Inc. - Key offerings
SWOT

14.7 Dassault Systemes SE

Dassault Systemes SE - Overview
Dassault Systemes SE - Business segments
Dassault Systemes SE - Key news
Dassault Systemes SE - Key offerings
Dassault Systemes SE - Segment focus
SWOT

14.8 DeepMaterials LLC

DeepMaterials LLC - Overview
DeepMaterials LLC - Product / Service
DeepMaterials LLC - Key offerings
SWOT

14.9 Google LLC

Google LLC - Overview
Google LLC - Product / Service
Google LLC - Key offerings
SWOT

14.10 IBM Corp.

IBM Corp. - Overview
IBM Corp. - Business segments
IBM Corp. - Key news
IBM Corp. - Key offerings
IBM Corp. - Segment focus
SWOT

14.11 Mat3ra Inc.

Mat3ra Inc. - Overview
Mat3ra Inc. - Product / Service
Mat3ra Inc. - Key offerings
SWOT

14.12 MaterialsZone Ltd.

MaterialsZone Ltd. - Overview
MaterialsZone Ltd. - Product / Service
MaterialsZone Ltd. - Key offerings
SWOT

14.13 Microsoft Corp.

Microsoft Corp. - Overview
Microsoft Corp. - Business segments
Microsoft Corp. - Key news
Microsoft Corp. - Key offerings
Microsoft Corp. - Segment focus
SWOT

14.14 NVIDIA Corp.

NVIDIA Corp. - Overview
NVIDIA Corp. - Business segments
NVIDIA Corp. - Key news
NVIDIA Corp. - Key offerings
NVIDIA Corp. - Segment focus
SWOT

14.15 Optibrium

Optibrium - Overview
Optibrium - Product / Service
Optibrium - Key offerings
SWOT

14.16 Orbital Materials Inc.

Orbital Materials Inc. - Overview
Orbital Materials Inc. - Product / Service
Orbital Materials Inc. - Key offerings
SWOT

14.17 sandboxAQ

sandboxAQ - Overview
sandboxAQ - Product / Service
sandboxAQ - Key offerings
SWOT

14.18 Schrodinger Inc.

Schrodinger Inc. - Overview
Schrodinger Inc. - Business segments
Schrodinger Inc. - Key offerings
Schrodinger Inc. - Segment focus
SWOT

15. Appendix

15.1 Scope of the report

Market definition
Objectives
Notes and caveats

15.2 Inclusions and exclusions checklist

Inclusions checklist
Exclusions checklist

15.3 Currency conversion rates for US$

15.4 Research methodology

15.5 Data procurement

Information sources

15.6 Data validation

15.7 Validation techniques employed for market sizing

15.8 Data synthesis

15.9 360 degree market analysis

15.10 List of abbreviations

Research Methodology

Technavio presents a detailed picture of the market by way of study, synthesis, and summation of data from multiple sources. The analysts have presented the various facets of the market with a particular focus on identifying the key industry influencers. The data thus presented is comprehensive, reliable, and the result of extensive research, both primary and secondary.

INFORMATION SOURCES

Primary sources

  • Manufacturers and suppliers
  • Channel partners
  • Industry experts
  • Strategic decision makers

Secondary sources

  • Industry journals and periodicals
  • Government data
  • Financial reports of key industry players
  • Historical data
  • Press releases

DATA ANALYSIS

Data Synthesis

  • Collation of data
  • Estimation of key figures
  • Analysis of derived insights

Data Validation

  • Triangulation with data models
  • Reference against proprietary databases
  • Corroboration with industry experts

REPORT WRITING

Qualitative

  • Market drivers
  • Market challenges
  • Market trends
  • Five forces analysis

Quantitative

  • Market size and forecast
  • Market segmentation
  • Geographical insights
  • Competitive landscape

Interested in this report?

Get your sample now to see our research methodology and insights!

Download Now

Frequently Asked Questions

Generative AI In Material Science market growth will increase by USD 1705.3 million during 2025-2029.

The Generative AI In Material Science market is expected to grow at a CAGR of 27.9% during 2025-2029.

Generative AI In Material Science market is segmented by Type (Materials discovery and design, Predictive modeling and simulation, Process optimization) Deployment (Cloud based, On premises, Hybrid) Application (Pharmaceuticals and chemicals, Automotive and aerospace, Electronics and semiconductors, Energy storage and conversion, Others)

Aionics Inc., Arzeda Corp., BASF SE, Citrine Informatics Inc., Dassault Systemes SE, DeepMaterials LLC, Google LLC, IBM Corp., Kebotix Inc., Mat3ra Inc., MaterialsZone Ltd., Microsoft Corp., NVIDIA Corp., Optibrium, Orbital Materials Inc., Phaseshift Inc., Quantum Generative Materials LLC, sandboxAQ, Schrodinger Inc. are a few of the key vendors in the Generative AI In Material Science market.

North America will register the highest growth rate of 46.9% among the other regions. Therefore, the Generative AI In Material Science market in North America is expected to garner significant business opportunities for the vendors during the forecast period.

US, Canada, Mexico, Germany, UK, France, Italy, The Netherlands, Spain, China, Japan, India, South Korea, Australia, Indonesia, Brazil, Argentina, Colombia, Saudi Arabia, UAE, South Africa, Israel, Turkey

  • Intensifying industrial demand for next-generation materials is the driving factor this market.

The Generative AI In Material Science market vendors should focus on grabbing business opportunities from the Type segment as it accounted for the largest market share in the base year.