Geothermal Drilling For Power Generation Market Analysis, Size, and Forecast 2026-2030: APAC (Indonesia, Japan, and China), North America (US, Canada, and Mexico), Europe (Italy, Germany, and France), South America (Argentina and Brazil), Middle East and Africa (Turkey and Saudi Arabia), and Rest of World (ROW)

Geothermal Drilling For Power Generation Market Analysis, Size, and Forecast 2026-2030:
APAC (Indonesia, Japan, and China), North America (US, Canada, and Mexico), Europe (Italy, Germany, and France), South America (Argentina and Brazil), Middle East and Africa (Turkey and Saudi Arabia), and Rest of World (ROW)

Published: Jan 2026 284 Pages SKU: IRTNTR44744

Market Overview at a Glance

$243.5 Mn
Market Opportunity
4.5%
CAGR 2025 - 2030
45.2%
APAC Growth
$515.5 Mn
Binary plants segment 2024

Geothermal Drilling For Power Generation Market Size 2026-2030

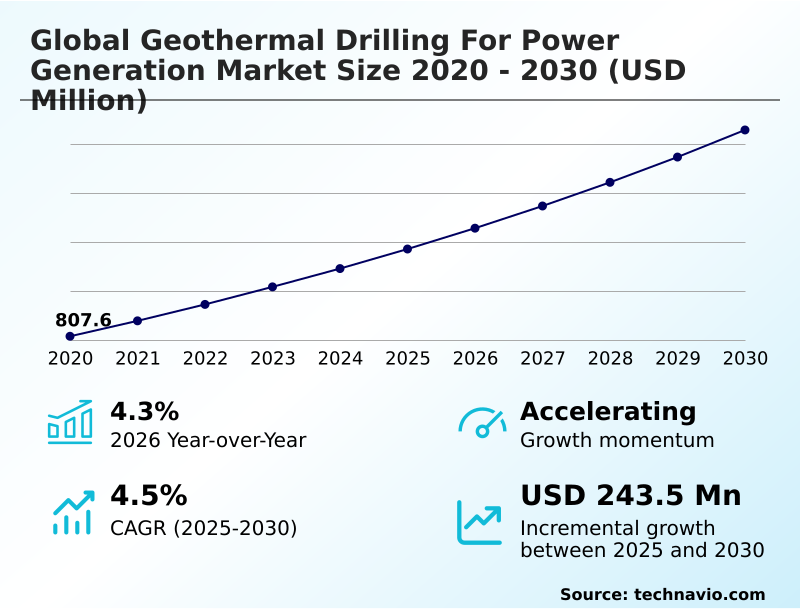
The geothermal drilling for power generation market size is valued to increase by USD 243.5 million, at a CAGR of 4.5% from 2025 to 2030. Global decarbonization mandates and necessity for baseload power will drive the geothermal drilling for power generation market.

Major Market Trends & Insights

  • APAC dominated the market and accounted for a 45.2% growth during the forecast period.
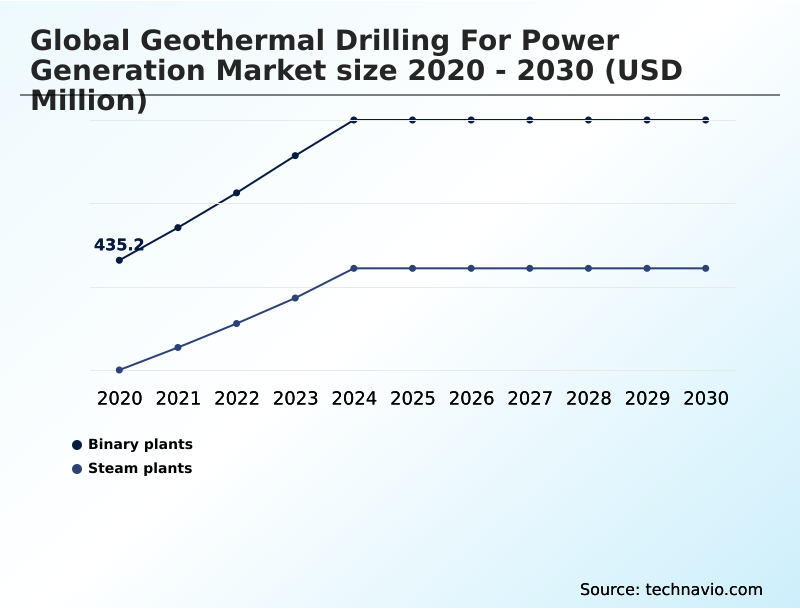
  • By Application - Binary plants segment was valued at USD 515.5 million in 2024
  • By Area - Below 1000m segment accounted for the largest market revenue share in 2024

Market Size & Forecast

  • Market Opportunities: USD 422 million
  • Market Future Opportunities: USD 243.5 million
  • CAGR from 2025 to 2030 : 4.5%

Market Summary

  • The geothermal drilling for power generation market is undergoing a significant transformation, driven by the urgent need for baseload renewable energy. This industry, which focuses on specialized engineering to access the Earth's thermal energy, is moving beyond conventional hydrothermal reservoirs.
  • A key development is the strategic integration of oil and gas expertise, where technologies like advanced directional drilling and subsurface modeling are adapted for geothermal energy extraction. This convergence allows for the development of enhanced geothermal systems, unlocking vast unconventional geothermal resources in previously unviable hot dry rock locations.
  • For instance, a utility provider can leverage these advancements to develop a local geothermal asset, achieving a stable power supply with a capacity factor over 90%, thereby enhancing grid stability and reducing reliance on volatile fossil fuel markets.
  • However, the high initial capital investment and subsurface exploration risk remain considerable barriers, necessitating innovative geothermal project financing and risk-mitigation strategies to sustain momentum.

What will be the Size of the Geothermal Drilling For Power Generation Market during the forecast period?

Get Key Insights on Market Forecast (PDF) Request Free Sample

How is the Geothermal Drilling For Power Generation Market Segmented?

The geothermal drilling for power generation industry research report provides comprehensive data (region-wise segment analysis), with forecasts and estimates in "USD million" for the period 2026-2030, as well as historical data from 2020-2024 for the following segments.

  • Application
    • Binary plants
    • Steam plants
  • Area
    • Below 1000m
    • 1000-2000m
  • Type
    • Production wells
    • Injection wells
    • Slim wells
  • Geography
    • APAC
      • Indonesia
      • Japan
      • China
    • North America
      • US
      • Canada
      • Mexico
    • Europe
      • Italy
      • Germany
      • France
    • South America
      • Argentina
      • Brazil
    • Middle East and Africa
      • Turkey
      • Saudi Arabia
    • Rest of World (ROW)

By Application Insights

The binary plants segment is estimated to witness significant growth during the forecast period.

The binary plants segment is pivotal for expanding the geothermal value chain, enabling power generation from moderate-enthalpy resources previously considered unviable. This approach utilizes secondary fluids and advanced geothermal heat exchangers, requiring specific subsurface engineering and drilling strategies.

Unlike steam plants, binary systems operate in a closed loop, making them integral to a resilient energy portfolio in regions with stringent environmental standards.

The focus is on optimizing drilling operational costs for larger-diameter wells and advanced casing design to accommodate high-volume pumps. Effective geothermal reservoir engineering is crucial to manage fluid flow and prevent thermal breakthrough.

Innovations in high-temperature resilient materials and well stimulation techniques are enhancing system efficiency, with some designs improving heat extraction rates by over 15% and supporting large-scale geothermal district heating networks.

Request Free Sample

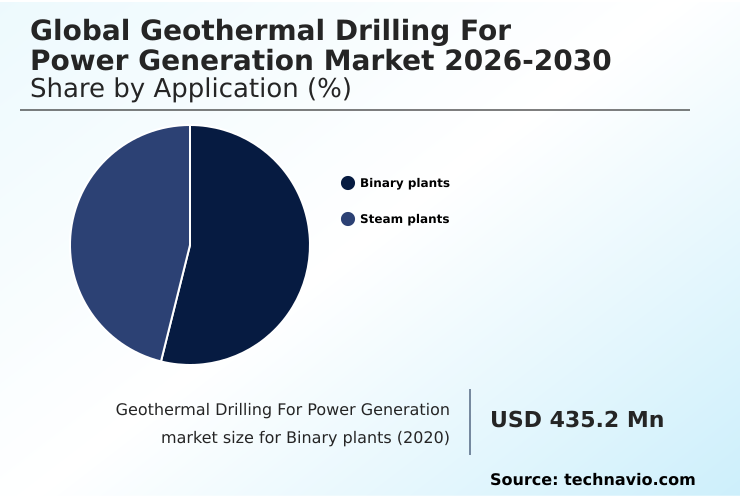
The Binary plants segment was valued at USD 515.5 million in 2024 and showed a gradual increase during the forecast period.

Request Free Sample

Regional Analysis

APAC is estimated to contribute 45.2% to the growth of the global market during the forecast period.Technavio’s analysts have elaborately explained the regional trends and drivers that shape the market during the forecast period.

See How Geothermal Drilling For Power Generation Market Demand is Rising in APAC Request Free Sample

The regions covered in the Global Geothermal Drilling For Power Generation Market 2026-2030 are APAC, North America, Europe, South America, and Middle East and Africa. APAC is the key region, contributing over 45% of incremental growth.

This expansion is driven by vast resources along the Pacific Ring of Fire, particularly in Indonesia and The Philippines, focusing on high-pressure steam for geothermal well construction.

In North America, the focus is on Enhanced Geothermal Systems (EGS) in hot dry rock formations, leveraging drilling rig automation to improve efficiency.

Meanwhile, the Middle East and Africa, especially along the East African Rift in Kenya, is a major growth frontier.

This diverse geopolitical landscape dictates varied approaches to drilling and geothermal asset management, from optimizing production well and injection well systems in mature fields to using advanced polycrystalline diamond compact bits to increase the drilling rate of penetration in new explorations.

Market Dynamics

Our researchers analyzed the data with 2025 as the base year, along with the key drivers, trends, and challenges. A holistic analysis of drivers will help companies refine their marketing strategies to gain a competitive advantage.

  • Strategic decision-making in the geothermal sector increasingly revolves around complex technical and financial trade-offs. The debate over enhanced geothermal systems vs hydrothermal projects highlights this, with the former offering broader geographic potential but facing challenges in hot dry rock drilling.
  • Stakeholders are intensely focused on the cost of deep geothermal drilling per foot and finding ways to improve the rate of penetration in hard rock. A critical operational concern is minimizing induced seismicity in geothermal projects, which requires sophisticated real-time data analytics in geothermal drilling and advanced monitoring.
  • Material science plays a crucial role, with ongoing R&D for materials for corrosive geothermal environments and casing design for thermal expansion. The efficiency of drilling automation for geothermal wells is now a key performance indicator, with automated systems reducing certain operational risks by over 50% compared to manual methods.
  • Optimizing geothermal wellbore placement through better subsurface data is directly linked to mitigating investment risks in geothermal exploration. Furthermore, the effectiveness of different geothermal well stimulation methods is central to managing thermal breakthrough in reservoirs and ensuring the long-term viability of geothermal power for baseload electricity demand, whether from a binary plant vs steam plant geothermal configuration.
  • The industry's evolution hinges on innovations that address these long-tail challenges.

What are the key market drivers leading to the rise in the adoption of Geothermal Drilling For Power Generation Industry?

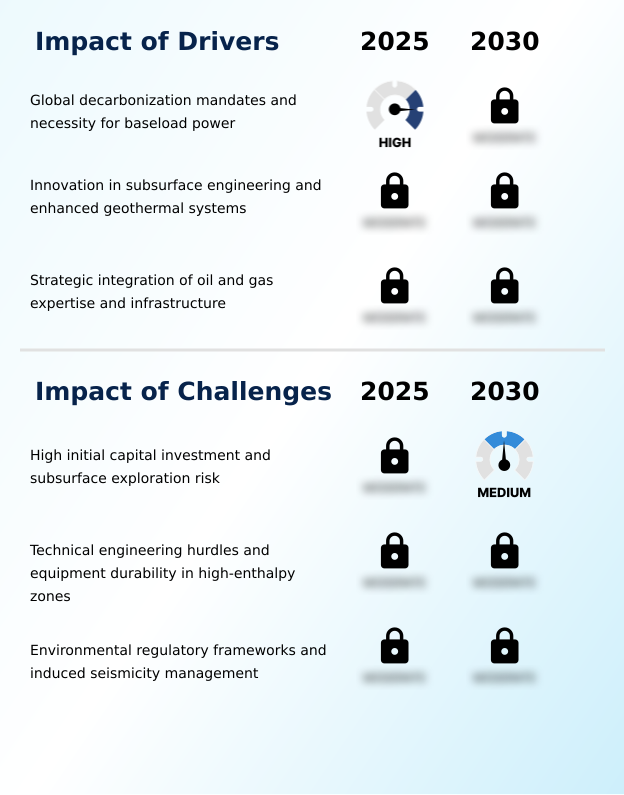
  • The market is primarily driven by global decarbonization mandates and the increasing necessity for reliable, continuous baseload power.

  • Global decarbonization mandates and the need for baseload renewable energy are primary drivers for the geothermal power generation market.
  • Enhanced geothermal systems (EGS) are expanding viability beyond traditional hydrothermal reservoirs, enabled by the strategic integration of oil and gas expertise in directional drilling and advanced subsurface modeling.
  • These technologies improve geothermal energy extraction efficiency, providing essential grid stability solutions with capacity factors often exceeding 90%. This reliability makes geothermal a critical source of baseload power, unlike intermittent renewables.
  • Repurposing existing oil and gas infrastructure for geothermal applications further accelerates deployment, potentially reducing initial project capital by up to 40% and supporting a faster transition to clean energy.

What are the market trends shaping the Geothermal Drilling For Power Generation Industry?

  • A key market trend is the integration of high-temperature resilient materials and next-generation sensors, which enables drilling operations in extreme thermal environments.

  • A transformative trend in geothermal drilling for power generation is the move toward deep geothermal drilling to access unconventional geothermal resources. This involves the development of non-mechanical drilling methods like millimeter-wave drilling and plasma drilling, which promise to penetrate hard rock at rates up to 300% faster than conventional techniques.
  • Cross-industry technological convergence is fueling advancements in high pressure high temperature (HPHT) environments, particularly with next-generation sensors and downhole electronics capable of withstanding extreme conditions. The objective is to tap into supercritical fluids, unlocking immense energy potential and fundamentally altering the economics of sustainable energy infrastructure.
  • This push beyond traditional boundaries is critical for making baseload renewable energy a globally scalable solution.

What challenges does the Geothermal Drilling For Power Generation Industry face during its growth?

  • High initial capital investment and significant subsurface exploration risk present a key challenge to industry growth.

  • The sector faces significant hurdles, primarily the high initial capital investment and subsurface exploration risk associated with unproven fields, where success rates can be below 50%. Securing geothermal project financing is complicated by these uncertainties and complex environmental regulatory frameworks.
  • Technical challenges persist in high-enthalpy geothermal zones, where aggressive geothermal fluid chemistry necessitates the use of expensive corrosion resistant alloys and advanced cementing technology to ensure long-term wellbore stability.
  • Furthermore, managing public perception and regulatory compliance around induced seismicity monitoring adds layers of cost and time, with permitting processes in some regions extending project timelines by multiple years, impacting both flash steam power plants and newer EGS projects.

Exclusive Technavio Analysis on Customer Landscape

The geothermal drilling for power generation market forecasting report includes the adoption lifecycle of the market, covering from the innovator’s stage to the laggard’s stage. It focuses on adoption rates in different regions based on penetration. Furthermore, the geothermal drilling for power generation market report also includes key purchase criteria and drivers of price sensitivity to help companies evaluate and develop their market growth analysis strategies.

Customer Landscape of Geothermal Drilling For Power Generation Industry

Competitive Landscape

Companies are implementing various strategies, such as strategic alliances, geothermal drilling for power generation market forecast, partnerships, mergers and acquisitions, geographical expansion, and product/service launches, to enhance their presence in the industry.

Baker Hughes Co. - Offers integrated solutions for geothermal well construction, specializing in advanced directional drilling and high-temperature fluid management for enhanced geothermal systems (EGS).

The industry research and growth report includes detailed analyses of the competitive landscape of the market and information about key companies, including:

  • Baker Hughes Co.
  • Deep Rock Manufacturing Co.
  • Eavor Technologies Inc.
  • Fervo Energy
  • Fraste Spa
  • GA Drilling AS
  • Geotech Drilling Services Ltd.
  • Gill Rock Drill Co. Inc.
  • Halliburton Co.
  • Huisman Equipment BV
  • Marton Geotechnical Services Ltd
  • Ormat Technologies Inc.
  • PT Pertamina Persero
  • Quaise Energy Inc.
  • Schlumberger Ltd.
  • SIMCO Drilling Equipment Inc.
  • STDS Jantz GmbH and Co.
  • Versa Drill

Qualitative and quantitative analysis of companies has been conducted to help clients understand the wider business environment as well as the strengths and weaknesses of key industry players. Data is qualitatively analyzed to categorize companies as pure play, category-focused, industry-focused, and diversified; it is quantitatively analyzed to categorize companies as dominant, leading, strong, tentative, and weak.

Recent Development and News in Geothermal drilling for power generation market

  • In November 2025, GA Drilling conducted a successful field demonstration of its proprietary plasma-drilling technology in a deep-hole test facility in the United Kingdom, penetrating high-strength metamorphic rock significantly faster than conventional methods.
  • In August 2025, Fervo Energy collaborated with a major petroleum engineering firm to complete a horizontal drilling campaign in a deep granite formation in Utah, using directional drilling and high-temperature bits to create an artificial fracture network.
  • In May 2025, SLB completed a series of high-capacity production wells in the Salton Sea region, employing a proprietary corrosion-resistant casing technology for continuous operation in hyper-saline environments.
  • In March 2025, The European Union ratified the Baseload Resilience Act, a policy framework providing significant financial guarantees for deep-well drilling projects aimed at replacing coal-fired facilities with geothermal energy.

Dive into Technavio’s robust research methodology, blending expert interviews, extensive data synthesis, and validated models for unparalleled Geothermal Drilling For Power Generation Market insights. See full methodology.

Market Scope
Page number 284
Base year 2025
Historic period 2020-2024
Forecast period 2026-2030
Growth momentum & CAGR Accelerate at a CAGR of 4.5%
Market growth 2026-2030 USD 243.5 million
Market structure Fragmented
YoY growth 2025-2026(%) 4.3%
Key countries Indonesia, The Philippines, Japan, China, India, Australia, US, Canada, Mexico, Iceland, Italy, Germany, France, Portugal, Greece, Chile, Argentina, Brazil, Turkey, Egypt, Kenya, Ethiopia and Saudi Arabia
Competitive landscape Leading Companies, Market Positioning of Companies, Competitive Strategies, and Industry Risks

Request Free Sample

Research Analyst Overview

  • The geothermal drilling for power generation market is advancing through critical technological breakthroughs and strategic shifts. Its evolution is defined by the push into deeper, hotter, and more complex geological settings, which necessitates innovations in high-temperature drilling and wellbore stability. The development of enhanced geothermal systems is pivotal, allowing access to vast hot dry rock resources beyond traditional hydrothermal reservoirs.
  • This requires sophisticated subsurface modeling and well stimulation techniques. A significant boardroom-level consideration is the budgeting for specialized equipment, such as corrosion resistant alloys and advanced cementing technology, to ensure the longevity of wells in harsh environments. Advanced subsurface modeling has demonstrated the potential to increase exploration success rates by up to 20%, directly impacting capital risk.
  • As the industry matures, the focus on efficient reservoir management, including managing thermal breakthrough and optimizing injection well and production well performance, becomes paramount for sustainable geothermal asset management and long-term profitability.

What are the Key Data Covered in this Geothermal Drilling For Power Generation Market Research and Growth Report?

  • What is the expected growth of the Geothermal Drilling For Power Generation Market between 2026 and 2030?

    • USD 243.5 million, at a CAGR of 4.5%

  • What segmentation does the market report cover?

    • The report is segmented by Application (Binary plants, and Steam plants), Area (Below 1000m, and 1000-2000m), Type (Production wells, Injection wells, and Slim wells) and Geography (APAC, North America, Europe, South America, Middle East and Africa)

  • Which regions are analyzed in the report?

    • APAC, North America, Europe, South America and Middle East and Africa

  • What are the key growth drivers and market challenges?

    • Global decarbonization mandates and necessity for baseload power, High initial capital investment and subsurface exploration risk

  • Who are the major players in the Geothermal Drilling For Power Generation Market?

    • Baker Hughes Co., Deep Rock Manufacturing Co., Eavor Technologies Inc., Fervo Energy, Fraste Spa, GA Drilling AS, Geotech Drilling Services Ltd., Gill Rock Drill Co. Inc., Halliburton Co., Huisman Equipment BV, Marton Geotechnical Services Ltd, Ormat Technologies Inc., PT Pertamina Persero, Quaise Energy Inc., Schlumberger Ltd., SIMCO Drilling Equipment Inc., STDS Jantz GmbH and Co. and Versa Drill

Market Research Insights

  • The market dynamics for geothermal power generation are shaped by a push for resilient energy portfolios and technological convergence. The strategic integration of oil and gas expertise is a important factor, as advanced drilling methodologies originally for hydrocarbons are now unlocking unconventional geothermal resources.
  • This cross-industry technological convergence allows for more efficient geothermal well construction, with advanced telemetry systems reducing non-productive drilling time by up to 15%. This improves the economic case for deep geothermal drilling. As decarbonization mandates intensify, the value of geothermal as a source of baseload renewable energy increases, providing unique grid stability solutions.
  • The focus on sustainable energy infrastructure is compelling a re-evaluation of high initial capital investment against the long-term benefits of energy independence and price stability, with geothermal offering a levelized cost of energy that is becoming increasingly competitive with conventional power sources.

We can help! Our analysts can customize this geothermal drilling for power generation market research report to meet your requirements.

Get in touch

1. Executive Summary

1.1 Market overview

Executive Summary - Chart on Market Overview
Executive Summary - Data Table on Market Overview
Executive Summary - Chart on Global Market Characteristics
Executive Summary - Chart on Market by Geography
Executive Summary - Chart on Market Segmentation by Application
Executive Summary - Chart on Market Segmentation by Area
Executive Summary - Chart on Market Segmentation by Type
Executive Summary - Chart on Incremental Growth
Executive Summary - Data Table on Incremental Growth
Executive Summary - Chart on Company Market Positioning

2. Technavio Analysis

2.1 Analysis of price sensitivity, lifecycle, customer purchase basket, adoption rates, and purchase criteria

2.2 Criticality of inputs and Factors of differentiation

Chart on Overview on criticality of inputs and factors of differentiation

2.3 Factors of disruption

Chart on Overview on factors of disruption

2.4 Impact of drivers and challenges

Chart on Impact of drivers and challenges in 2025 and 2030

3. Market Landscape

3.1 Market ecosystem

Chart on Parent Market
Data Table on - Parent Market

3.2 Market characteristics

Chart on Market characteristics analysis

3.3 Value chain analysis

Chart on Value chain analysis

4. Market Sizing

4.1 Market definition

Data Table on Offerings of companies included in the market definition

4.2 Market segment analysis

Market segments

4.3 Market size 2025

4.4 Market outlook: Forecast for 2025-2030

Chart on Global - Market size and forecast 2025-2030 ($ million)
Data Table on Global - Market size and forecast 2025-2030 ($ million)
Chart on Global Market: Year-over-year growth 2025-2030 (%)
Data Table on Global Market: Year-over-year growth 2025-2030 (%)

5. Historic Market Size

5.1 Global Geothermal Drilling For Power Generation Market 2020 - 2024

Historic Market Size - Data Table on Global Geothermal Drilling For Power Generation Market 2020 - 2024 ($ million)

5.2 Application segment analysis 2020 - 2024

Historic Market Size - Application Segment 2020 - 2024 ($ million)

5.3 Area segment analysis 2020 - 2024

Historic Market Size - Area Segment 2020 - 2024 ($ million)

5.4 Type segment analysis 2020 - 2024

Historic Market Size - Type Segment 2020 - 2024 ($ million)

5.5 Geography segment analysis 2020 - 2024

Historic Market Size - Geography Segment 2020 - 2024 ($ million)

5.6 Country segment analysis 2020 - 2024

Historic Market Size - Country Segment 2020 - 2024 ($ million)

6. Qualitative Analysis

6.1 The AI impact on Global Geothermal Drilling for Power Generation Market

7. Five Forces Analysis

7.1 Five forces summary

Five forces analysis - Comparison between 2025 and 2030

7.2 Bargaining power of buyers

Bargaining power of buyers - Impact of key factors 2025 and 2030

7.3 Bargaining power of suppliers

Bargaining power of suppliers - Impact of key factors in 2025 and 2030

7.4 Threat of new entrants

Threat of new entrants - Impact of key factors in 2025 and 2030

7.5 Threat of substitutes

Threat of substitutes - Impact of key factors in 2025 and 2030

7.6 Threat of rivalry

Threat of rivalry - Impact of key factors in 2025 and 2030

7.7 Market condition

Chart on Market condition - Five forces 2025 and 2030

8. Market Segmentation by Application

8.1 Market segments

Chart on Application - Market share 2025-2030 (%)
Data Table on Application - Market share 2025-2030 (%)

8.2 Comparison by Application

Chart on Comparison by Application
Data Table on Comparison by Application

8.3 Binary plants - Market size and forecast 2025-2030

Chart on Binary plants - Market size and forecast 2025-2030 ($ million)
Data Table on Binary plants - Market size and forecast 2025-2030 ($ million)
Chart on Binary plants - Year-over-year growth 2025-2030 (%)
Data Table on Binary plants - Year-over-year growth 2025-2030 (%)

8.4 Steam plants - Market size and forecast 2025-2030

Chart on Steam plants - Market size and forecast 2025-2030 ($ million)
Data Table on Steam plants - Market size and forecast 2025-2030 ($ million)
Chart on Steam plants - Year-over-year growth 2025-2030 (%)
Data Table on Steam plants - Year-over-year growth 2025-2030 (%)

8.5 Market opportunity by Application

Market opportunity by Application ($ million)
Data Table on Market opportunity by Application ($ million)

9. Market Segmentation by Area

9.1 Market segments

Chart on Area - Market share 2025-2030 (%)
Data Table on Area - Market share 2025-2030 (%)

9.2 Comparison by Area

Chart on Comparison by Area
Data Table on Comparison by Area

9.3 Below 1000m - Market size and forecast 2025-2030

Chart on Below 1000m - Market size and forecast 2025-2030 ($ million)
Data Table on Below 1000m - Market size and forecast 2025-2030 ($ million)
Chart on Below 1000m - Year-over-year growth 2025-2030 (%)
Data Table on Below 1000m - Year-over-year growth 2025-2030 (%)

9.4 1000-2000m - Market size and forecast 2025-2030

Chart on 1000-2000m - Market size and forecast 2025-2030 ($ million)
Data Table on 1000-2000m - Market size and forecast 2025-2030 ($ million)
Chart on 1000-2000m - Year-over-year growth 2025-2030 (%)
Data Table on 1000-2000m - Year-over-year growth 2025-2030 (%)

9.5 Market opportunity by Area

Market opportunity by Area ($ million)
Data Table on Market opportunity by Area ($ million)

10. Market Segmentation by Type

10.1 Market segments

Chart on Type - Market share 2025-2030 (%)
Data Table on Type - Market share 2025-2030 (%)

10.2 Comparison by Type

Chart on Comparison by Type
Data Table on Comparison by Type

10.3 Production wells - Market size and forecast 2025-2030

Chart on Production wells - Market size and forecast 2025-2030 ($ million)
Data Table on Production wells - Market size and forecast 2025-2030 ($ million)
Chart on Production wells - Year-over-year growth 2025-2030 (%)
Data Table on Production wells - Year-over-year growth 2025-2030 (%)

10.4 Injection wells - Market size and forecast 2025-2030

Chart on Injection wells - Market size and forecast 2025-2030 ($ million)
Data Table on Injection wells - Market size and forecast 2025-2030 ($ million)
Chart on Injection wells - Year-over-year growth 2025-2030 (%)
Data Table on Injection wells - Year-over-year growth 2025-2030 (%)

10.5 Slim wells - Market size and forecast 2025-2030

Chart on Slim wells - Market size and forecast 2025-2030 ($ million)
Data Table on Slim wells - Market size and forecast 2025-2030 ($ million)
Chart on Slim wells - Year-over-year growth 2025-2030 (%)
Data Table on Slim wells - Year-over-year growth 2025-2030 (%)

10.6 Market opportunity by Type

Market opportunity by Type ($ million)
Data Table on Market opportunity by Type ($ million)

11. Customer Landscape

11.1 Customer landscape overview

Analysis of price sensitivity, lifecycle, customer purchase basket, adoption rates, and purchase criteria

12. Geographic Landscape

12.1 Geographic segmentation

Chart on Market share by geography 2025-2030 (%)
Data Table on Market share by geography 2025-2030 (%)

12.2 Geographic comparison

Chart on Geographic comparison
Data Table on Geographic comparison

12.3 APAC - Market size and forecast 2025-2030

Chart on APAC - Market size and forecast 2025-2030 ($ million)
Data Table on APAC - Market size and forecast 2025-2030 ($ million)
Chart on APAC - Year-over-year growth 2025-2030 (%)
Data Table on APAC - Year-over-year growth 2025-2030 (%)
Chart on Regional Comparison - APAC
Data Table on Regional Comparison - APAC

12.3.1 Indonesia - Market size and forecast 2025-2030

Chart on Indonesia - Market size and forecast 2025-2030 ($ million)
Data Table on Indonesia - Market size and forecast 2025-2030 ($ million)
Chart on Indonesia - Year-over-year growth 2025-2030 (%)
Data Table on Indonesia - Year-over-year growth 2025-2030 (%)

12.3.2 The Philippines - Market size and forecast 2025-2030

Chart on The Philippines - Market size and forecast 2025-2030 ($ million)
Data Table on The Philippines - Market size and forecast 2025-2030 ($ million)
Chart on The Philippines - Year-over-year growth 2025-2030 (%)
Data Table on The Philippines - Year-over-year growth 2025-2030 (%)

12.3.3 Japan - Market size and forecast 2025-2030

Chart on Japan - Market size and forecast 2025-2030 ($ million)
Data Table on Japan - Market size and forecast 2025-2030 ($ million)
Chart on Japan - Year-over-year growth 2025-2030 (%)
Data Table on Japan - Year-over-year growth 2025-2030 (%)

12.3.4 China - Market size and forecast 2025-2030

Chart on China - Market size and forecast 2025-2030 ($ million)
Data Table on China - Market size and forecast 2025-2030 ($ million)
Chart on China - Year-over-year growth 2025-2030 (%)
Data Table on China - Year-over-year growth 2025-2030 (%)

12.3.5 India - Market size and forecast 2025-2030

Chart on India - Market size and forecast 2025-2030 ($ million)
Data Table on India - Market size and forecast 2025-2030 ($ million)
Chart on India - Year-over-year growth 2025-2030 (%)
Data Table on India - Year-over-year growth 2025-2030 (%)

12.3.6 Australia - Market size and forecast 2025-2030

Chart on Australia - Market size and forecast 2025-2030 ($ million)
Data Table on Australia - Market size and forecast 2025-2030 ($ million)
Chart on Australia - Year-over-year growth 2025-2030 (%)
Data Table on Australia - Year-over-year growth 2025-2030 (%)

12.4 North America - Market size and forecast 2025-2030

Chart on North America - Market size and forecast 2025-2030 ($ million)
Data Table on North America - Market size and forecast 2025-2030 ($ million)
Chart on North America - Year-over-year growth 2025-2030 (%)
Data Table on North America - Year-over-year growth 2025-2030 (%)
Chart on Regional Comparison - North America
Data Table on Regional Comparison - North America

12.4.1 US - Market size and forecast 2025-2030

Chart on US - Market size and forecast 2025-2030 ($ million)
Data Table on US - Market size and forecast 2025-2030 ($ million)
Chart on US - Year-over-year growth 2025-2030 (%)
Data Table on US - Year-over-year growth 2025-2030 (%)

12.4.2 Canada - Market size and forecast 2025-2030

Chart on Canada - Market size and forecast 2025-2030 ($ million)
Data Table on Canada - Market size and forecast 2025-2030 ($ million)
Chart on Canada - Year-over-year growth 2025-2030 (%)
Data Table on Canada - Year-over-year growth 2025-2030 (%)

12.4.3 Mexico - Market size and forecast 2025-2030

Chart on Mexico - Market size and forecast 2025-2030 ($ million)
Data Table on Mexico - Market size and forecast 2025-2030 ($ million)
Chart on Mexico - Year-over-year growth 2025-2030 (%)
Data Table on Mexico - Year-over-year growth 2025-2030 (%)

12.5 Europe - Market size and forecast 2025-2030

Chart on Europe - Market size and forecast 2025-2030 ($ million)
Data Table on Europe - Market size and forecast 2025-2030 ($ million)
Chart on Europe - Year-over-year growth 2025-2030 (%)
Data Table on Europe - Year-over-year growth 2025-2030 (%)
Chart on Regional Comparison - Europe
Data Table on Regional Comparison - Europe

12.5.1 Iceland - Market size and forecast 2025-2030

Chart on Iceland - Market size and forecast 2025-2030 ($ million)
Data Table on Iceland - Market size and forecast 2025-2030 ($ million)
Chart on Iceland - Year-over-year growth 2025-2030 (%)
Data Table on Iceland - Year-over-year growth 2025-2030 (%)

12.5.2 Italy - Market size and forecast 2025-2030

Chart on Italy - Market size and forecast 2025-2030 ($ million)
Data Table on Italy - Market size and forecast 2025-2030 ($ million)
Chart on Italy - Year-over-year growth 2025-2030 (%)
Data Table on Italy - Year-over-year growth 2025-2030 (%)

12.5.3 Germany - Market size and forecast 2025-2030

Chart on Germany - Market size and forecast 2025-2030 ($ million)
Data Table on Germany - Market size and forecast 2025-2030 ($ million)
Chart on Germany - Year-over-year growth 2025-2030 (%)
Data Table on Germany - Year-over-year growth 2025-2030 (%)

12.5.4 France - Market size and forecast 2025-2030

Chart on France - Market size and forecast 2025-2030 ($ million)
Data Table on France - Market size and forecast 2025-2030 ($ million)
Chart on France - Year-over-year growth 2025-2030 (%)
Data Table on France - Year-over-year growth 2025-2030 (%)

12.5.5 Portugal - Market size and forecast 2025-2030

Chart on Portugal - Market size and forecast 2025-2030 ($ million)
Data Table on Portugal - Market size and forecast 2025-2030 ($ million)
Chart on Portugal - Year-over-year growth 2025-2030 (%)
Data Table on Portugal - Year-over-year growth 2025-2030 (%)

12.5.6 Greece - Market size and forecast 2025-2030

Chart on Greece - Market size and forecast 2025-2030 ($ million)
Data Table on Greece - Market size and forecast 2025-2030 ($ million)
Chart on Greece - Year-over-year growth 2025-2030 (%)
Data Table on Greece - Year-over-year growth 2025-2030 (%)

12.6 South America - Market size and forecast 2025-2030

Chart on South America - Market size and forecast 2025-2030 ($ million)
Data Table on South America - Market size and forecast 2025-2030 ($ million)
Chart on South America - Year-over-year growth 2025-2030 (%)
Data Table on South America - Year-over-year growth 2025-2030 (%)
Chart on Regional Comparison - South America
Data Table on Regional Comparison - South America

12.6.1 Chile - Market size and forecast 2025-2030

Chart on Chile - Market size and forecast 2025-2030 ($ million)
Data Table on Chile - Market size and forecast 2025-2030 ($ million)
Chart on Chile - Year-over-year growth 2025-2030 (%)
Data Table on Chile - Year-over-year growth 2025-2030 (%)

12.6.2 Argentina - Market size and forecast 2025-2030

Chart on Argentina - Market size and forecast 2025-2030 ($ million)
Data Table on Argentina - Market size and forecast 2025-2030 ($ million)
Chart on Argentina - Year-over-year growth 2025-2030 (%)
Data Table on Argentina - Year-over-year growth 2025-2030 (%)

12.6.3 Brazil - Market size and forecast 2025-2030

Chart on Brazil - Market size and forecast 2025-2030 ($ million)
Data Table on Brazil - Market size and forecast 2025-2030 ($ million)
Chart on Brazil - Year-over-year growth 2025-2030 (%)
Data Table on Brazil - Year-over-year growth 2025-2030 (%)

12.7 Middle East and Africa - Market size and forecast 2025-2030

Chart on Middle East and Africa - Market size and forecast 2025-2030 ($ million)
Data Table on Middle East and Africa - Market size and forecast 2025-2030 ($ million)
Chart on Middle East and Africa - Year-over-year growth 2025-2030 (%)
Data Table on Middle East and Africa - Year-over-year growth 2025-2030 (%)
Chart on Regional Comparison - Middle East and Africa
Data Table on Regional Comparison - Middle East and Africa

12.7.1 Turkey - Market size and forecast 2025-2030

Chart on Turkey - Market size and forecast 2025-2030 ($ million)
Data Table on Turkey - Market size and forecast 2025-2030 ($ million)
Chart on Turkey - Year-over-year growth 2025-2030 (%)
Data Table on Turkey - Year-over-year growth 2025-2030 (%)

12.7.2 Egypt - Market size and forecast 2025-2030

Chart on Egypt - Market size and forecast 2025-2030 ($ million)
Data Table on Egypt - Market size and forecast 2025-2030 ($ million)
Chart on Egypt - Year-over-year growth 2025-2030 (%)
Data Table on Egypt - Year-over-year growth 2025-2030 (%)

12.7.3 Kenya - Market size and forecast 2025-2030

Chart on Kenya - Market size and forecast 2025-2030 ($ million)
Data Table on Kenya - Market size and forecast 2025-2030 ($ million)
Chart on Kenya - Year-over-year growth 2025-2030 (%)
Data Table on Kenya - Year-over-year growth 2025-2030 (%)

12.7.4 Ethiopia - Market size and forecast 2025-2030

Chart on Ethiopia - Market size and forecast 2025-2030 ($ million)
Data Table on Ethiopia - Market size and forecast 2025-2030 ($ million)
Chart on Ethiopia - Year-over-year growth 2025-2030 (%)
Data Table on Ethiopia - Year-over-year growth 2025-2030 (%)

12.7.5 Saudi Arabia - Market size and forecast 2025-2030

Chart on Saudi Arabia - Market size and forecast 2025-2030 ($ million)
Data Table on Saudi Arabia - Market size and forecast 2025-2030 ($ million)
Chart on Saudi Arabia - Year-over-year growth 2025-2030 (%)
Data Table on Saudi Arabia - Year-over-year growth 2025-2030 (%)

12.8 Market opportunity by geography

Market opportunity by geography ($ million)
Data Tables on Market opportunity by geography ($ million)

13. Drivers, Challenges, and Opportunity

13.1 Market drivers

Global decarbonization mandates and necessity for baseload power
Innovation in subsurface engineering and enhanced geothermal systems
Strategic integration of oil and gas expertise and infrastructure

13.2 Market challenges

High initial capital investment and subsurface exploration risk
Technical engineering hurdles and equipment durability in high-enthalpy zones
Environmental regulatory frameworks and induced seismicity management

13.3 Impact of drivers and challenges

Impact of drivers and challenges in 2025 and 2030

13.4 Market opportunities

Integration of high-temperature resilient materials and next-generation sensors
Cross-industry technological convergence with hydrocarbon sector
Deployment of millimeter-wave and non-mechanical drilling technologies

14. Competitive Landscape

14.1 Overview

14.2

Overview on criticality of inputs and factors of differentiation

14.3 Landscape disruption

Overview on factors of disruption

14.4 Industry risks

Impact of key risks on business

15. Competitive Analysis

15.1 Companies profiled

Companies covered

15.2 Company ranking index

15.3 Market positioning of companies

Matrix on companies position and classification

15.4 Baker Hughes Co.

Baker Hughes Co. - Overview
Baker Hughes Co. - Business segments
Baker Hughes Co. - Key news
Baker Hughes Co. - Key offerings
Baker Hughes Co. - Segment focus
SWOT

15.5 Deep Rock Manufacturing Co.

Deep Rock Manufacturing Co. - Overview
Deep Rock Manufacturing Co. - Product / Service
Deep Rock Manufacturing Co. - Key offerings
SWOT

15.6 Fraste Spa

Fraste Spa - Overview
Fraste Spa - Product / Service
Fraste Spa - Key offerings
SWOT

15.7 GA Drilling AS

GA Drilling AS - Overview
GA Drilling AS - Product / Service
GA Drilling AS - Key offerings
SWOT

15.8 Geotech Drilling Services Ltd.

Geotech Drilling Services Ltd. - Overview
Geotech Drilling Services Ltd. - Product / Service
Geotech Drilling Services Ltd. - Key offerings
SWOT

15.9 Gill Rock Drill Co. Inc.

Gill Rock Drill Co. Inc. - Overview
Gill Rock Drill Co. Inc. - Product / Service
Gill Rock Drill Co. Inc. - Key offerings
SWOT

15.10 Halliburton Co.

Halliburton Co. - Overview
Halliburton Co. - Business segments
Halliburton Co. - Key news
Halliburton Co. - Key offerings
Halliburton Co. - Segment focus
SWOT

15.11 Huisman Equipment BV

Huisman Equipment BV - Overview
Huisman Equipment BV - Product / Service
Huisman Equipment BV - Key offerings
SWOT

15.12 Marton Geotechnical Services Ltd

Marton Geotechnical Services Ltd - Overview
Marton Geotechnical Services Ltd - Product / Service
Marton Geotechnical Services Ltd - Key offerings
SWOT

15.13 Ormat Technologies Inc.

Ormat Technologies Inc. - Overview
Ormat Technologies Inc. - Business segments
Ormat Technologies Inc. - Key offerings
Ormat Technologies Inc. - Segment focus
SWOT

15.14 PT Pertamina Persero

PT Pertamina Persero - Overview
PT Pertamina Persero - Product / Service
PT Pertamina Persero - Key offerings
SWOT

15.15 Quaise Energy Inc.

Quaise Energy Inc. - Overview
Quaise Energy Inc. - Product / Service
Quaise Energy Inc. - Key offerings
SWOT

15.16 Schlumberger Ltd.

Schlumberger Ltd. - Overview
Schlumberger Ltd. - Business segments
Schlumberger Ltd. - Key news
Schlumberger Ltd. - Key offerings
Schlumberger Ltd. - Segment focus
SWOT

15.17 SIMCO Drilling Equipment Inc.

SIMCO Drilling Equipment Inc. - Overview
SIMCO Drilling Equipment Inc. - Product / Service
SIMCO Drilling Equipment Inc. - Key offerings
SWOT

15.18 Versa Drill

Versa Drill - Overview
Versa Drill - Product / Service
Versa Drill - Key offerings
SWOT

16. Appendix

16.1 Scope of the report

Market definition
Objectives
Notes and caveats

16.2 Inclusions and exclusions checklist

Inclusions checklist
Exclusions checklist

16.3 Currency conversion rates for US$

16.4 Research methodology

16.5 Data procurement

Information sources

16.6 Data validation

16.7 Validation techniques employed for market sizing

16.8 Data synthesis

16.9 360 degree market analysis

16.10 List of abbreviations

Research Methodology

Technavio presents a detailed picture of the market by way of study, synthesis, and summation of data from multiple sources. The analysts have presented the various facets of the market with a particular focus on identifying the key industry influencers. The data thus presented is comprehensive, reliable, and the result of extensive research, both primary and secondary.

INFORMATION SOURCES

Primary sources

  • Manufacturers and suppliers
  • Channel partners
  • Industry experts
  • Strategic decision makers

Secondary sources

  • Industry journals and periodicals
  • Government data
  • Financial reports of key industry players
  • Historical data
  • Press releases

DATA ANALYSIS

Data Synthesis

  • Collation of data
  • Estimation of key figures
  • Analysis of derived insights

Data Validation

  • Triangulation with data models
  • Reference against proprietary databases
  • Corroboration with industry experts

REPORT WRITING

Qualitative

  • Market drivers
  • Market challenges
  • Market trends
  • Five forces analysis

Quantitative

  • Market size and forecast
  • Market segmentation
  • Geographical insights
  • Competitive landscape

Interested in this report?

Get your sample now to see our research methodology and insights!

Download Now

Frequently Asked Questions

Geothermal Drilling For Power Generation market growth will increase by USD 243.5 million during 2026-2030 .

The Geothermal Drilling For Power Generation market is expected to grow at a CAGR of 4.5% during 2026-2030 .

Geothermal Drilling For Power Generation market is segmented by Application (Binary plants, Steam plants) Area (Below 1000m, 1000-2000m) Type (Production wells, Injection wells, Slim wells)

Baker Hughes Co., Deep Rock Manufacturing Co., Eavor Technologies Inc., Fervo Energy, Fraste Spa, GA Drilling AS, Geotech Drilling Services Ltd., Gill Rock Drill Co. Inc., Halliburton Co., Huisman Equipment BV, Marton Geotechnical Services Ltd, Ormat Technologies Inc., PT Pertamina Persero, Quaise Energy Inc., Schlumberger Ltd., SIMCO Drilling Equipment Inc., STDS Jantz GmbH and Co., Versa Drill are a few of the key vendors in the Geothermal Drilling For Power Generation market.

APAC will register the highest growth rate of 45.2% among the other regions. Therefore, the Geothermal Drilling For Power Generation market in APAC is expected to garner significant business opportunities for the vendors during the forecast period.

Indonesia, The Philippines, Japan, China, India, Australia, US, Canada, Mexico, Iceland, Italy, Germany, France, Portugal, Greece, Chile, Argentina, Brazil, Turkey, Egypt, Kenya, Ethiopia, Saudi Arabia

  • Global decarbonization mandates and necessity for baseload power is the driving factor this market.

The Geothermal Drilling For Power Generation market vendors should focus on grabbing business opportunities from the Application segment as it accounted for the largest market share in the base year.