
UK Gluten Free Food Market Size 2025-2029
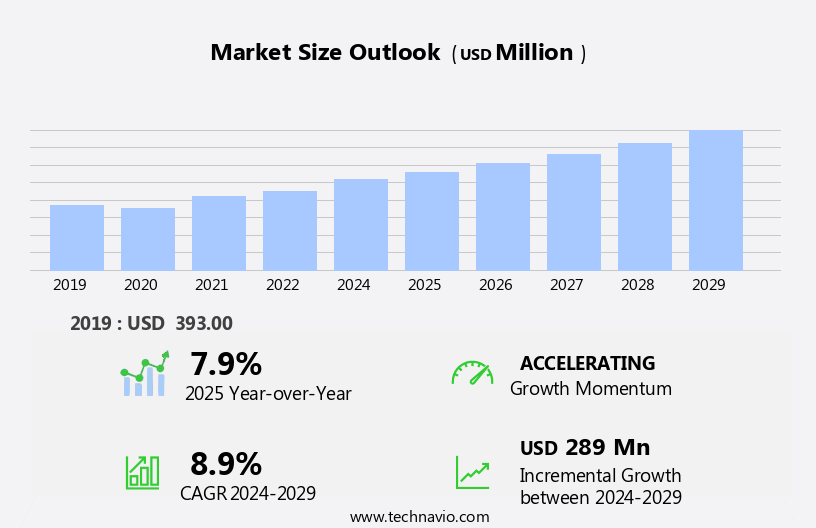
The UK gluten free food market size is forecast to increase by USD 289 million at a CAGR of 8.9% between 2024 and 2029.
- The gluten-free food market witnesses significant growth, driven by the increasing awareness and understanding of the health benefits associated with gluten-free diets. This trend is particularly pronounced among individuals with celiac disease or non-celiac gluten sensitivity. Moreover, the demand for organic gluten-free food products is on the rise, as consumers seek healthier alternatives with minimal processing. However, market expansion faces challenges. Regulatory hurdles impact adoption due to the complex certification process for gluten-free labels. Additionally, supply chain inconsistencies temper growth potential, as ensuring purity and maintaining supply continuity is a significant challenge for manufacturers. A key trend driving market growth is the expanding demand for bakery products. Moreover, wider distribution channels for gluten-free foods are contributing to market expansion. Online shopping and e-commerce platforms have made it easier for consumers to access these products, contributing to the market's growth.
- Companies aiming to capitalize on market opportunities must navigate these obstacles effectively, focusing on robust certification processes and supply chain management strategies. By addressing these challenges, they can successfully cater to the growing consumer base seeking gluten-free options.
What will be the size of the UK Gluten Free Food Market during the forecast period?
- In the dynamic gluten-free market, various sectors continue to gain traction among consumers with dietary restrictions. The gluten-free community's demand for diverse offerings extends beyond staples like oats, quinoa, and rice flour to encompass categories such as gluten-free catering, baking mixes, and pizza crusts. Innovative products include gluten-free tortilla chips, pretzels, and xanthan gum, while alternative flours like chickpea, almond, tapioca, and buckwheat fuel the baking industry. Gluten-free travelers appreciate brands providing on-the-go options like energy bars and meal replacement shakes.
- Pet food and supplements cater to the expanding gluten-free lifestyle. Gluten-free versions of corn, pasta sauce, and bread crumbs further broaden the market scope. Overall, this diverse range of gluten-free offerings caters to various consumer needs, from cooking at home to dining out.
How is this market segmented?
The market research report provides comprehensive data (region-wise segment analysis), with forecasts and estimates in "USD million" for the period 2025-2029, as well as historical data from 2019-2023 for the following segments.
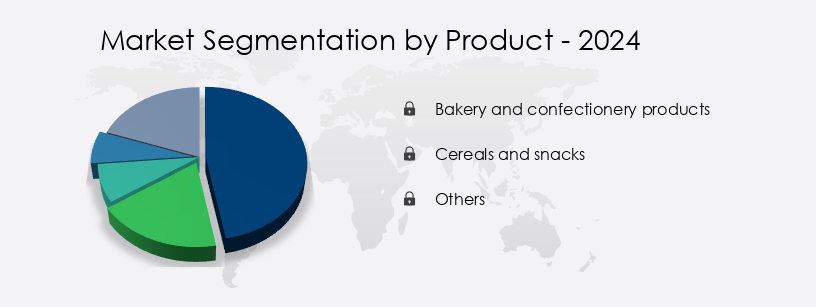
- Product
- Bakery and confectionery products
- Cereals and snacks
- Others
- Distribution Channel
- Offline
- Online
- Grain Type
- Rice-based
- Corn-based
- Quinoa-based
- Nut-based
- Others
- Geography
- Europe
- UK
- Europe
By Product Insights
The bakery and confectionery products segment is estimated to witness significant growth during the forecast period.
The gluten-free food market in the UK is experiencing significant growth in the bakery and confectionery segment, driven by increasing consumer awareness and demand for healthier alternatives. This segment encompasses a range of products including gluten-free bread, crackers, cereals, pasta, pizza, ice cream, cakes, and cookies. Consumers seek gluten-free options due to medical conditions such as celiac disease or as a preventive measure for non-celiac gluten sensitivity. The market's expansion is fueled by evolving dietary preferences, a rise in gluten-related health concerns, and innovative baking techniques that prioritize lighter, healthier, and organic ingredients. In response to this demand, gluten-free bakeries are expanding their reach by opening exclusive outlets and increasing product availability in supermarkets and health food stores.
Gluten-free regulations ensure food safety and quality, while brand awareness campaigns and certifications contribute to consumer trust. Ingredient sourcing focuses on ethical and non-GMO options, and manufacturing processes are designed to prevent cross-contamination. Pricing strategies vary, with some brands targeting premium markets and others offering affordable alternatives. Gluten-free product innovation extends to various categories, including sauces, grains, and protein bars. Consumer loyalty is strong, as individuals with gluten intolerance often rely on these products for their daily nutrition. Product differentiation is crucial, with brands offering unique flavors, textures, and health benefits to stand out in the competitive market.
In summary, the gluten-free food market in the UK is witnessing robust growth in the bakery and confectionery segment, driven by consumer preferences, health concerns, and innovative product offerings. The market's expansion is supported by regulatory frameworks, brand awareness campaigns, and a focus on food quality and safety.
Get a glance at the market share of various segments Request Free Sample
The Bakery and confectionery products segment was valued at USD 215.60 million in 2019 and showed a gradual increase during the forecast period.
Market Dynamics
Our researchers analyzed the data with 2024 as the base year, along with the key drivers, trends, and challenges. A holistic analysis of drivers will help companies refine their marketing strategies to gain a competitive advantage.
What are the key market drivers leading to the rise in the adoption of Gluten Free Food in UK Industry?
- The significant growth of the market can be attributed to the increasing awareness and understanding of the health benefits associated with consuming gluten-free food. Gluten intolerance, a condition that affects individuals with sensitivity to gluten, a protein found in wheat, barley, and rye, has led to a significant shift in food consumption trends. With an estimated 3 million Americans diagnosed with celiac disease and an additional 20 million experiencing non-celiac gluten sensitivity, the demand for gluten-free products continues to rise. The gluten-free food market is projected to reach USD27.8 billion by 2024, driven by increasing consumer awareness and stricter food labeling regulations. Gluten-free alternatives have become increasingly popular, with bakeries and retailers offering a wide range of gluten-free baked goods, from cookies to bread.
- Grocery stores now stock an extensive selection of gluten-free condiments, flours, and vinegars. Ethical sourcing and non-GMO labels are also becoming essential for consumers seeking healthy and sustainable food options. Ancient grains like buckwheat and millet are gaining popularity as nutritious gluten-free alternatives. These grains offer a unique texture and taste, making them an excellent option for those following a gluten-free diet. As awareness of food intolerances and the benefits of gluten-free diets continue to grow, the market for gluten-free products is expected to remain robust. Strict food labeling regulations ensure that gluten-free products meet safety standards, minimizing cross-contamination risks.
What are the market trends shaping the Gluten Free Food in UK Industry?
- The increasing preference for organic and gluten-free food products signifies a significant market trend. This demand is driven by growing consumer awareness and health concerns, making it essential for businesses to cater to this segment. The organic gluten-free food market in the UK is experiencing significant growth due to increasing consumer preference for healthier and sustainable dietary choices. These products are made from grains and ingredients free from synthetic additives, ensuring a natural and wholesome consumption experience. Regulatory bodies, such as the USDA and the Non-GMO Project, monitor and certify the authenticity of these products, instilling trust in consumers. Several companies in the UK offer organic gluten-free food options, catering to the demand for clean-label products. Gluten-free cereals, crackers, bread, pizza, and other food items are innovatively produced to meet consumer trends.
- Ingredient sourcing is a crucial aspect, with companies focusing on local and ethical suppliers to ensure the highest quality and transparency. Consumer trends indicate a growing awareness of non-celiac gluten sensitivity and the need for gluten-free alternatives. Pricing strategies are carefully considered to make these products accessible to a wider audience while maintaining profitability. The market dynamics are influenced by regulatory frameworks, consumer preferences, and competition. The organic gluten-free food market in the UK continues to thrive, driven by consumer demand for healthier, sustainable, and authentic food options. Companies are responding with innovative product offerings, ethical sourcing practices, and regulatory compliance, ensuring the market's continued growth.
What challenges does the Gluten Free Food in UK Industry face during its growth?
- Cross-contamination poses a significant challenge to the growth of the gluten-free food industry, as strict adherence to production protocols is essential to prevent inadvertent gluten introduction into gluten-free food products. Gluten-free eating has become a significant trend in the health and wellness sector, with an increasing number of consumers opting for gluten-free alternatives due to celiac disease, gluten intolerance, or a preference for healthier food options. The market for gluten-free food products includes various categories such as ice cream, pasta, cakes, soy sauce, and beer. However, maintaining a strict gluten-free diet can be challenging due to the risk of cross-contamination. This occurs when a gluten-free product comes into contact with a gluten-containing food, making it unsafe for sensitive individuals. Cross-contamination can lead to symptoms such as diarrhea, indigestion, and vomiting. These products include bread, biscuits, cookies, and confectionery items like cakes and pastries.
- Restaurants pose a significant risk for cross-contamination due to shared cooking spaces and utensils. Lack of awareness among restaurant staff about gluten intolerance and celiac disease can lead to uncertainty among diners regarding the safety of gluten-free options. To prevent cross-contamination, it is essential to use separate kitchen tools, appliances, and preparation areas. Gluten-free labeling plays a crucial role in ensuring food quality and consumer safety. The food industry is responding to this trend by offering gluten-free certified products and improving labeling standards to help consumers make informed choices. Gluten-free testing is also becoming more common to ensure the purity of these products. Overall, the demand for gluten-free food products is expected to continue growing as more consumers prioritize health and wellness in their dietary choices.
Exclusive Customer Landscape
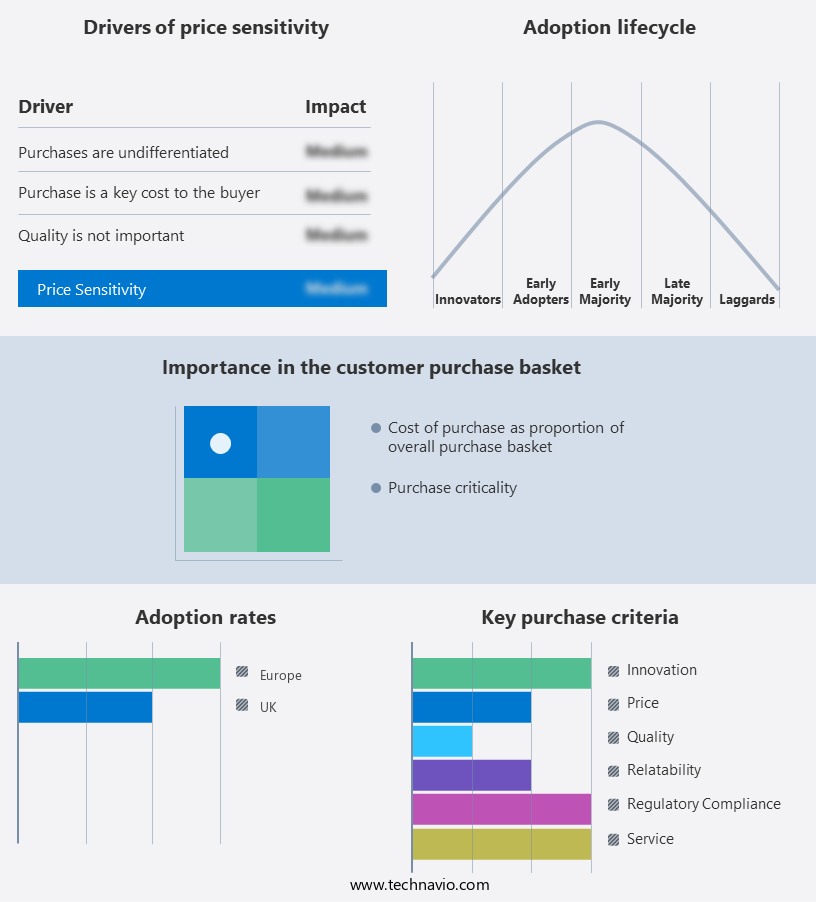
The gluten free food market in UK forecasting report includes the adoption lifecycle of the market, covering from the innovator's stage to the laggard's stage. It focuses on adoption rates in different regions based on penetration. Furthermore, the gluten free food market in UK report also includes key purchase criteria and drivers of price sensitivity to help companies evaluate and develop their market growth analysis strategies.
Customer Landscape
Key Companies & Market Insights
Companies are implementing various strategies, such as strategic alliances, gluten free food market in UK forecast, partnerships, mergers and acquisitions, geographical expansion, and product/service launches, to enhance their presence in the industry.
Amys Kitchen Inc. - This company specializes in providing a range of gluten-free food options for health-conscious consumers.
The industry research and growth report includes detailed analyses of the competitive landscape of the market and information about key companies, including:
- Amys Kitchen Inc.
- Co operative Group Ltd.
- Creative Nature Ltd.
- Finsbury Food Group Plc
- Fria Brod AB
- General Mills Inc.
- Genius Foods Ltd.
- Glebe Farm Foods Ltd
- Hero AG
- Kellogg Co.
- LEON Restaurants Ltd.
- McCormick and Co. Inc.
- Nairns Oatcakes Ltd.
- Natures Path Foods
- Nestle SA
- Prima Foods Ltd.
- The Hain Celestial Group Inc.
- The Kraft Heinz Co.
- The TradeLink International Group Ltd.
- Warburtons Ltd.
Qualitative and quantitative analysis of companies has been conducted to help clients understand the wider business environment as well as the strengths and weaknesses of key industry players. Data is qualitatively analyzed to categorize companies as pure play, category-focused, industry-focused, and diversified; it is quantitatively analyzed to categorize companies as dominant, leading, strong, tentative, and weak.
Recent Development and News in Gluten Free Food Market In UK
- In February 2024, General Mills, a leading food manufacturer, introduced a new line of gluten-free cereals under their Chex brand (General Mills Press Release). This expansion caters to the growing demand for gluten-free options in the breakfast category.
- In May 2025, Nestlé and Danone, two major players in the food industry, announced a strategic partnership to jointly develop and market plant-based and gluten-free products (Reuters). This collaboration aims to capitalize on the rising trend of consumers opting for healthier and dietary-specific food choices.
- In October 2024, PepsiCo completed the acquisition of BFY Brands, a leading producer of gluten-free and allergy-friendly snacks (Wall Street Journal). This acquisition strengthened PepsiCo's presence in the fast-growing gluten-free snack market and expanded their product portfolio.
- In January 2025, the European Commission approved the use of the term "gluten-free" on food products containing up to 20 parts per million (ppm) of gluten (European Commission Press Release). This relaxation of the previous 20 ppm threshold for gluten-free labeling is expected to increase market size and competitiveness.
Research Analyst Overview
The gluten-free food market continues to evolve, driven by increasing consumer awareness and demand for healthier, alternative food options. Product innovation remains a key focus, with new offerings in various sectors such as gluten-free cereal and vegan alternatives. Distribution channels are expanding, with health food stores and grocery outlets increasing their selection of gluten-free options. Brand awareness is crucial, with companies investing in marketing strategies to reach consumers with celiac disease, non-celiac gluten sensitivity, and wheat allergy. Gluten-free regulations are becoming more stringent, leading to increased certification and labeling requirements. Consumer trends favor gluten-free versions of popular foods, including pizza, bread, ice cream, pasta, and baked goods. This segment encompasses a wide range of offerings, including gluten-free bagels, baking mixes, muffins, rolls and buns, cornbread, focaccia, croissants, pies and cakes, bread, crackers, pretzels, cookies and wafers, baking powder, and more.
Ingredient sourcing is a critical consideration, with a growing emphasis on ethical and non-GMO ingredients. Pricing strategies vary, with some companies focusing on premium offerings for those with celiac disease, while others target the broader health and wellness market with more affordable options. Manufacturing processes are being refined to minimize cross-contamination risks, ensuring food safety and quality. Market research indicates continued growth in the gluten-free food market, driven by increasing consumer interest in healthy eating and food intolerances. Competitive advantage lies in product differentiation, with companies offering unique flavors, textures, and ingredients to stand out in a crowded market. Rice and corn, primary ingredients in gluten-free food, are more expensive than wheat. Certifications, specialized carriers, and logistics also add to the expenses. The future of the gluten-free food market is bright, with ongoing innovation and consumer demand driving growth across various sectors.StartFragment
The Gluten-Free Food Market in the UK is expanding rapidly, driven by increasing health consciousness and dietary needs. Consumers seek delicious glutenfree snacks, indulgent glutenfree bakery items, and sweet glutenfree desserts like glutenfree cookies and glutenfree cakes. The demand for glutenfree crackers, glutenfree flour, and diverse glutenfree grains is rising, supporting both home baking and commercial production. Convenient options such as glutenfree protein bars, glutenfree ice cream, and even glutenfree beer are gaining popularity. Essential condiments like glutenfree soy sauce, glutenfree vinegar, and glutenfree sauces enhance meal variety. With more consumers opting for glutenfree dairyfree choices, brands are innovating to provide accessible, flavorful alternatives, fueling the continued growth of this thriving market.
The Gluten-Free Food Market in the UK is witnessing remarkable growth as consumers seek healthier dietary alternatives. The demand for glutenfree oats, glutenfree rice flour, glutenfree quinoa, and glutenfree corn is soaring, driven by awareness of celiac disease and gluten intolerance. Diverse products, including glutenfree buckwheat, glutenfree tapioca, glutenfree almond flour, and glutenfree coconut flour, cater to evolving preferences. Innovations in glutenfree chickpea flour, glutenfree potato starch, glutenfree xanthan gum, and glutenfree guar gum enhance baking applications, fueling sales of glutenfree baking mixes and glutenfree bread crumbs. Convenience items like glutenfree pasta sauce, glutenfree pizza crust, glutenfree pretzels, glutenfree protein powder, glutenfree energy bars, and glutenfree meal replacement gain popularity. Expanding choices in glutenfree supplements, glutenfree baby food, glutenfree pet food, and glutenfree restaurant menus drive widespread glutenfree dining options.
EndFragment
Dive into Technavio's robust research methodology, blending expert interviews, extensive data synthesis, and validated models for unparalleled Gluten Free Food Market in UK insights. See full methodology.
|
Market Scope |
|
|
Report Coverage |
Details |
|
Page number |
170 |
|
Base year |
2024 |
|
Historic period |
2019-2023 |
|
Forecast period |
2025-2029 |
|
Growth momentum & CAGR |
Accelerate at a CAGR of 8.9% |
|
Market growth 2025-2029 |
USD 289 million |
|
Market structure |
Fragmented |
|
YoY growth 2024-2025(%) |
7.9 |
|
Key countries |
UK |
|
Competitive landscape |
Leading Companies, Market Positioning of Companies, Competitive Strategies, and Industry Risks, |
What are the Key Data Covered in this Gluten Free Food Market in UK Research and Growth Report?
- CAGR of the Gluten Free Food in UK industry during the forecast period
- Detailed information on factors that will drive the growth and forecasting between 2025 and 2029
- Precise estimation of the size of the market and its contribution of the industry in focus to the parent market
- Accurate predictions about upcoming growth and trends and changes in consumer behaviour
- Growth of the market across UK
- Thorough analysis of the market's competitive landscape and detailed information about companies
- Comprehensive analysis of factors that will challenge the gluten free food market in UK growth of industry companies
We can help! Our analysts can customize this gluten free food market in UK research report to meet your requirements.
 RIA -
RIA - 
