
Bakery Products Market Size 2025-2029
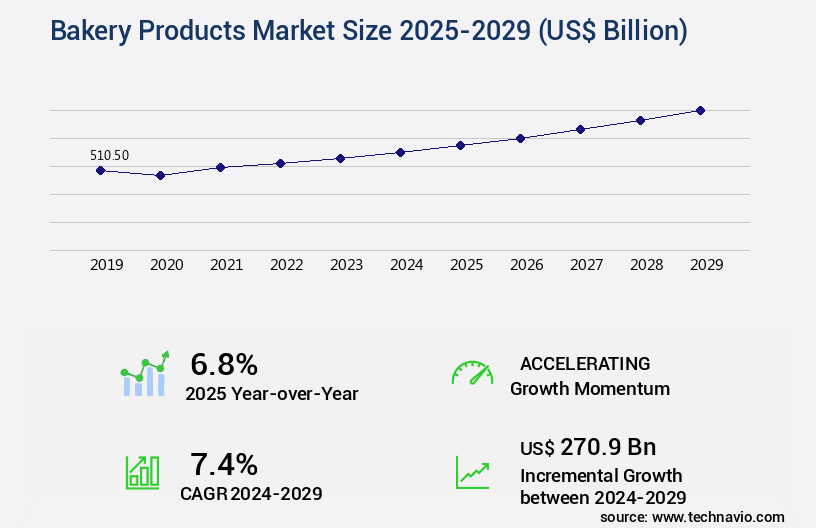
The bakery products market size is valued to increase USD 270.9 billion, at a CAGR of 7.4% from 2024 to 2029. Increasing retail value sales of private-label bakery products will drive the bakery products market.
Major Market Trends & Insights
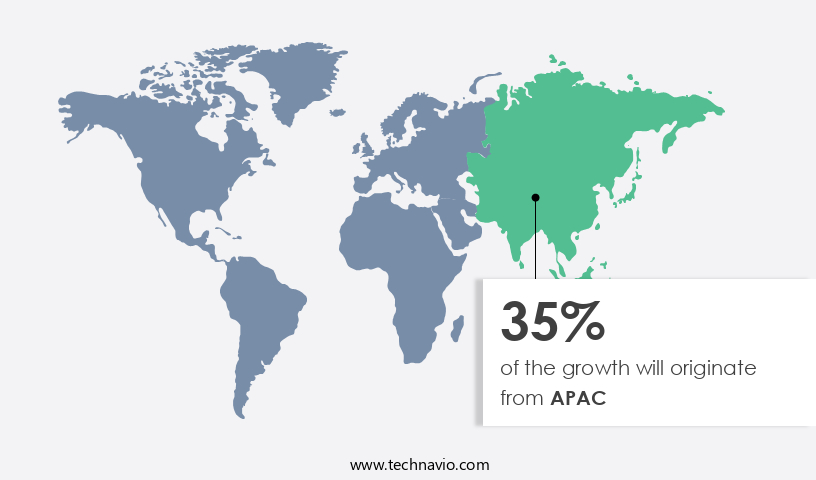
- APAC dominated the market and accounted for a 35% growth during the forecast period.
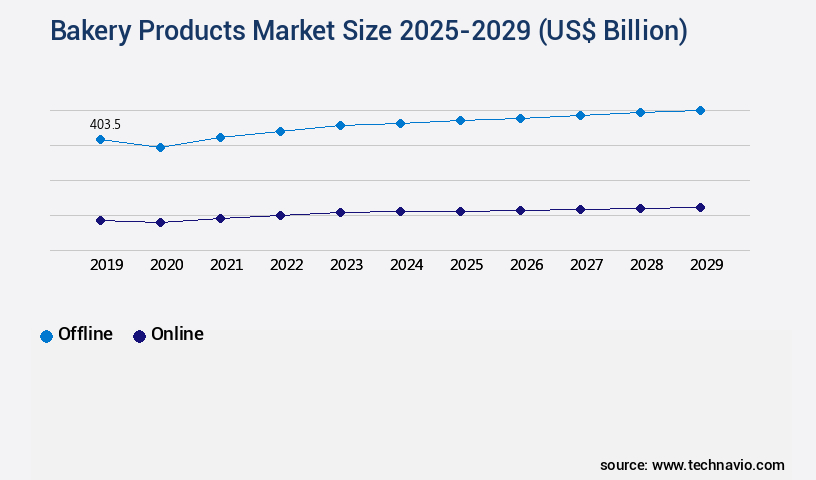
- By Distribution Channel - Offline segment was valued at USD 403.50 billion in 2023
- By Product - Bread and rolls segment accounted for the largest market revenue share in 2023
Market Size & Forecast
- Market Opportunities: USD 76.47 billion
- Market Future Opportunities: USD 270.90 billion
- CAGR : 7.4%
- APAC: Largest market in 2023
Market Summary
- The market encompasses a diverse range of baked goods, including bread, cakes, pastries, and biscuits, among others. This dynamic market is driven by several key factors, with increasing retail value sales of private-label bakery products being a significant trend. According to market research, private-label bakery products accounted for over 30% of the global bakery market share in 2020. However, the market also faces challenges, such as the volatility of raw material prices, which can impact production costs. In the realm of technology, automation and robotics are increasingly being adopted to enhance production efficiency and improve product quality.
- Meanwhile, the application of natural and organic ingredients is gaining traction as consumers seek healthier options. The online presence of bakery product companies is another evolving trend, with e-commerce platforms providing a new avenue for sales growth. Despite these opportunities, regulatory compliance remains a crucial consideration, with stringent food safety regulations shaping market dynamics. Overall, the market continues to evolve, presenting both challenges and opportunities for stakeholders.
What will be the Size of the Bakery Products Market during the forecast period?
Get Key Insights on Market Forecast (PDF) Request Free Sample
How is the Bakery Products Market Segmented and what are the key trends of market segmentation?
The bakery products industry research report provides comprehensive data (region-wise segment analysis), with forecasts and estimates in "USD billion" for the period 2025-2029, as well as historical data from 2019-2023 for the following segments.
- Distribution Channel
- Offline
- Online
- Product
- Bread and rolls
- Cakes and pastries
- Cookies
- Others
- Consumer Type
- Household/Retail
- Commercial/Foodservice
- Geography
- North America
- US
- Canada
- Europe
- France
- Germany
- Italy
- UK
- Middle East and Africa
- Egypt
- KSA
- Oman
- UAE
- APAC
- China
- India
- Japan
- South America
- Argentina
- Brazil
- Rest of World (ROW)
- North America
By Distribution Channel Insights
The offline segment is estimated to witness significant growth during the forecast period.
In the market, sensory evaluation plays a pivotal role in ensuring product quality and consumer satisfaction. Packaging materials, a crucial aspect of product preservation, are continually evolving to maintain hygiene standards and extend shelf life. Crumb structure, a significant factor in the baking process, is optimized through various leavening agents and baking efficiency techniques. Mixing techniques and dough rheology are essential for achieving the desired texture and consistency. Water activity, a critical parameter in microbial spoilage prevention, is meticulously controlled during production. Process optimization and gluten development are key areas of focus for improving baking ingredient efficiency and crust formation.
Yield improvement and oven temperature control are essential for maintaining profitability and reducing energy consumption. The bread making process is increasingly automated through advanced systems, including batch mixing and continuous mixing. Ingredient interactions and waste reduction strategies are essential for minimizing costs and ensuring food safety regulations are met. Production scheduling and quality control testing are integral parts of maintaining a consistent product and meeting customer demands. Dough conditioning and ingredient cost analysis are ongoing considerations for bakers seeking to optimize their operations. Shelf life extension and ingredient sourcing are critical factors in maintaining customer loyalty and staying competitive.
The baking industry is continuously evolving, with a focus on improving processing parameters, flour quality parameters, and fermentation processes. Proofing techniques and product traceability are essential for maintaining product quality and ensuring consumer trust. According to recent industry reports, The market is expected to grow by 12.5% in the next year, driven by increasing consumer demand for convenience and healthier options. Additionally, the market is projected to expand by 15% over the next five years, as more consumers seek out artisanal and specialty baked goods. These trends reflect the ongoing dynamism and evolving nature of the market.
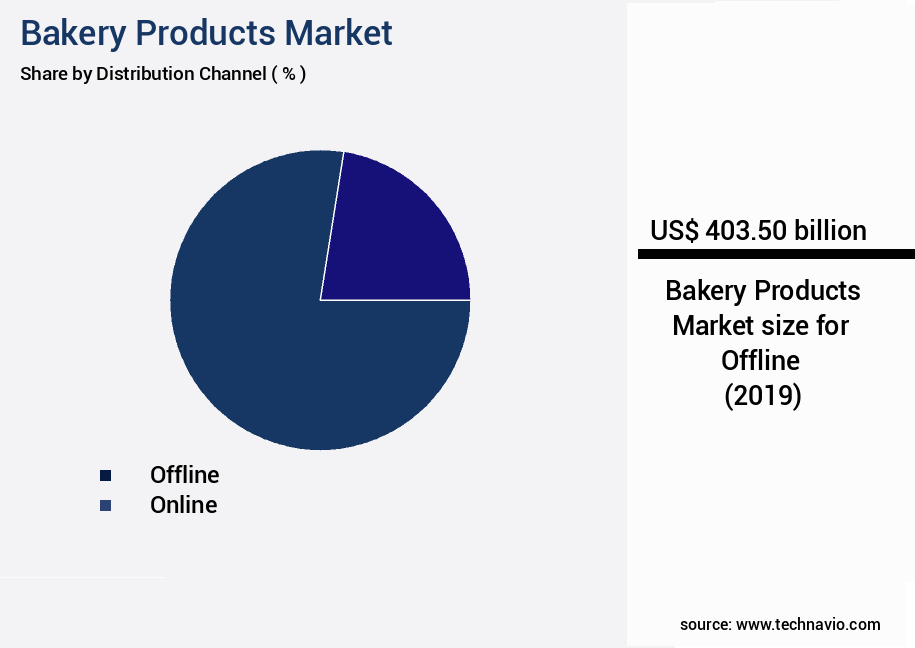
The Offline segment was valued at USD 403.50 billion in 2019 and showed a gradual increase during the forecast period.
Regional Analysis
APAC is estimated to contribute 35% to the growth of the global market during the forecast period.Technavio's analysts have elaborately explained the regional trends and drivers that shape the market during the forecast period.
See How Bakery Products Market Demand is Rising in APAC Request Free Sample
The market in Asia Pacific (APAC) is experiencing significant expansion, with key countries such as China, Japan, India, and Australia driving market growth. Major players in this sector, like Britannia Industries, are capitalizing on the region's potential through strategic business developments. For instance, Grupo Bimbo, a global leader, has been present in Asia since 2006, operating through its subsidiary Bimbo China. Their Beijing production plant manufactures and distributes various bakery items, including packaged bread, pastries, cookies, and ready-to-eat food, primarily under the Bimbo brand.
The market's growth can be attributed to the increasing presence of global players in the region, as they expand their reach organically and inorganically.
Market Dynamics
Our researchers analyzed the data with 2024 as the base year, along with the key drivers, trends, and challenges. A holistic analysis of drivers will help companies refine their marketing strategies to gain a competitive advantage.
The market is a dynamic and intricate industry, encompassing various aspects of production, from the impact of flour type on bread texture to the optimization of fermentation time and temperature. The quality of baked goods is significantly influenced by the effect of oven design on baking outcomes, as well as the correlation between dough rheology and bread volume. Measuring water activity in baked goods is crucial for maintaining product consistency and ensuring shelf life extension through packaging. Gluten development during mixing plays a pivotal role in the baking process, with the relationship between ingredient functionality and product quality being a key focus for innovation.
Analysis of microbial spoilage in bread is essential for food safety, while improved efficiency in baking processes is a significant driver for cost reduction strategies. Techniques for reducing waste in baking production and the impact of automation on bakery efficiency are ongoing areas of research and development. Consumer perception of different bread textures varies significantly, with preferences influencing market trends. Ingredient cost reduction strategies are a critical concern for manufacturers, while ensuring food safety in baking remains a top priority. New product development in the bakery sector continues to evolve, with gluten-free bread production and dough handling during the baking process being notable areas of growth.
Adoption rates of advanced baking technologies in developing regions are significantly lower than in mature markets, accounting for less than 30% of total market share. This disparity presents opportunities for market expansion and innovation, as well as challenges in addressing the unique needs of diverse consumer bases. By addressing these trends and challenges, bakery product manufacturers can improve the efficiency of their baking processes and maintain a competitive edge in this dynamic industry.
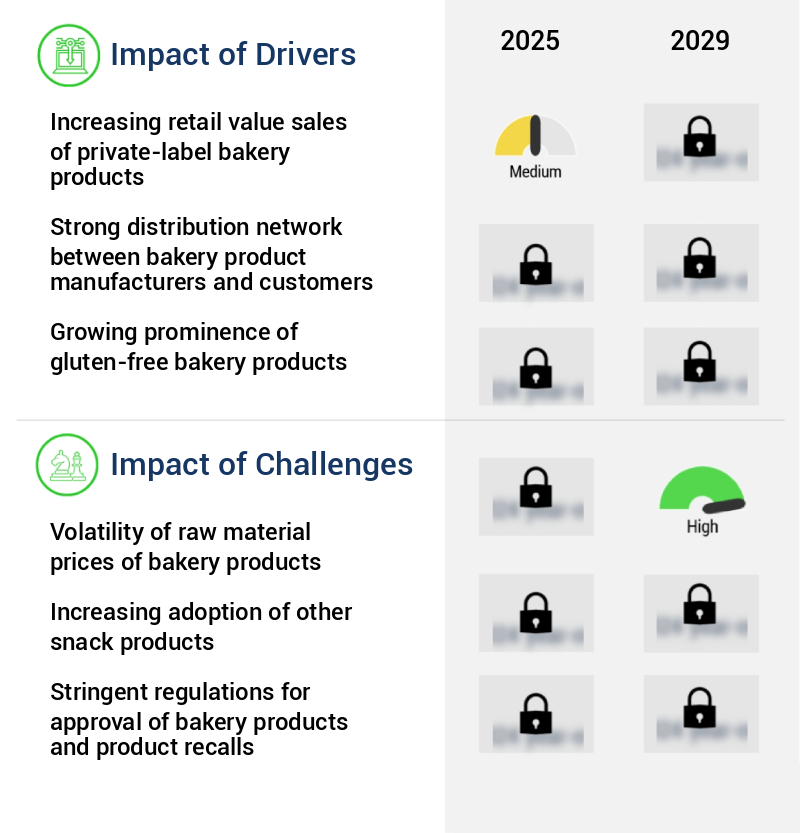
What are the key market drivers leading to the rise in the adoption of Bakery Products Industry?
- The significant growth in private-label bakery products' retail sales value serves as the primary market catalyst.
- Private-label bakeries, located in hypermarkets, supermarkets, grocery stores, and departmental stores, represent a significant presence in the retail bakery sector. These establishments, often smaller in scale compared to artisanal and industrial bakeries, offer a wide array of packaged baked goods. Notably, there is a rising trend towards healthier options, with an increasing number of private-label baked products incorporating whole grain and similar nutritious ingredients. In-store bakeries, which are gaining popularity, pose a challenge to their traditional counterparts. The allure of lower prices and the convenience of one-stop shopping have led value-conscious customers to opt for in-store bakery offerings.
- The par-baked, pre-baked, or bake-off range of products is increasingly making a mark, with these options providing flexibility for consumers and reducing labor costs for retailers. The competitive landscape in the private-label bakery market is dynamic, with players continually adapting to evolving consumer preferences and market trends. The convenience and affordability of in-store bakeries, combined with the health-conscious offerings of private-label brands, ensure a robust presence for both in the retail bakery sector.
What are the market trends shaping the Bakery Products Industry?
- The increasing online presence is a mandated market trend for bakery product companies. Bakery product companies are increasingly establishing an online presence to remain competitive.
- The proliferation of smartphones and the expanding internet reach have significantly influenced the sale of bakery products online. E-commerce platforms provide consumers with a vast array of brand choices and the convenience to purchase bakery items at their preferred time. The 2017 acquisition of Whole Foods Market by Amazon brought about a wave of innovation in The market. Post-acquisition, Amazon began offering Whole Foods Market's bakery products to customers through Amazon Prime, revolutionizing delivery services. Notable offerings on Amazon Prime include cookies, gluten-free bakery items, brownies, blondies, dessert bars, pies, cakes, and loaves. This shift towards online sales and Amazon's swift delivery and hassle-free purchasing experience have attracted a substantial number of consumers to buy bakery products online.
What challenges does the Bakery Products Industry face during its growth?
- The volatility of raw material prices poses a significant challenge to the growth of the bakery industry. Bakery products rely heavily on commodities such as flour, sugar, and dairy, the prices of which can fluctuate dramatically. This unpredictability in costs can impact profitability, force price increases on consumers, and potentially hinder industry expansion.
- The market relies on key raw materials such as wheat and wheat flour, cocoa, dairy products, palm and other vegetable oils, sugar and sweeteners, flavoring agents, and nuts for production. Bakery businesses procure substantial quantities of packaging materials to preserve and present their goods. Raw material prices are subject to volatility due to factors like resource competition, tariffs, and trade barriers; weather conditions; potential agricultural productivity impacts from climate change; crop diseases or pests; and water risks.
- Additionally, consumer and industrial demand influences pricing. Enhancing bakery products' volume, texture, and appearance, enzymes have gained prominence as functional ingredients, surpassing the capabilities of alternatives like ascorbic acid and vital wheat gluten.
Exclusive Technavio Analysis on Customer Landscape
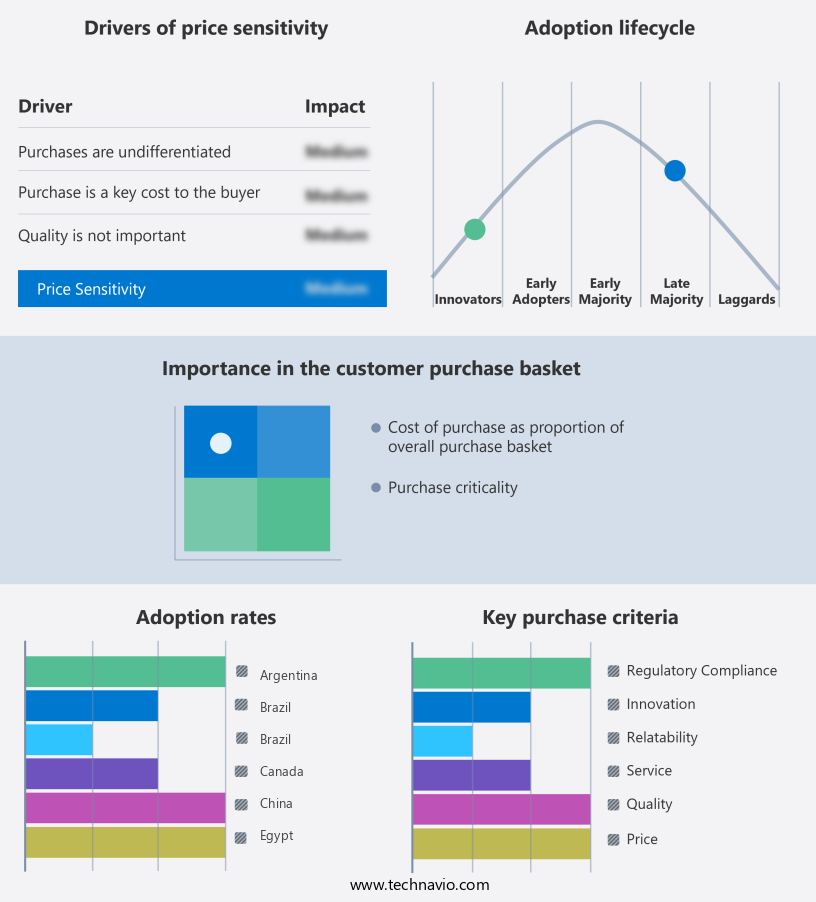
The bakery products market forecasting report includes the adoption lifecycle of the market, covering from the innovator's stage to the laggard's stage. It focuses on adoption rates in different regions based on penetration. Furthermore, the bakery products market report also includes key purchase criteria and drivers of price sensitivity to help companies evaluate and develop their market growth analysis strategies.
Customer Landscape of Bakery Products Industry
Competitive Landscape
Companies are implementing various strategies, such as strategic alliances, bakery products market forecast, partnerships, mergers and acquisitions, geographical expansion, and product/service launches, to enhance their presence in the industry.
Aryzta AG - This company specializes in producing a variety of bakery items, including Bread Rolls, Artisan Loaves, and Sweet Baked goods. Their product ranges cater to current consumer preferences for freshness, health, and artisanal qualities. By optimizing the value chain, they effectively serve customers while maintaining a competitive edge in the industry.
The industry research and growth report includes detailed analyses of the competitive landscape of the market and information about key companies, including:
- Aryzta AG
- Associated British Foods plc
- Bahlsen GmbH & Co. KG
- Bakkavor Group plc
- Barilla G. e R. Fratelli S.p.A.
- Britannia Industries Ltd.
- Dr. August Oetker KG
- Europastry S.A.
- Finsbury Food Group Plc
- Flowers Foods Inc.
- Grupo Bimbo S.A.B. de C.V.
- Kellogg Company
- Lantmännen Unibake
- McKee Foods Corporation
- Mondelez International Inc.
- Nestlé S.A.
- Parle Products Pvt. Ltd.
- Pepperidge Farm Inc.
- Warburtons Ltd.
- Yamazaki Baking Co. Ltd.
Qualitative and quantitative analysis of companies has been conducted to help clients understand the wider business environment as well as the strengths and weaknesses of key industry players. Data is qualitatively analyzed to categorize companies as pure play, category-focused, industry-focused, and diversified; it is quantitatively analyzed to categorize companies as dominant, leading, strong, tentative, and weak.
Recent Development and News in Bakery Products Market
- In January 2024, General Mills, a leading player in the market, introduced a new line of plant-based frozen desserts under its popular brand, Cinnabon. These new offerings included plant-based cinnamon rolls and plant-based churros, expanding the company's product portfolio to cater to the growing demand for vegan and vegetarian options (General Mills Press Release, 2024).
- In March 2024, Danish bakery company, Grupo Bimbo, announced a strategic partnership with U.S.-based bakery chain, Panera Bread. This collaboration aimed to expand Bimbo's presence in the North American market and strengthen its position in the artisan and specialty bakery segment (Bimbo Press Release, 2024).
- In May 2024, Lantmannen Unibake, a leading European bakery products manufacturer, completed the acquisition of a majority stake in Dutch bakery company, Meijer B.V. This strategic move enabled Lantmannen Unibake to expand its product offerings and strengthen its presence in the European market (Lantmannen Unibake Press Release, 2024).
- In February 2025, the European Commission approved a new regulation to reduce the amount of sugar in bakery products by 10% over the next five years. This regulatory development is expected to drive innovation in the bakery industry as companies seek to comply with the new regulations while maintaining consumer appeal (European Commission Press Release, 2025).
Dive into Technavio's robust research methodology, blending expert interviews, extensive data synthesis, and validated models for unparalleled Bakery Products Market insights. See full methodology.
|
Market Scope |
|
|
Report Coverage |
Details |
|
Page number |
206 |
|
Base year |
2024 |
|
Historic period |
2019-2023 |
|
Forecast period |
2025-2029 |
|
Growth momentum & CAGR |
Accelerate at a CAGR of 7.4% |
|
Market growth 2025-2029 |
USD 270.9 billion |
|
Market structure |
Fragmented |
|
YoY growth 2024-2025(%) |
6.8 |
|
Key countries |
US, Canada, Germany, UK, Italy, France, China, India, Japan, Brazil, Egypt, UAE, Oman, Argentina, KSA, UAE, Brazil, and Rest of World (ROW) |
|
Competitive landscape |
Leading Companies, Market Positioning of Companies, Competitive Strategies, and Industry Risks |
Research Analyst Overview
- In the dynamic and evolving world of bakery products, various elements continue to shape market activities. Sensory evaluation plays a pivotal role in shaping consumer preferences, with packaging materials increasingly focusing on enhancing product appeal and preserving freshness. Crumb structure, a critical factor in bread quality, is optimized through the use of advanced leavening agents and baking efficiency techniques. Hygiene standards are paramount in maintaining product safety and consumer trust. Bakers employ stringent measures to ensure adherence, from dough conditioning to process optimization. Automation systems, including batch mixing and energy-efficient oven temperature control, streamline production and reduce waste. Bread making processes are continually refined through the exploration of dough rheology, water activity, and ingredient interactions.
- Texture analysis and ingredient cost analysis are essential components of quality control testing, ensuring optimal crust formation and yield improvement. Food safety regulations mandate stringent production scheduling and quality control measures. Ingredient sourcing and ingredient cost analysis are key strategies for minimizing waste and extending shelf life. Processing parameters, including fermentation process and proofing techniques, are meticulously controlled to maintain consistency and product quality. Microbial spoilage is a persistent challenge, necessitating ongoing research and innovation in waste reduction strategies and ingredient sourcing. Continuous mixing and processing parameters are optimized to minimize the risk of contamination and ensure product integrity.
- In the ever-evolving the market, these trends and strategies continue to shape market dynamics, with a focus on enhancing product quality, optimizing production processes, and ensuring food safety.
What are the Key Data Covered in this Bakery Products Market Research and Growth Report?
-
What is the expected growth of the Bakery Products Market between 2025 and 2029?
-
USD 270.9 billion, at a CAGR of 7.4%
-
-
What segmentation does the market report cover?
-
The report segmented by Distribution Channel (Offline and Online), Product (Bread and rolls, Cakes and pastries, Cookies, and Others), Geography (APAC, Europe, North America, South America, and Middle East and Africa), and Consumer Type (Household/Retail and Commercial/Foodservice)
-
-
Which regions are analyzed in the report?
-
APAC, Europe, North America, South America, and Middle East and Africa
-
-
What are the key growth drivers and market challenges?
-
Increasing retail value sales of private-label bakery products, Volatility of raw material prices of bakery products
-
-
Who are the major players in the Bakery Products Market?
-
Key Companies Aryzta AG, Associated British Foods plc, Bahlsen GmbH & Co. KG, Bakkavor Group plc, Barilla G. e R. Fratelli S.p.A., Britannia Industries Ltd., Dr. August Oetker KG, Europastry S.A., Finsbury Food Group Plc, Flowers Foods Inc., Grupo Bimbo S.A.B. de C.V., Kellogg Company, Lantmännen Unibake, McKee Foods Corporation, Mondelez International Inc., Nestlé S.A., Parle Products Pvt. Ltd., Pepperidge Farm Inc., Warburtons Ltd., and Yamazaki Baking Co. Ltd.
-
Market Research Insights
- The market encompasses a diverse range of items, from bread and pastries to cakes and biscuits. Moisture content plays a crucial role in ensuring product quality, with ideal levels varying between different baked goods. For instance, bread typically requires a higher moisture content to maintain its soft texture, while cookies require a lower moisture content for optimal crispiness. New product development is a key driver in the market, with ingredient functionality a primary focus. Recipe formulation and process validation are essential steps in bringing innovative products to market, requiring careful consideration of dough handling, microbial control, and efficiency gains.
- Ingredient substitutions, such as the use of plant-based proteins, have gained popularity in response to evolving consumer preferences. Maintaining quality assurance is a top priority, with strict adherence to process monitoring, enzyme activity, and product standardization crucial for consistent results. Storage conditions, including temperature and humidity, are critical to preserving product freshness and flavor. Volume determination, density measurement, and color measurement are essential in ensuring accurate production capacity and optimizing baking technology. The market continues to evolve, with a focus on cost reduction, process optimization, and innovation. For example, starch gelatinization and distribution logistics have emerged as key areas of research, offering potential for significant efficiency gains.
- Flavor compounds and aroma profile are also under close scrutiny, as manufacturers seek to create products that appeal to diverse consumer tastes.
We can help! Our analysts can customize this bakery products market research report to meet your requirements.
 RIA -
RIA - 
