Glyoxylic Acid Market Analysis North America, APAC, Europe, South America, Middle East and Africa - US, China, Germany, France, Japan - Size and Forecast 2024-2028

Glyoxylic Acid Market Analysis North America, APAC, Europe, South America, Middle East and Africa - US, China, Germany, France, Japan - Size and Forecast 2024-2028

Published: Jul 2024 141 Pages SKU: IRTNTR72958

Market Overview at a Glance

$192.5 Mn
Market Opportunity
4.49%
CAGR
4.23
YoY growth 2023-2024(%)

Glyoxylic Acid Market Size 2024-2028

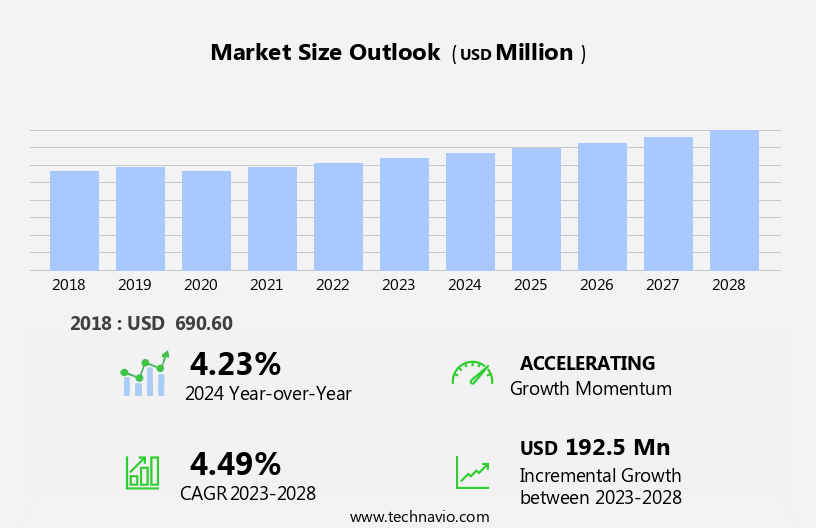
The glyoxylic acid market size is forecast to increase by USD 192.5 million at a CAGR of 4.49% between 2023 and 2028.

  • The market is experiencing significant growth, driven primarily by increasing demand from the cosmetics industry. This trend is particularly prominent in the Asia Pacific and North American regions, where the consumer base for personal care products is expanding rapidly. However, the market is not without challenges. The negative effects of glyoxylic acid on skin, including the potential for causing diseases such as contact dermatitis, represent a significant concern. This issue may limit the market's growth potential and necessitate the development of alternative solutions or stricter regulations.
  • Companies seeking to capitalize on the market opportunities must navigate these challenges effectively, focusing on product innovation and regulatory compliance to meet the evolving demands of consumers and regulatory bodies. The market's strategic landscape is dynamic, with ongoing research and development efforts aimed at addressing the challenges and unlocking new growth opportunities.

What will be the Size of the Glyoxylic Acid Market during the forecast period?

Glyoxylic Acid Market Size

 Request Free Sample

  • The glyoxylic acid industry is experiencing significant growth driven by the increasing demand for glyoxylic acid uses in various applications. One of the key trends in this market is the advancement of glyoxylic acid oxidation technology, which is leading to innovation in the production of glyoxylic acid esters and derivatives. Research and development are crucial in the market, with numerous studies focusing on glyoxylic acid synthesis and reduction techniques. Patents related to glyoxylic acid salts and solutions are also being actively pursued to expand the market's potential. Glyoxylic acid manufacturers are investing in new technologies to improve production efficiency and reduce costs.
  • Suppliers and distributors are also playing a vital role in the market by providing solutions for glyoxylic acid hydration and condensation. The market is witnessing numerous developments, including the creation of new applications for glyoxylic acid polymers and the use of glyoxylic acid in the production of glyoxylic acid monohydrate. Overall, the glyoxylic acid industry is poised for continued growth as new uses and applications are discovered.

How is this Glyoxylic Acid Industry segmented?

The glyoxylic acid industry research report provides comprehensive data (region-wise segment analysis), with forecasts and estimates in "USD million" for the period 2024-2028, as well as historical data from 2018-2022 for the following segments.

  • End-user
    • Cosmetics and personal care
    • Pharmaceutical
    • Agrochemicals
    • Aromas
    • Others
  • Geography
    • North America
      • US
    • Europe
      • France
      • Germany
    • Middle East and Africa
      • APAC
        • China
        • Japan
      • South America
        • Rest of World (ROW)

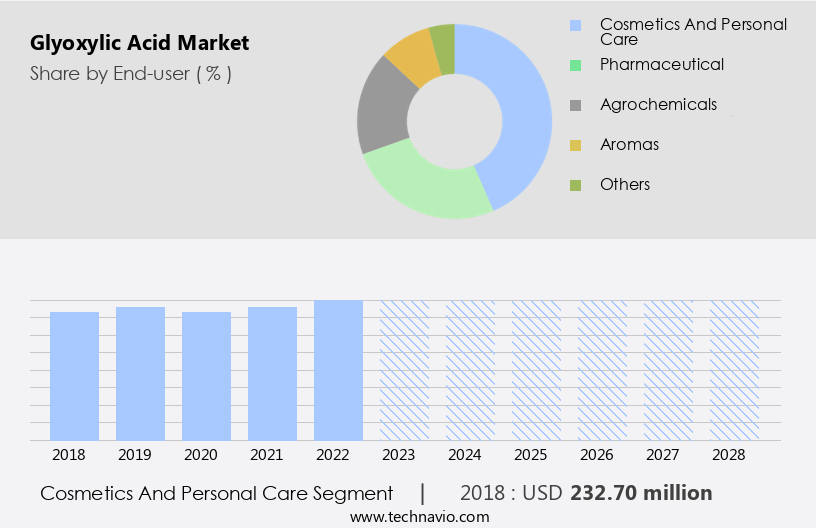
        By End-user Insights

        The cosmetics and personal care segment is estimated to witness significant growth during the forecast period.

        Glyoxylic acid, a significant component in personal care and cosmetics, is primarily utilized in chemical peels, anti-aging creams, lotions, and mask products. Its benefits extend to skin rejuvenation and moisturization. A smaller proportion is employed in hair care and nail care items. Beyond its application in beauty products, glyoxylic acid is also employed for treating scars, discoloration, and aging signs such as fine lines and wrinkles. This versatile compound acts as an exfoliant, pH adjuster, and skin conditioning agent in personal care and cosmetics, contributing to the market's expansion in this sector. The use of bio-based materials, such as glyoxylic acid, aligns with the growing trend towards sustainable production and the circular economy.

        Companies are increasingly focusing on reducing their carbon footprint by adopting green technologies and bio-based intermediates in their manufacturing processes. Epoxy resins, another essential component, are being replaced with bio-based alternatives to minimize waste and improve production capacity. The demand for bio-based chemicals and bio-based products is driven by various factors, including environmental regulations, consumer preferences, and industry consolidation. Safety standards are stringently enforced to ensure the production of high-quality products, with quality control playing a crucial role in maintaining consistency and meeting customer expectations. Manufacturing facilities are being upgraded to incorporate advanced process optimization techniques and sustainable production methods.

        Polyvinyl alcohol, a biodegradable polymer, is gaining popularity due to its eco-friendly nature and versatile applications. The competitive advantage of offering bio-based alternatives to traditional chemical products is a significant differentiator in the market. In the end-use industries, green chemistry and renewable resources are increasingly being adopted to minimize the environmental impact and improve production efficiency. Catalyst development and chemical synthesis are key areas of focus for companies to reduce their reliance on non-renewable resources and improve production capacity. Acetic acid and formic acid, widely used in various industries, are being replaced with their bio-based counterparts to reduce the carbon footprint and meet regulatory requirements.

        In summary, the market for bio-based materials, chemicals, and products is evolving, driven by factors such as consumer preferences, environmental regulations, and technological advancements. Companies are focusing on sustainability, circular economy, and waste management to minimize their carbon footprint and offer competitive advantages. The use of glyoxylic acid in personal care and cosmetics is a prime example of this trend, with its benefits extending beyond skin care to include environmental sustainability.

        Glyoxylic Acid Market Size

        Get a glance at the market report of share of various segments Request Free Sample

        The Cosmetics and personal care segment was valued at USD 232.70 million in 2018 and showed a gradual increase during the forecast period.

        Regional Analysis

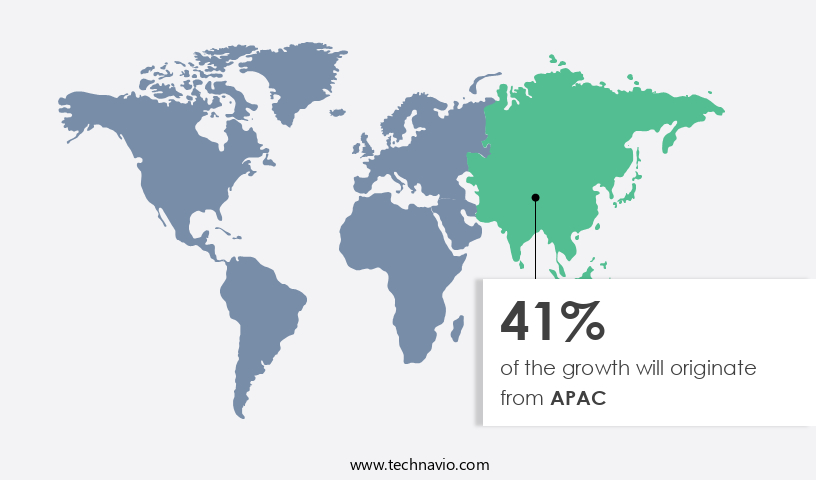
        APAC is estimated to contribute 41% to the growth of the global market during the forecast period.Technavio’s analysts have elaborately explained the regional trends and drivers that shape the market during the forecast period.

        Glyoxylic Acid Market Share by Geography

        For more insights on the market size of various regions, Request Free Sample

        In the North American market, glyoxylic acid, a versatile organic compound, finds extensive application in various sectors, primarily in the personal care and cosmetics industry. The US is the major consumer of this compound due to its superior properties, which include moisturizing, skin conditioning, and antioxidant effects. The increasing consumption of personal care products and cosmetics, the rising demand for household cleaners, and the industrial applications of glyoxylic acid are driving its market growth. Moreover, the cost-effective nature and unique functional properties of glyoxylic acid, coupled with regulatory approvals from key agencies like the US Food and Drug Administration (FDA) and European Medicines Agency (EMA), are further bolstering the market's expansion.

        Additionally, the growing export of cosmetics from North America is providing an impetus to the market. Beyond personal care and cosmetics, glyoxylic acid's applications extend to industries such as food additives, bio-based monomers, and epoxy resins. The circular economy and waste management sectors are also exploring the potential of glyoxylic acid in bio-based economy and green technologies. The development of catalysts, pricing strategies, and chemical synthesis techniques are crucial aspects of the market, ensuring sustainable production and adherence to safety standards. As the demand for bio-based materials, intermediates, and products continues to rise, glyoxylic acid's role in the value chain becomes increasingly significant.

        Companies focusing on production capacity expansion, quality control, and supply chain optimization are gaining a competitive advantage in this evolving market landscape. Environmental regulations, such as those related to carbon footprint and sustainability, are also shaping the market dynamics. Acetic acid and formic acid, which are closely related to glyoxylic acid, are also experiencing similar trends and growth patterns. In summary, the North American the market is witnessing robust expansion, fueled by its applications in various industries, cost-effectiveness, and regulatory approvals. The market's growth is further supported by the increasing demand for bio-based materials, intermediates, and products, as well as the ongoing focus on sustainability and environmental regulations.

        Market Dynamics

        Our researchers analyzed the data with 2023 as the base year, along with the key drivers, trends, and challenges. A holistic analysis of drivers will help companies refine their marketing strategies to gain a competitive advantage.

        What are the key market drivers leading to the rise in the adoption of Glyoxylic Acid Industry?

        • Growing demand from cosmetics industry is the key driver of the market. 

        • Glyoxylic acid plays a significant role in the personal care and cosmetics industry, serving as a crucial ingredient in various products including skincare, nail care, hair care, and men's care. The increasing demand for these applications is driving the growth of the market. This acid is utilized in chemical peels and anti-aging products such as creams, lotions, and masks, offering numerous benefits like rejuvenation and moisturization. A smaller percentage is employed in skincare, haircare, and nail care items. The market is undergoing substantial transformations due to the expanding cosmetics and personal care industry, rising standards of living, rapid urbanization, increasing demand from APAC, Latin America, and Middle Eastern countries, demographic shifts, escalating exports from mature markets, and growing disposable income.
        • These factors are collectively fueling the market's expansion.

        What are the market trends shaping the Glyoxylic Acid Industry?

        • Surging demand from APAC and North America is the upcoming market trend. 

        • Glyoxylic acid is a significant chemical compound with various applications. The Asia Pacific (APAC) region is projected to be the fastest-growing market due to its large population, increasing demand from various sectors, demographic shifts, and rising disposable income. The untapped market potential and regulatory bodies encouraging the use of glyoxylic acid in personal care and cosmetics are major growth drivers. Emerging economies like India, China, and Association of Southeast Asian Nations (ASEAN) countries are generating significant demand.
        • The primary factor fueling the market growth in APAC is the increasing per capita spending on cosmetics. This trend is expected to continue, driving The market's expansion.

        What challenges does the Glyoxylic Acid Industry face during its growth?

        • Increase in negative effects of glyoxylic acid leading to skin diseases is a key challenge affecting the industry growth. 

        • Glyoxylic acid is a significant ingredient in the cosmetics and personal care industry due to its exfoliating properties. However, its usage is limited to lower concentrations, typically less than 10%, due to potential side effects. At higher concentrations, glyoxylic acid can cause irritation, swelling, itching, and even skin diseases. Severe reactions may include stinging, burning, temporary redness, crusting, scabbing, flaking, and peeling.
        • The most significant risk associated with glyoxylic acid is the potential for skin burns. Therefore, it is crucial for cosmetic companies to maintain careful control over the concentration of glyoxylic acid in their products to ensure customer safety and satisfaction.

        Exclusive Customer Landscape

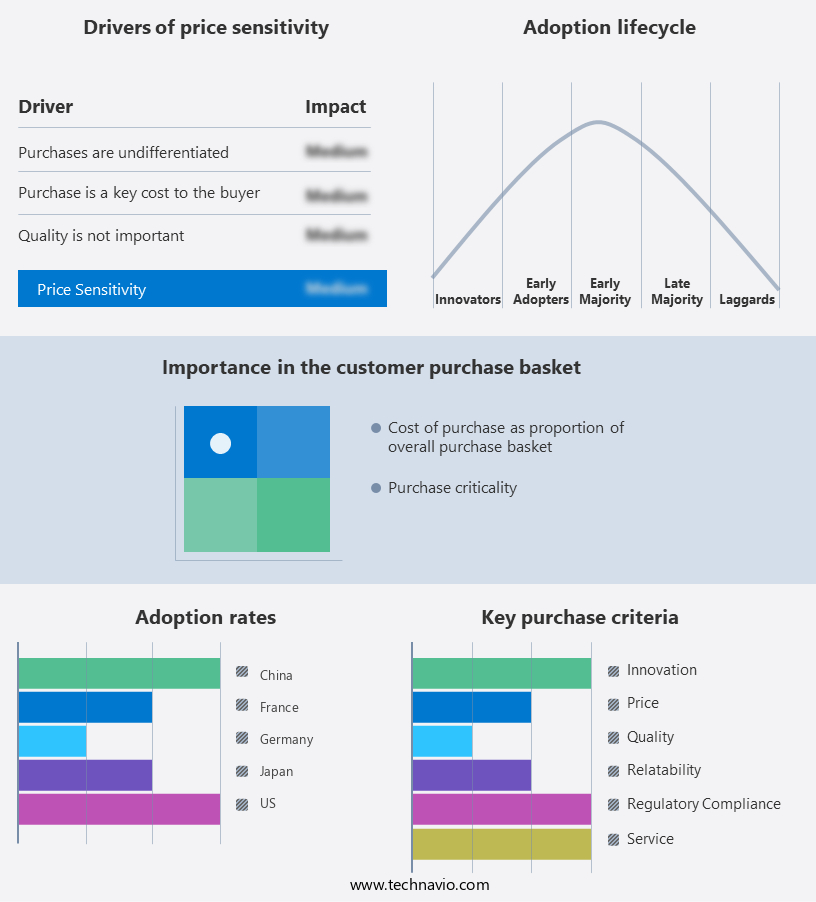
        The glyoxylic acid market forecasting report includes the adoption lifecycle of the market, covering from the innovator’s stage to the laggard’s stage. It focuses on adoption rates in different regions based on penetration. Furthermore, the glyoxylic acid market report also includes key purchase criteria and drivers of price sensitivity to help companies evaluate and develop their market growth analysis strategies.

        Glyoxylic Acid Market Share by Geography

         Customer Landscape

        Key Companies & Market Insights

        Companies are implementing various strategies, such as strategic alliances, glyoxylic acid market forecast, partnerships, mergers and acquisitions, geographical expansion, and product/service launches, to enhance their presence in the industry.

        Akema Srl - Glyoxylic acid 50H, a key ingredient in hair care formulations, contributes to the straightening and management of wavy and curly hair textures. This versatile compound enhances the overall appearance and feel of hair, ensuring smoothness and ease in styling. Its application in cosmetic products offers consumers a more manageable and sleek look, making it an essential component in the beauty industry.

        The industry research and growth report includes detailed analyses of the competitive landscape of the market and information about key companies, including:

        • Akema Srl
        • Avid Organics
        • CABB Group GmbH
        • China Petrochemical Corp.
        • CrossChem SIA
        • Haihang Industry Co. Ltd.
        • Hefei TNJ Chemical Industry Co. Ltd.
        • Jiaxing Zhonghua Chemical Co. Ltd.
        • Mehul Dye Chem Industries
        • Merck KGaA
        • Parchem Fine and Specialty Chemicals Inc.
        • Phibro Animal Health Corp.
        • Saanvi Corp.
        • Shandong Xinhua Pharmaceutical I and E Co. Ltd.
        • STAN Chemical Co. Ltd.
        • The Chemours Co.
        • Water Chemical Co. Ltd.
        • WeylChem International GmbH
        • Zhonglan Industry Co. Ltd.

        Qualitative and quantitative analysis of companies has been conducted to help clients understand the wider business environment as well as the strengths and weaknesses of key industry players. Data is qualitatively analyzed to categorize companies as pure play, category-focused, industry-focused, and diversified; it is quantitatively analyzed to categorize companies as dominant, leading, strong, tentative, and weak.

        Research Analyst Overview

        Glyoxylic acid, a versatile organic compound derived from renewable resources, has been gaining significant attention in various industries due to its unique properties and potential applications. This bio-based intermediate plays a crucial role in the production of various bio-based monomers, polymers, and chemicals, making it an essential component in the bio-based economy. The reaction engineering involved in the production of glyoxylic acid is a critical factor in optimizing the process for maximum efficiency and yield. The use of green technologies, such as catalyst development and sustainable production methods, is essential to minimize the carbon footprint of the manufacturing process. These initiatives not only reduce the environmental impact but also provide a competitive advantage for companies in the industry.

        The food additives sector is one of the primary end-use industries for glyoxylic acid. Its use as a bio-based intermediate in the synthesis of polyester resins and epoxy resins enhances the properties of these materials, making them suitable for various applications. The demand for bio-based materials in the production of food additives is driven by consumer preferences for natural and sustainable products. The distribution channels for glyoxylic acid are diverse, with various intermediates and end-products finding applications in various industries. Bio-based intermediates, such as glyoxylic acid, play a vital role in the circular economy by enabling the production of biodegradable polymers and other bio-based products.

        These materials offer a sustainable alternative to traditional petroleum-based products, reducing waste and minimizing the environmental impact of production and disposal. The bio-based chemicals industry is experiencing consolidation, with companies focusing on increasing production capacity and optimizing processes to meet the growing demand for sustainable alternatives. Quality control and safety standards are essential in this industry, ensuring that products meet regulatory requirements and consumer expectations. The production of glyoxylic acid from renewable resources, such as biomass, offers a sustainable alternative to traditional production methods using oxalic acid. This shift towards renewable resources is driven by environmental regulations and the need to reduce the carbon footprint of the chemical industry.

        The pricing strategies of companies in the market are influenced by various factors, including production costs, demand dynamics, and competitive pressures. Process optimization and supply chain management are essential for maintaining a competitive edge in the market. The organic chemistry of glyoxylic acid and its derivatives offers significant potential for the development of new applications and products. Research and development efforts in this area are focused on improving the efficiency and sustainability of production processes and expanding the range of applications for these bio-based materials. In conclusion, the market is dynamic and evolving, driven by various factors, including consumer preferences, regulatory requirements, and technological advancements.

        The use of renewable resources, green technologies, and sustainable production methods is essential for reducing the carbon footprint of the industry and providing a competitive advantage. The potential applications of glyoxylic acid and its derivatives are diverse, making it an essential component in various industries, including food additives, bio-based materials, and bio-based intermediates.

        Market Scope

        Report Coverage

        Details

        Page number

        141

        Base year

        2023

        Historic period

        2018-2022

        Forecast period

        2024-2028

        Growth momentum & CAGR

        Accelerate at a CAGR of 4.49%

        Market growth 2024-2028

        USD 192.5 million

        Market structure

        Fragmented

        YoY growth 2023-2024(%)

        4.23

        Key countries

        US, China, Germany, France, and Japan

        Competitive landscape

        Leading Companies, Market Positioning of Companies, Competitive Strategies, and Industry Risks

        Request Free Sample

        What are the Key Data Covered in this Glyoxylic Acid Market Research and Growth Report?

        • CAGR of the Glyoxylic Acid industry during the forecast period
        • Detailed information on factors that will drive the growth and forecasting between 2024 and 2028
        • Precise estimation of the size of the market and its contribution of the industry in focus to the parent market
        • Accurate predictions about upcoming growth and trends and changes in consumer behaviour
        • Growth of the market across North America, APAC, Europe, South America, and Middle East and Africa
        • Thorough analysis of the market’s competitive landscape and detailed information about companies
        • Comprehensive analysis of factors that will challenge the glyoxylic acid market growth of industry companies

        We can help! Our analysts can customize this glyoxylic acid market research report to meet your requirements.

        Get in touch


        1 Executive Summary

        • 1.1 Market overview
          • Executive Summary - Chart on Market Overview
          • Executive Summary - Data Table on Market Overview
          • Executive Summary - Chart on Global Market Characteristics
          • Executive Summary - Chart on Market by Geography
          • Executive Summary - Chart on Market Segmentation by End-user
          • Executive Summary - Chart on Incremental Growth
          • Executive Summary - Data Table on Incremental Growth
          • Executive Summary - Chart on Company Market Positioning

        2 Market Landscape

        • 2.1 Market ecosystem
          • Parent Market
          • Data Table on - Parent Market
        • 2.2 Market characteristics
          • Market characteristics analysis
        • 2.3 Value chain analysis
          • Value Chain Analysis

        3 Market Sizing

        • 3.1 Market definition
          • Offerings of companies included in the market definition
        • 3.2 Market segment analysis
          • Market segments
        • 3.3 Market size 2023
          • 3.4 Market outlook: Forecast for 2023-2028
            • Chart on Global - Market size and forecast 2023-2028 ($ million)
            • Data Table on Global - Market size and forecast 2023-2028 ($ million)
            • Chart on Global Market: Year-over-year growth 2023-2028 (%)
            • Data Table on Global Market: Year-over-year growth 2023-2028 (%)

          4 Historic Market Size

          • 4.1 Global Glyoxylic Acid Market 2018 - 2022
            • Historic Market Size - Data Table on Global Glyoxylic Acid Market 2018 - 2022 ($ million)
          • 4.2 End-user segment analysis 2018 - 2022
            • Historic Market Size - End-user Segment 2018 - 2022 ($ million)
          • 4.3 Geography segment analysis 2018 - 2022
            • Historic Market Size - Geography Segment 2018 - 2022 ($ million)
          • 4.4 Country segment analysis 2018 - 2022
            • Historic Market Size - Country Segment 2018 - 2022 ($ million)

          5 Five Forces Analysis

          • 5.1 Five forces summary
            • Five forces analysis - Comparison between 2023 and 2028
          • 5.2 Bargaining power of buyers
            • Bargaining power of buyers - Impact of key factors 2023 and 2028
          • 5.3 Bargaining power of suppliers
            • Bargaining power of suppliers - Impact of key factors in 2023 and 2028
          • 5.4 Threat of new entrants
            • Threat of new entrants - Impact of key factors in 2023 and 2028
          • 5.5 Threat of substitutes
            • Threat of substitutes - Impact of key factors in 2023 and 2028
          • 5.6 Threat of rivalry
            • Threat of rivalry - Impact of key factors in 2023 and 2028
          • 5.7 Market condition
            • Chart on Market condition - Five forces 2023 and 2028

          6 Market Segmentation by End-user

          • 6.1 Market segments
            • Chart on End-user - Market share 2023-2028 (%)
            • Data Table on End-user - Market share 2023-2028 (%)
          • 6.2 Comparison by End-user
            • Chart on Comparison by End-user
            • Data Table on Comparison by End-user
          • 6.3 Cosmetics and personal care - Market size and forecast 2023-2028
            • Chart on Cosmetics and personal care - Market size and forecast 2023-2028 ($ million)
            • Data Table on Cosmetics and personal care - Market size and forecast 2023-2028 ($ million)
            • Chart on Cosmetics and personal care - Year-over-year growth 2023-2028 (%)
            • Data Table on Cosmetics and personal care - Year-over-year growth 2023-2028 (%)
          • 6.4 Pharmaceutical - Market size and forecast 2023-2028
            • Chart on Pharmaceutical - Market size and forecast 2023-2028 ($ million)
            • Data Table on Pharmaceutical - Market size and forecast 2023-2028 ($ million)
            • Chart on Pharmaceutical - Year-over-year growth 2023-2028 (%)
            • Data Table on Pharmaceutical - Year-over-year growth 2023-2028 (%)
          • 6.5 Agrochemicals - Market size and forecast 2023-2028
            • Chart on Agrochemicals - Market size and forecast 2023-2028 ($ million)
            • Data Table on Agrochemicals - Market size and forecast 2023-2028 ($ million)
            • Chart on Agrochemicals - Year-over-year growth 2023-2028 (%)
            • Data Table on Agrochemicals - Year-over-year growth 2023-2028 (%)
          • 6.6 Aromas - Market size and forecast 2023-2028
            • Chart on Aromas - Market size and forecast 2023-2028 ($ million)
            • Data Table on Aromas - Market size and forecast 2023-2028 ($ million)
            • Chart on Aromas - Year-over-year growth 2023-2028 (%)
            • Data Table on Aromas - Year-over-year growth 2023-2028 (%)
          • 6.7 Others - Market size and forecast 2023-2028
            • Chart on Others - Market size and forecast 2023-2028 ($ million)
            • Data Table on Others - Market size and forecast 2023-2028 ($ million)
            • Chart on Others - Year-over-year growth 2023-2028 (%)
            • Data Table on Others - Year-over-year growth 2023-2028 (%)
          • 6.8 Market opportunity by End-user
            • Market opportunity by End-user ($ million)
            • Data Table on Market opportunity by End-user ($ million)

          7 Customer Landscape

          • 7.1 Customer landscape overview
            • Analysis of price sensitivity, lifecycle, customer purchase basket, adoption rates, and purchase criteria

          8 Geographic Landscape

          • 8.1 Geographic segmentation
            • Chart on Market share by geography 2023-2028 (%)
            • Data Table on Market share by geography 2023-2028 (%)
          • 8.2 Geographic comparison
            • Chart on Geographic comparison
            • Data Table on Geographic comparison
          • 8.3 North America - Market size and forecast 2023-2028
            • Chart on North America - Market size and forecast 2023-2028 ($ million)
            • Data Table on North America - Market size and forecast 2023-2028 ($ million)
            • Chart on North America - Year-over-year growth 2023-2028 (%)
            • Data Table on North America - Year-over-year growth 2023-2028 (%)
          • 8.4 APAC - Market size and forecast 2023-2028
            • Chart on APAC - Market size and forecast 2023-2028 ($ million)
            • Data Table on APAC - Market size and forecast 2023-2028 ($ million)
            • Chart on APAC - Year-over-year growth 2023-2028 (%)
            • Data Table on APAC - Year-over-year growth 2023-2028 (%)
          • 8.5 Europe - Market size and forecast 2023-2028
            • Chart on Europe - Market size and forecast 2023-2028 ($ million)
            • Data Table on Europe - Market size and forecast 2023-2028 ($ million)
            • Chart on Europe - Year-over-year growth 2023-2028 (%)
            • Data Table on Europe - Year-over-year growth 2023-2028 (%)
          • 8.6 South America - Market size and forecast 2023-2028
            • Chart on South America - Market size and forecast 2023-2028 ($ million)
            • Data Table on South America - Market size and forecast 2023-2028 ($ million)
            • Chart on South America - Year-over-year growth 2023-2028 (%)
            • Data Table on South America - Year-over-year growth 2023-2028 (%)
          • 8.7 Middle East and Africa - Market size and forecast 2023-2028
            • Chart on Middle East and Africa - Market size and forecast 2023-2028 ($ million)
            • Data Table on Middle East and Africa - Market size and forecast 2023-2028 ($ million)
            • Chart on Middle East and Africa - Year-over-year growth 2023-2028 (%)
            • Data Table on Middle East and Africa - Year-over-year growth 2023-2028 (%)
          • 8.8 US - Market size and forecast 2023-2028
            • Chart on US - Market size and forecast 2023-2028 ($ million)
            • Data Table on US - Market size and forecast 2023-2028 ($ million)
            • Chart on US - Year-over-year growth 2023-2028 (%)
            • Data Table on US - Year-over-year growth 2023-2028 (%)
          • 8.9 China - Market size and forecast 2023-2028
            • Chart on China - Market size and forecast 2023-2028 ($ million)
            • Data Table on China - Market size and forecast 2023-2028 ($ million)
            • Chart on China - Year-over-year growth 2023-2028 (%)
            • Data Table on China - Year-over-year growth 2023-2028 (%)
          • 8.10 Germany - Market size and forecast 2023-2028
            • Chart on Germany - Market size and forecast 2023-2028 ($ million)
            • Data Table on Germany - Market size and forecast 2023-2028 ($ million)
            • Chart on Germany - Year-over-year growth 2023-2028 (%)
            • Data Table on Germany - Year-over-year growth 2023-2028 (%)
          • 8.11 France - Market size and forecast 2023-2028
            • Chart on France - Market size and forecast 2023-2028 ($ million)
            • Data Table on France - Market size and forecast 2023-2028 ($ million)
            • Chart on France - Year-over-year growth 2023-2028 (%)
            • Data Table on France - Year-over-year growth 2023-2028 (%)
          • 8.12 Japan - Market size and forecast 2023-2028
            • Chart on Japan - Market size and forecast 2023-2028 ($ million)
            • Data Table on Japan - Market size and forecast 2023-2028 ($ million)
            • Chart on Japan - Year-over-year growth 2023-2028 (%)
            • Data Table on Japan - Year-over-year growth 2023-2028 (%)
          • 8.13 Market opportunity by geography
            • Market opportunity by geography ($ million)
            • Data Tables on Market opportunity by geography ($ million)

          9 Drivers, Challenges, and Opportunity/Restraints

          • 9.1 Market drivers
            • 9.2 Market challenges
              • 9.3 Impact of drivers and challenges
                • Impact of drivers and challenges in 2023 and 2028
              • 9.4 Market opportunities/restraints

                10 Competitive Landscape

                • 10.1 Overview
                  • 10.2 Competitive Landscape
                    • Overview on criticality of inputs and factors of differentiation
                  • 10.3 Landscape disruption
                    • Overview on factors of disruption
                  • 10.4 Industry risks
                    • Impact of key risks on business

                  11 Competitive Analysis

                  • 11.1 Companies profiled
                    • Companies covered
                  • 11.2 Market positioning of companies
                    • Matrix on companies position and classification
                  • 11.3 Akema Srl
                    • Akema Srl - Overview
                    • Akema Srl - Product / Service
                    • Akema Srl - Key offerings
                  • 11.4 CABB Group GmbH
                    • CABB Group GmbH - Overview
                    • CABB Group GmbH - Product / Service
                    • CABB Group GmbH - Key offerings
                  • 11.5 CrossChem SIA
                    • CrossChem SIA - Overview
                    • CrossChem SIA - Product / Service
                    • CrossChem SIA - Key offerings
                  • 11.6 Haihang Industry Co. Ltd.
                    • Haihang Industry Co. Ltd. - Overview
                    • Haihang Industry Co. Ltd. - Product / Service
                    • Haihang Industry Co. Ltd. - Key offerings
                  • 11.7 Jiaxing Zhonghua Chemical Co. Ltd.
                    • Jiaxing Zhonghua Chemical Co. Ltd. - Overview
                    • Jiaxing Zhonghua Chemical Co. Ltd. - Product / Service
                    • Jiaxing Zhonghua Chemical Co. Ltd. - Key offerings
                  • 11.8 Merck KGaA
                    • Merck KGaA - Overview
                    • Merck KGaA - Business segments
                    • Merck KGaA - Key news
                    • Merck KGaA - Key offerings
                    • Merck KGaA - Segment focus
                  • 11.9 STAN Chemical Co. Ltd.
                    • STAN Chemical Co. Ltd. - Overview
                    • STAN Chemical Co. Ltd. - Product / Service
                    • STAN Chemical Co. Ltd. - Key offerings
                  • 11.10 The Chemours Co.
                    • The Chemours Co. - Overview
                    • The Chemours Co. - Business segments
                    • The Chemours Co. - Key news
                    • The Chemours Co. - Key offerings
                    • The Chemours Co. - Segment focus
                  • 11.11 WeylChem International GmbH
                    • WeylChem International GmbH - Overview
                    • WeylChem International GmbH - Product / Service
                    • WeylChem International GmbH - Key news
                    • WeylChem International GmbH - Key offerings
                  • 11.12 Zhonglan Industry Co. Ltd.
                    • Zhonglan Industry Co. Ltd. - Overview
                    • Zhonglan Industry Co. Ltd. - Product / Service
                    • Zhonglan Industry Co. Ltd. - Key offerings

                  12 Appendix

                  • 12.1 Scope of the report
                    • 12.2 Inclusions and exclusions checklist
                      • Inclusions checklist
                      • Exclusions checklist
                    • 12.3 Currency conversion rates for US$
                      • Currency conversion rates for US$
                    • 12.4 Research methodology
                      • Research methodology
                    • 12.5 Data procurement
                      • Information sources
                    • 12.6 Data validation
                      • Data validation
                    • 12.7 Validation techniques employed for market sizing
                      • Validation techniques employed for market sizing
                    • 12.8 Data synthesis
                      • Data synthesis
                    • 360 degree market analysis
                      • 360 degree market analysis
                    • 12.10 List of abbreviations
                      • List of abbreviations

                    Research Methodology

                    Technavio presents a detailed picture of the market by way of study, synthesis, and summation of data from multiple sources. The analysts have presented the various facets of the market with a particular focus on identifying the key industry influencers. The data thus presented is comprehensive, reliable, and the result of extensive research, both primary and secondary.

                    INFORMATION SOURCES

                    Primary sources

                    • Manufacturers and suppliers
                    • Channel partners
                    • Industry experts
                    • Strategic decision makers

                    Secondary sources

                    • Industry journals and periodicals
                    • Government data
                    • Financial reports of key industry players
                    • Historical data
                    • Press releases

                    DATA ANALYSIS

                    Data Synthesis

                    • Collation of data
                    • Estimation of key figures
                    • Analysis of derived insights

                    Data Validation

                    • Triangulation with data models
                    • Reference against proprietary databases
                    • Corroboration with industry experts

                    REPORT WRITING

                    Qualitative

                    • Market drivers
                    • Market challenges
                    • Market trends
                    • Five forces analysis

                    Quantitative

                    • Market size and forecast
                    • Market segmentation
                    • Geographical insights
                    • Competitive landscape

                    Interested in this report?

                    Get your sample now to see our research methodology and insights!

                    Download Now

                    Frequently Asked Questions

                    Glyoxylic Acid market growth will increase by $ 192.5 mn during 2024-2028 .

                    The Glyoxylic Acid market is expected to grow at a CAGR of 4.49% during 2024-2028 .

                    Glyoxylic Acid market is segmented by End-user( Cosmetics and personal care, Pharmaceutical, Agrochemicals, Aromas, Others)

                    Akema Srl, Avid Organics, CABB Group GmbH, China Petrochemical Corp., CrossChem SIA, Haihang Industry Co. Ltd., Hefei TNJ Chemical Industry Co. Ltd., Jiaxing Zhonghua Chemical Co. Ltd., Mehul Dye Chem Industries, Merck KGaA, Parchem Fine and Specialty Chemicals Inc., Phibro Animal Health Corp., Saanvi Corp., Shandong Xinhua Pharmaceutical I and E Co. Ltd., STAN Chemical Co. Ltd., The Chemours Co., Water Chemical Co. Ltd., WeylChem International GmbH, Zhonglan Industry Co. Ltd. are a few of the key vendors in the Glyoxylic Acid market.

                    APAC will register the highest growth rate of 41% among the other regions. Therefore, the Glyoxylic Acid market in APAC is expected to garner significant business opportunities for the vendors during the forecast period.

                    US, China, Germany, France, Japan

                    • Growing demand from cosmetics industryGlyoxylic acid is largely used in personal care and cosmetics. It is used as an ingredient in major products such as skincare is the driving factor this market.
                    • nail care is the driving factor this market.
                    • hair care is the driving factor this market.
                    • and men's care products. An increase in demand from these applications is generating huge demand for glyoxylic acid in the personal care segment. Glyoxylic acid is used in chemical peels and anti-aging creams is the driving factor this market.
                    • lotions is the driving factor this market.
                    • and mask products. It offers many benefits to the skin is the driving factor this market.
                    • from rejuvenating to moisturizing. A lower percentage of glyoxylic acid is used in skincare is the driving factor this market.
                    • haircare is the driving factor this market.
                    • and nail care products. The global glyoxylic acid market is experiencing a lot of changes due to the variety of cosmetics and personal care products is the driving factor this market.
                    • rise in the standard of living is the driving factor this market.
                    • rapid urbanization is the driving factor this market.
                    • rise in demand from APAC is the driving factor this market.
                    • Latin America is the driving factor this market.
                    • and Middle East countries is the driving factor this market.
                    • demographic changes is the driving factor this market.
                    • increase in exports from mature markets is the driving factor this market.
                    • and rise in disposable income. All these factors will fuel the growth of the glyoxylic acid market during the forecast period. is the driving factor this market.

                    The Glyoxylic Acid market vendors should focus on grabbing business opportunities from the Cosmetics and personal care segment as it accounted for the largest market share in the base year.