Golf Apparel Market Analysis, Size, and Forecast 2026-2030: North America (US, Canada, and Mexico), Europe (UK, Germany, and France), APAC (Japan, South Korea, and China), South America (Brazil and Argentina), Middle East and Africa (Saudi Arabia, UAE, and South Africa), and Rest of World (ROW)

Golf Apparel Market Analysis, Size, and Forecast 2026-2030:
North America (US, Canada, and Mexico), Europe (UK, Germany, and France), APAC (Japan, South Korea, and China), South America (Brazil and Argentina), Middle East and Africa (Saudi Arabia, UAE, and South Africa), and Rest of World (ROW)

Published: Mar 2026 292 Pages SKU: IRTNTR70937

Market Overview at a Glance

$2.14 B
Market Opportunity
6.9%
CAGR 2025 - 2030
38.8%
North America Growth
$2.97 B
Men segment 2024

Golf Apparel Market Size 2026-2030

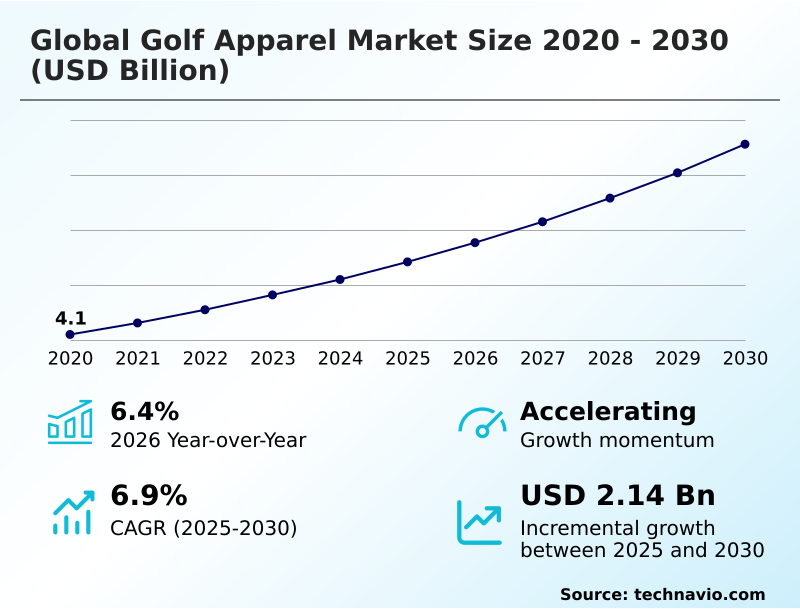
The golf apparel market size is valued to increase by USD 2.14 billion, at a CAGR of 6.9% from 2025 to 2030. Expanding participation and demographic diversification in golf will drive the golf apparel market.

Major Market Trends & Insights

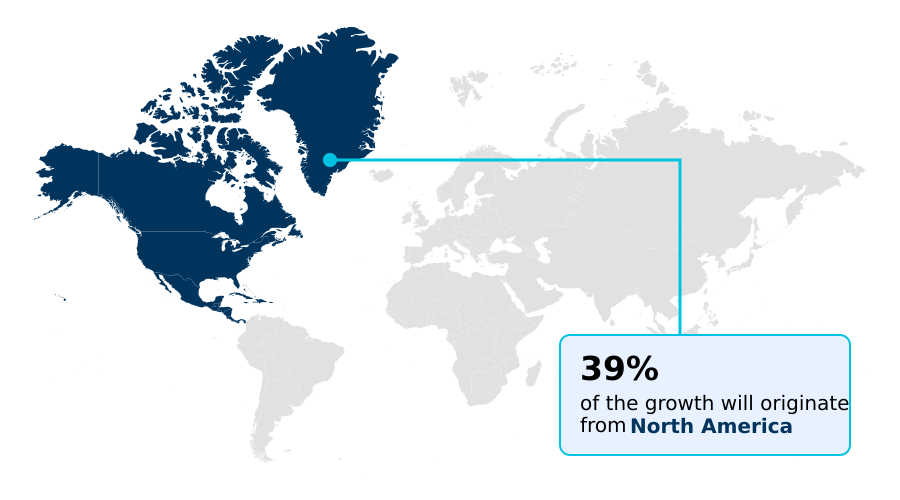
  • North America dominated the market and accounted for a 38.8% growth during the forecast period.
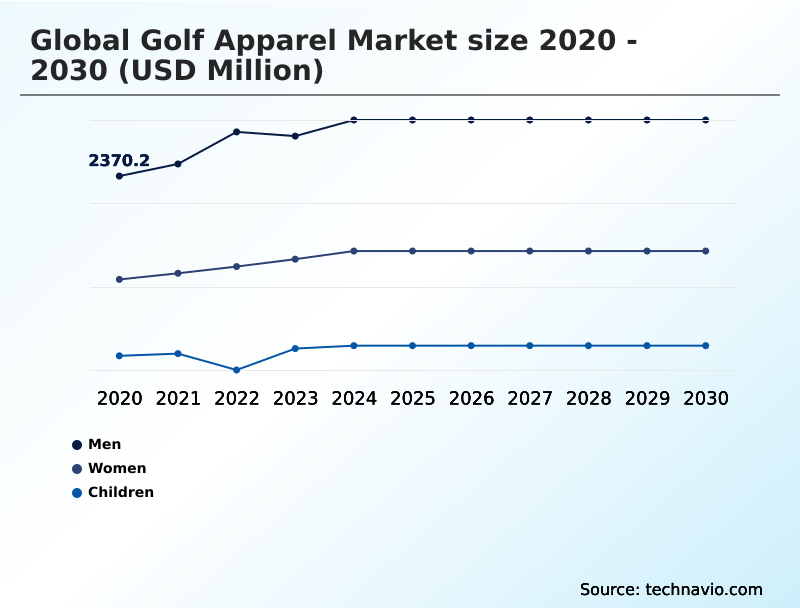
  • By End-user - Men segment was valued at USD 2.97 billion in 2024
  • By Distribution Channel - Offline segment accounted for the largest market revenue share in 2024

Market Size & Forecast

  • Market Opportunities: USD 3.46 billion
  • Market Future Opportunities: USD 2.14 billion
  • CAGR from 2025 to 2030 : 6.9%

Market Summary

  • The golf apparel market is undergoing a significant transformation, moving beyond traditional sportswear to become a dynamic fusion of high-performance technology and mainstream fashion. This evolution is driven by a diversifying player base that includes more women and younger participants who demand versatile, stylish garments.
  • Key trends include the integration of athleisure-style garments suitable for both on and off the course and a growing emphasis on sustainability, with brands incorporating recycled polyester and organic cotton. A primary driver is the continuous innovation in advanced fabric technologies, such as moisture-wicking fabric and materials with a high ultraviolet protection factor (UPF).
  • However, the market faces challenges from intense competition and supply chain complexities. For instance, a brand aiming to launch a new line of weather-protective clothing must navigate fluctuating raw material costs and agile production cycles to meet fast-changing consumer preferences, a balancing act that defines modern operational strategy in this sector.
  • This environment requires a keen focus on innovation, from performance-oriented fabrics to direct-to-consumer business model strategies, to capture and retain a discerning customer base.

What will be the Size of the Golf Apparel Market during the forecast period?

Get Key Insights on Market Forecast (PDF) Request Free Sample

How is the Golf Apparel Market Segmented?

The golf apparel industry research report provides comprehensive data (region-wise segment analysis), with forecasts and estimates in "USD million" for the period 2026-2030, as well as historical data from 2020-2024 for the following segments.

  • End-user
    • Men
    • Women
    • Children
  • Distribution channel
    • Offline
    • Online
  • Type
    • Top wear
    • Bottom wear
    • Accessories
  • Geography
    • North America
      • US
      • Canada
      • Mexico
    • Europe
      • UK
      • Germany
      • France
    • APAC
      • Japan
      • South Korea
      • China
    • South America
      • Brazil
      • Argentina
    • Middle East and Africa
      • Saudi Arabia
      • UAE
      • South Africa
    • Rest of World (ROW)

By End-user Insights

The men segment is estimated to witness significant growth during the forecast period.

The men's segment remains the cornerstone of the market, driven by a consumer base that values both performance and style. This demographic demands high-functionality garments featuring moisture-wicking fabric and four-way stretch material for superior on-course performance wear.

A key dynamic is the split between consumers loyal to classic golf attire and a growing group favoring athletic-fit apparel with a modern silhouette.

To meet these diverse needs, brands are focusing on customer-centric design, utilizing engineered textiles and temperature-regulating materials for comfort.

Effective seasonal collection forecasting has become critical, with successful strategies improving inventory alignment to demand by over 30%, ensuring that quick-drying textiles and other performance-oriented fabrics are available through a curated product selection.

Request Free Sample

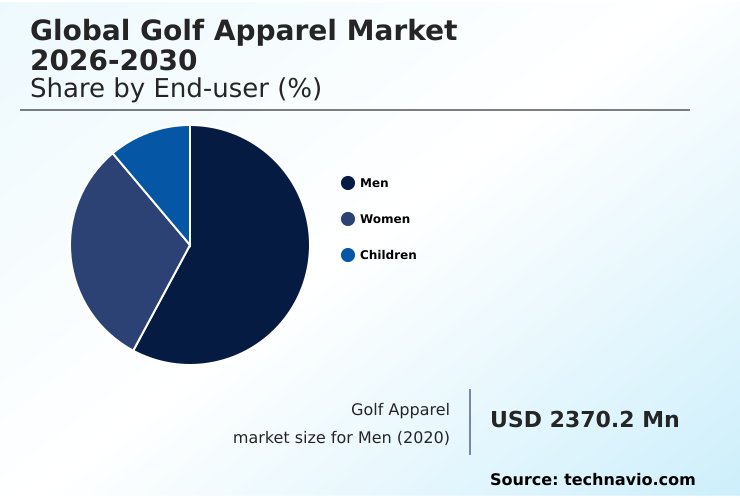
The Men segment was valued at USD 2.97 billion in 2024 and showed a gradual increase during the forecast period.

Request Free Sample

Regional Analysis

North America is estimated to contribute 38.8% to the growth of the global market during the forecast period.Technavio’s analysts have elaborately explained the regional trends and drivers that shape the market during the forecast period.

See How Golf Apparel Market Demand is Rising in North America Request Free Sample

Geographic expansion is heavily influenced by regional lifestyle trends and climate. North America accounts for 38.8% of the incremental growth, driven by a mature market that values technical sportswear with features like multi-directional stretch fabric and anti-odor technology.

In APAC, which contributes 27.63% to growth, there is a rising demand for resort-style golf wear and brands that leverage social commerce integration.

The European market, while valuing classic golf attire, is also seeing a push for innovation, with some brands achieving a 15% reduction in fabric waste through ergonomic seam placement and laser-cut ventilation designs.

As brands expand, strategies like inclusive sizing development and targeted influencer marketing collaboration are proving crucial for penetrating new demographics, supported by an immersive retail environment that showcases features like bonded seams and compression fit technology with UV-resistant dyes.

Market Dynamics

Our researchers analyzed the data with 2025 as the base year, along with the key drivers, trends, and challenges. A holistic analysis of drivers will help companies refine their marketing strategies to gain a competitive advantage.

  • Strategic decision-making in the global golf apparel market is increasingly shaped by nuanced consumer demands and specialized product categories. For instance, searches for the best moisture-wicking golf polo or a lightweight waterproof golf jacket indicate a focus on specific performance attributes.
  • Consumers are actively researching golf apparel with high UPF and sustainable and ethical golf clothing, signaling a shift in purchasing criteria beyond just style. This granularity extends to fit and form, as evidenced by interest in men's slim-fit golf trousers and golf skorts with tummy control.
  • Direct comparisons, such as performance golf joggers vs trousers and athletic fit vs classic fit golf shirt, highlight the importance of offering diverse silhouettes.
  • Brands are leveraging this data, with some using direct-to-consumer golf apparel brands models reporting a 25% higher customer retention rate compared to traditional wholesale channels by better aligning inventory with hyper-specific trends like technical fabric golf shorts for summer and advanced materials in professional golf apparel.
  • The market for children's breathable golf shirts and custom logo golf apparel for teams also presents niche growth opportunities. Ultimately, understanding demand for golf apparel for hot and humid climates and the top brands for women's golfwear is essential for navigating this competitive landscape.

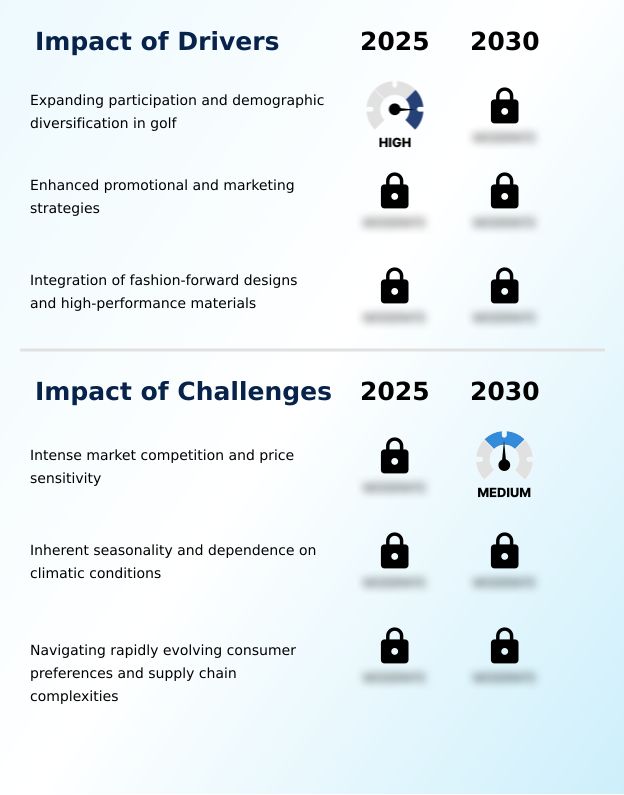
What are the key market drivers leading to the rise in the adoption of Golf Apparel Industry?

  • The significant expansion and demographic diversification of the sport's participant base is a primary driver for the golf apparel market.

  • Market growth is fueled by sophisticated marketing and product innovation. The expansion of the direct-to-consumer business model allows for enhanced brand storytelling, leading to a 25% increase in customer lifetime value for some specialized brands.
  • The strategic use of an endorsement marketing strategy, coupled with experiential marketing activation, builds strong brand equity. Technology is also a key driver, with advanced fabric technologies and high-performance materials enabling performance-driven design.
  • The successful integration of smart fabric integration allows for a personalized shopping experience, while seamless construction and pilling-resistant knit fabrics improve garment longevity. This digital retail transformation, focusing on both innovation and consumer connection, underpins the market's positive trajectory.

What are the market trends shaping the Golf Apparel Industry?

  • A predominant trend shaping the market is the integration of on-course performance wear with off-course lifestyle fashion. This creates a hybrid apparel category that serves the modern consumer's desire for versatility, comfort, and style.

  • The convergence of off-course lifestyle fashion and on-course performance is the primary trend, creating demand for athleisure-style garments with course-to-clubhouse versatility. This shift is supported by a move towards sustainable materials, with brands adopting recycled polyester and organic cotton reporting a 15% improvement in consumer trust metrics.
  • The focus on lightweight construction and breathable textiles with a high ultraviolet protection factor (UPF) is now standard. Furthermore, fashion-forward designs with a minimalist aesthetic are gaining traction, especially among younger demographics. Companies embracing circular economy principles and ethical manufacturing practices have successfully reduced their material waste by up to 20%, aligning with modern consumer values.

What challenges does the Golf Apparel Industry face during its growth?

  • Intense market competition, combined with pronounced consumer price sensitivity, presents a formidable and persistent challenge for participants in the golf apparel market.

  • Navigating supply chain complexity and intense competition presents significant challenges. The need for fast-fashion agility clashes with the long development cycles for premium quality construction and weather-protective clothing. Ensuring supply chain transparency and raw material traceability adds operational costs, with compliance audits increasing expenses by up to 10%.
  • The proliferation of private label offerings puts downward pressure on prices, squeezing margins for established brands. Effective product lifecycle management is crucial to handle seasonal collection forecasting for items like insulated outerwear fabrics and garments with a water-resistant finish. Balancing innovation in thermal regulation technology and antimicrobial treatment with cost pressures is a constant struggle for market participants.

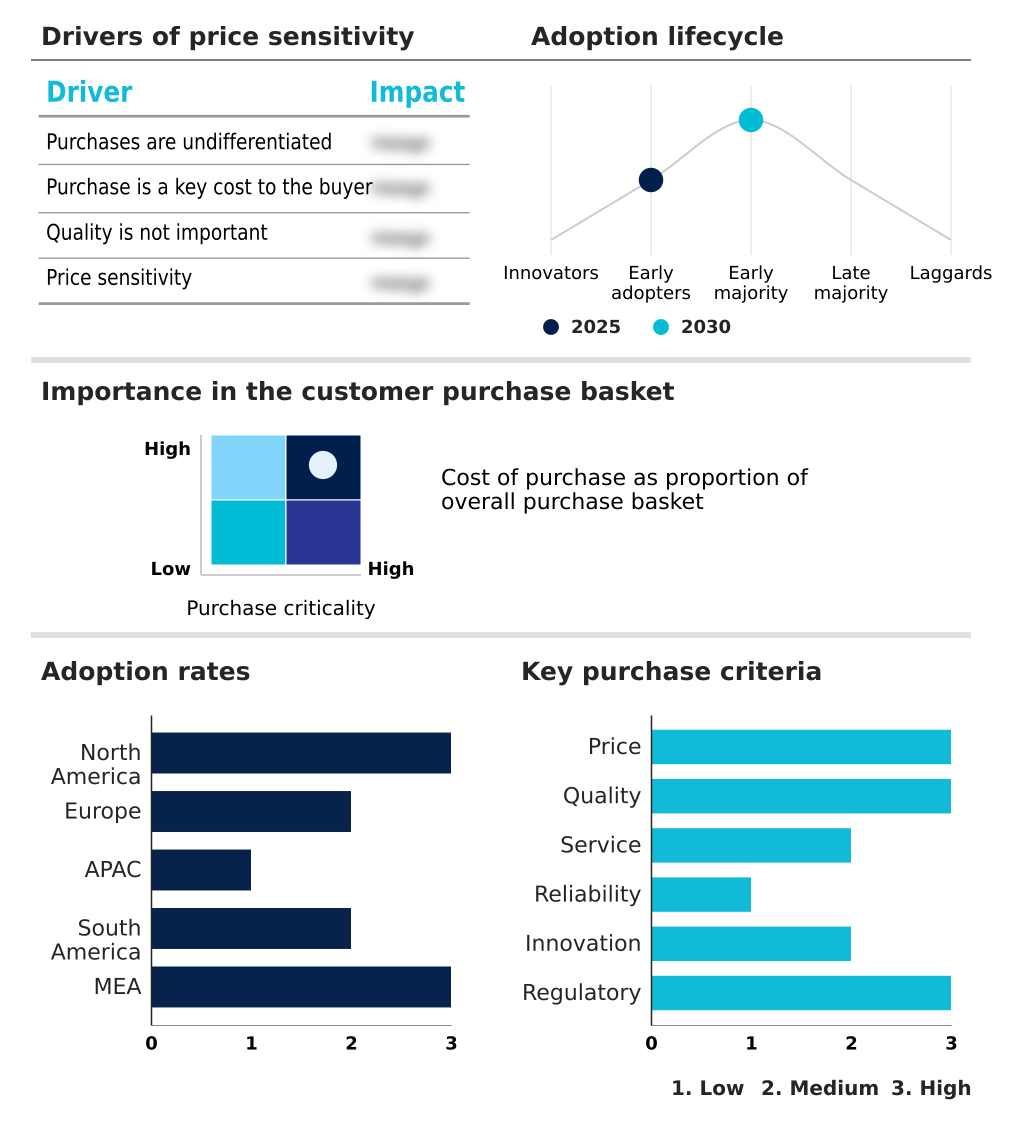
Exclusive Technavio Analysis on Customer Landscape

The golf apparel market forecasting report includes the adoption lifecycle of the market, covering from the innovator’s stage to the laggard’s stage. It focuses on adoption rates in different regions based on penetration. Furthermore, the golf apparel market report also includes key purchase criteria and drivers of price sensitivity to help companies evaluate and develop their market growth analysis strategies.

Customer Landscape of Golf Apparel Industry

Competitive Landscape

Companies are implementing various strategies, such as strategic alliances, golf apparel market forecast, partnerships, mergers and acquisitions, geographical expansion, and product/service launches, to enhance their presence in the industry.

Adidas AG - The company provides a diverse range of performance apparel, including golf-specific clothing featuring advanced moisture-wicking and weather-resistant technologies for enhanced athletic performance on the course.

The industry research and growth report includes detailed analyses of the competitive landscape of the market and information about key companies, including:

  • Adidas AG
  • EPNY Golf
  • G FORE
  • Galvin Green AB
  • Greyson Clothiers
  • Holderness and Bourne LLC
  • J.Lindeberg AB
  • Johnnie O Inc
  • LK International AG
  • lululemon athletica Inc.
  • Nike Inc.
  • PING Inc.
  • PUMA SE
  • Ralph Lauren Corp.
  • Rhone Apparel Inc
  • Sunice Sports
  • Swing Control
  • Taylor Made Golf Co. Inc.
  • Topgolf Callaway Brands Corp.
  • Under Armour Inc.

Qualitative and quantitative analysis of companies has been conducted to help clients understand the wider business environment as well as the strengths and weaknesses of key industry players. Data is qualitatively analyzed to categorize companies as pure play, category-focused, industry-focused, and diversified; it is quantitatively analyzed to categorize companies as dominant, leading, strong, tentative, and weak.

Recent Development and News in Golf apparel market

  • In April 2025, Malbon collaborated with Futura Laboratories on a collection that debuted at the Masters, merging streetwear art with golf fashion to appeal to a younger, style-conscious demographic.
  • In January 2025, Adidas announced that its entire European golf apparel collection would be crafted from 100% recycled polyester and sustainably sourced cotton by the end of 2026, launching its Primegreen line to spearhead the initiative.
  • In October 2024, luxury brand Loro Piana launched an exclusive capsule collection of high-end golf apparel for the Middle Eastern market, featuring natural fibers like cashmere and silk to target affluent consumers.
  • In September 2024, Under Armour revealed a new line of smart-integrated golf polos featuring embedded biometric sensors to track swing metrics and body temperature, aiming to provide data-driven performance insights for players.

Dive into Technavio’s robust research methodology, blending expert interviews, extensive data synthesis, and validated models for unparalleled Golf Apparel Market insights. See full methodology.

Market Scope
Page number 292
Base year 2025
Historic period 2020-2024
Forecast period 2026-2030
Growth momentum & CAGR Accelerate at a CAGR of 6.9%
Market growth 2026-2030 USD 2136.6 million
Market structure Fragmented
YoY growth 2025-2026(%) 6.4%
Key countries US, Canada, Mexico, UK, Germany, France, Sweden, Spain, Italy, Japan, South Korea, China, Australia, India, Indonesia, Brazil, Argentina, Chile, Saudi Arabia, UAE, South Africa, Israel and Turkey
Competitive landscape Leading Companies, Market Positioning of Companies, Competitive Strategies, and Industry Risks

Request Free Sample

Research Analyst Overview

  • The golf apparel market is defined by the sophisticated integration of advanced fabric technologies and lifestyle aesthetics. The emphasis is on performance-driven design, where high-performance materials such as moisture-wicking fabric and four-way stretch material are standard. Innovation in engineered textiles, including recycled polyester and pilling-resistant knit, is a key competitive differentiator.
  • Garments increasingly feature breathable textiles with thermal regulation technology and antimicrobial treatment for enhanced comfort. The push for all-weather functionality has popularized weather-protective clothing with a durable water repellent (DWR) finish and windproof membranes. Brands utilizing smart fabric integration are seeing early adopter engagement increase by over 20%.
  • This focus on technical superiority, from lightweight construction and seamless construction to ergonomic seam placement and UV-resistant dyes, is critical for boardroom strategy, influencing both product development budgets and sustainability compliance related to sustainable materials and bio-based fabrics. The market thrives on this blend of technical sportswear and fashion.

What are the Key Data Covered in this Golf Apparel Market Research and Growth Report?

  • What is the expected growth of the Golf Apparel Market between 2026 and 2030?

    • USD 2.14 billion, at a CAGR of 6.9%

  • What segmentation does the market report cover?

    • The report is segmented by End-user (Men, Women, and Children), Distribution Channel (Offline, and Online), Type (Top wear, Bottom wear, and Accessories) and Geography (North America, Europe, APAC, South America, Middle East and Africa)

  • Which regions are analyzed in the report?

    • North America, Europe, APAC, South America and Middle East and Africa

  • What are the key growth drivers and market challenges?

    • Expanding participation and demographic diversification in golf, Intense market competition and price sensitivity

  • Who are the major players in the Golf Apparel Market?

    • Adidas AG, EPNY Golf, G FORE, Galvin Green AB, Greyson Clothiers, Holderness and Bourne LLC, J.Lindeberg AB, Johnnie O Inc, LK International AG, lululemon athletica Inc., Nike Inc., PING Inc., PUMA SE, Ralph Lauren Corp., Rhone Apparel Inc, Sunice Sports, Swing Control, Taylor Made Golf Co. Inc., Topgolf Callaway Brands Corp. and Under Armour Inc.

Market Research Insights

  • The market's dynamism is driven by a focus on course-to-clubhouse versatility, where apparel meets both athletic and social needs. The adoption of a direct-to-consumer business model has improved brand profit margins by an average of 15% by eliminating intermediary costs.
  • Brands leveraging an endorsement marketing strategy and influencer marketing collaboration see a greater than 20% uplift in engagement with younger demographics. A shift towards inclusive sizing development has also expanded the addressable market. Furthermore, premium quality construction and fashion-forward designs are central to maintaining competitive differentiation in a crowded field, where product appeal is tied to both performance and aesthetics.

We can help! Our analysts can customize this golf apparel market research report to meet your requirements.

Get in touch

1. Executive Summary

1.1 Market overview

Executive Summary - Chart on Market Overview
Executive Summary - Data Table on Market Overview
Executive Summary - Chart on Global Market Characteristics
Executive Summary - Chart on Market by Geography
Executive Summary - Chart on Market Segmentation by End-user
Executive Summary - Chart on Market Segmentation by Distribution Channel
Executive Summary - Chart on Market Segmentation by Type
Executive Summary - Chart on Incremental Growth
Executive Summary - Data Table on Incremental Growth
Executive Summary - Chart on Company Market Positioning

2. Technavio Analysis

2.1 Analysis of price sensitivity, lifecycle, customer purchase basket, adoption rates, and purchase criteria

2.2 Criticality of inputs and Factors of differentiation

Chart on Overview on criticality of inputs and factors of differentiation

2.3 Factors of disruption

Chart on Overview on factors of disruption

2.4 Impact of drivers and challenges

Chart on Impact of drivers and challenges in 2025 and 2030

3. Market Landscape

3.1 Market ecosystem

Chart on Parent Market
Data Table on - Parent Market

3.2 Market characteristics

Chart on Market characteristics analysis

3.3 Value chain analysis

Chart on Value chain analysis

4. Market Sizing

4.1 Market definition

Data Table on Offerings of companies included in the market definition

4.2 Market segment analysis

Market segments

4.3 Market size 2025

4.4 Market outlook: Forecast for 2025-2030

Chart on Global - Market size and forecast 2025-2030 ($ million)
Data Table on Global - Market size and forecast 2025-2030 ($ million)
Chart on Global Market: Year-over-year growth 2025-2030 (%)
Data Table on Global Market: Year-over-year growth 2025-2030 (%)

5. Historic Market Size

5.1 Global Golf Apparel Market 2020 - 2024

Historic Market Size - Data Table on Global Golf Apparel Market 2020 - 2024 ($ million)

5.2 End-user segment analysis 2020 - 2024

Historic Market Size - End-user Segment 2020 - 2024 ($ million)

5.3 Distribution Channel segment analysis 2020 - 2024

Historic Market Size - Distribution Channel Segment 2020 - 2024 ($ million)

5.4 Type segment analysis 2020 - 2024

Historic Market Size - Type Segment 2020 - 2024 ($ million)

5.5 Geography segment analysis 2020 - 2024

Historic Market Size - Geography Segment 2020 - 2024 ($ million)

5.6 Country segment analysis 2020 - 2024

Historic Market Size - Country Segment 2020 - 2024 ($ million)

6. Qualitative Analysis

6.1 Impact of AI on global golf apparel market

6.2 Impact of geopolitical conflicts on global golf apparel market

7. Five Forces Analysis

7.1 Five forces summary

Five forces analysis - Comparison between 2025 and 2030

7.2 Bargaining power of buyers

Bargaining power of buyers - Impact of key factors 2025 and 2030

7.3 Bargaining power of suppliers

Bargaining power of suppliers - Impact of key factors in 2025 and 2030

7.4 Threat of new entrants

Threat of new entrants - Impact of key factors in 2025 and 2030

7.5 Threat of substitutes

Threat of substitutes - Impact of key factors in 2025 and 2030

7.6 Threat of rivalry

Threat of rivalry - Impact of key factors in 2025 and 2030

7.7 Market condition

Chart on Market condition - Five forces 2025 and 2030

8. Market Segmentation by End-user

8.1 Market segments

Chart on End-user - Market share 2025-2030 (%)
Data Table on End-user - Market share 2025-2030 (%)

8.2 Comparison by End-user

Chart on Comparison by End-user
Data Table on Comparison by End-user

8.3 Men - Market size and forecast 2025-2030

Chart on Men - Market size and forecast 2025-2030 ($ million)
Data Table on Men - Market size and forecast 2025-2030 ($ million)
Chart on Men - Year-over-year growth 2025-2030 (%)
Data Table on Men - Year-over-year growth 2025-2030 (%)

8.4 Women - Market size and forecast 2025-2030

Chart on Women - Market size and forecast 2025-2030 ($ million)
Data Table on Women - Market size and forecast 2025-2030 ($ million)
Chart on Women - Year-over-year growth 2025-2030 (%)
Data Table on Women - Year-over-year growth 2025-2030 (%)

8.5 Children - Market size and forecast 2025-2030

Chart on Children - Market size and forecast 2025-2030 ($ million)
Data Table on Children - Market size and forecast 2025-2030 ($ million)
Chart on Children - Year-over-year growth 2025-2030 (%)
Data Table on Children - Year-over-year growth 2025-2030 (%)

8.6 Market opportunity by End-user

Market opportunity by End-user ($ million)
Data Table on Market opportunity by End-user ($ million)

9. Market Segmentation by Distribution Channel

9.1 Market segments

Chart on Distribution Channel - Market share 2025-2030 (%)
Data Table on Distribution Channel - Market share 2025-2030 (%)

9.2 Comparison by Distribution Channel

Chart on Comparison by Distribution Channel
Data Table on Comparison by Distribution Channel

9.3 Offline - Market size and forecast 2025-2030

Chart on Offline - Market size and forecast 2025-2030 ($ million)
Data Table on Offline - Market size and forecast 2025-2030 ($ million)
Chart on Offline - Year-over-year growth 2025-2030 (%)
Data Table on Offline - Year-over-year growth 2025-2030 (%)

9.4 Online - Market size and forecast 2025-2030

Chart on Online - Market size and forecast 2025-2030 ($ million)
Data Table on Online - Market size and forecast 2025-2030 ($ million)
Chart on Online - Year-over-year growth 2025-2030 (%)
Data Table on Online - Year-over-year growth 2025-2030 (%)

9.5 Market opportunity by Distribution Channel

Market opportunity by Distribution Channel ($ million)
Data Table on Market opportunity by Distribution Channel ($ million)

10. Market Segmentation by Type

10.1 Market segments

Chart on Type - Market share 2025-2030 (%)
Data Table on Type - Market share 2025-2030 (%)

10.2 Comparison by Type

Chart on Comparison by Type
Data Table on Comparison by Type

10.3 Top wear - Market size and forecast 2025-2030

Chart on Top wear - Market size and forecast 2025-2030 ($ million)
Data Table on Top wear - Market size and forecast 2025-2030 ($ million)
Chart on Top wear - Year-over-year growth 2025-2030 (%)
Data Table on Top wear - Year-over-year growth 2025-2030 (%)

10.4 Bottom wear - Market size and forecast 2025-2030

Chart on Bottom wear - Market size and forecast 2025-2030 ($ million)
Data Table on Bottom wear - Market size and forecast 2025-2030 ($ million)
Chart on Bottom wear - Year-over-year growth 2025-2030 (%)
Data Table on Bottom wear - Year-over-year growth 2025-2030 (%)

10.5 Accessories - Market size and forecast 2025-2030

Chart on Accessories - Market size and forecast 2025-2030 ($ million)
Data Table on Accessories - Market size and forecast 2025-2030 ($ million)
Chart on Accessories - Year-over-year growth 2025-2030 (%)
Data Table on Accessories - Year-over-year growth 2025-2030 (%)

10.6 Market opportunity by Type

Market opportunity by Type ($ million)
Data Table on Market opportunity by Type ($ million)

11. Customer Landscape

11.1 Customer landscape overview

Analysis of price sensitivity, lifecycle, customer purchase basket, adoption rates, and purchase criteria

12. Geographic Landscape

12.1 Geographic segmentation

Chart on Market share by geography 2025-2030 (%)
Data Table on Market share by geography 2025-2030 (%)

12.2 Geographic comparison

Chart on Geographic comparison
Data Table on Geographic comparison

12.3 North America - Market size and forecast 2025-2030

Chart on North America - Market size and forecast 2025-2030 ($ million)
Data Table on North America - Market size and forecast 2025-2030 ($ million)
Chart on North America - Year-over-year growth 2025-2030 (%)
Data Table on North America - Year-over-year growth 2025-2030 (%)
Chart on Regional Comparison - North America
Data Table on Regional Comparison - North America

12.3.1 US - Market size and forecast 2025-2030

Chart on US - Market size and forecast 2025-2030 ($ million)
Data Table on US - Market size and forecast 2025-2030 ($ million)
Chart on US - Year-over-year growth 2025-2030 (%)
Data Table on US - Year-over-year growth 2025-2030 (%)

12.3.2 Canada - Market size and forecast 2025-2030

Chart on Canada - Market size and forecast 2025-2030 ($ million)
Data Table on Canada - Market size and forecast 2025-2030 ($ million)
Chart on Canada - Year-over-year growth 2025-2030 (%)
Data Table on Canada - Year-over-year growth 2025-2030 (%)

12.3.3 Mexico - Market size and forecast 2025-2030

Chart on Mexico - Market size and forecast 2025-2030 ($ million)
Data Table on Mexico - Market size and forecast 2025-2030 ($ million)
Chart on Mexico - Year-over-year growth 2025-2030 (%)
Data Table on Mexico - Year-over-year growth 2025-2030 (%)

12.4 Europe - Market size and forecast 2025-2030

Chart on Europe - Market size and forecast 2025-2030 ($ million)
Data Table on Europe - Market size and forecast 2025-2030 ($ million)
Chart on Europe - Year-over-year growth 2025-2030 (%)
Data Table on Europe - Year-over-year growth 2025-2030 (%)
Chart on Regional Comparison - Europe
Data Table on Regional Comparison - Europe

12.4.1 UK - Market size and forecast 2025-2030

Chart on UK - Market size and forecast 2025-2030 ($ million)
Data Table on UK - Market size and forecast 2025-2030 ($ million)
Chart on UK - Year-over-year growth 2025-2030 (%)
Data Table on UK - Year-over-year growth 2025-2030 (%)

12.4.2 Germany - Market size and forecast 2025-2030

Chart on Germany - Market size and forecast 2025-2030 ($ million)
Data Table on Germany - Market size and forecast 2025-2030 ($ million)
Chart on Germany - Year-over-year growth 2025-2030 (%)
Data Table on Germany - Year-over-year growth 2025-2030 (%)

12.4.3 France - Market size and forecast 2025-2030

Chart on France - Market size and forecast 2025-2030 ($ million)
Data Table on France - Market size and forecast 2025-2030 ($ million)
Chart on France - Year-over-year growth 2025-2030 (%)
Data Table on France - Year-over-year growth 2025-2030 (%)

12.4.4 Sweden - Market size and forecast 2025-2030

Chart on Sweden - Market size and forecast 2025-2030 ($ million)
Data Table on Sweden - Market size and forecast 2025-2030 ($ million)
Chart on Sweden - Year-over-year growth 2025-2030 (%)
Data Table on Sweden - Year-over-year growth 2025-2030 (%)

12.4.5 Spain - Market size and forecast 2025-2030

Chart on Spain - Market size and forecast 2025-2030 ($ million)
Data Table on Spain - Market size and forecast 2025-2030 ($ million)
Chart on Spain - Year-over-year growth 2025-2030 (%)
Data Table on Spain - Year-over-year growth 2025-2030 (%)

12.4.6 Italy - Market size and forecast 2025-2030

Chart on Italy - Market size and forecast 2025-2030 ($ million)
Data Table on Italy - Market size and forecast 2025-2030 ($ million)
Chart on Italy - Year-over-year growth 2025-2030 (%)
Data Table on Italy - Year-over-year growth 2025-2030 (%)

12.5 APAC - Market size and forecast 2025-2030

Chart on APAC - Market size and forecast 2025-2030 ($ million)
Data Table on APAC - Market size and forecast 2025-2030 ($ million)
Chart on APAC - Year-over-year growth 2025-2030 (%)
Data Table on APAC - Year-over-year growth 2025-2030 (%)
Chart on Regional Comparison - APAC
Data Table on Regional Comparison - APAC

12.5.1 Japan - Market size and forecast 2025-2030

Chart on Japan - Market size and forecast 2025-2030 ($ million)
Data Table on Japan - Market size and forecast 2025-2030 ($ million)
Chart on Japan - Year-over-year growth 2025-2030 (%)
Data Table on Japan - Year-over-year growth 2025-2030 (%)

12.5.2 South Korea - Market size and forecast 2025-2030

Chart on South Korea - Market size and forecast 2025-2030 ($ million)
Data Table on South Korea - Market size and forecast 2025-2030 ($ million)
Chart on South Korea - Year-over-year growth 2025-2030 (%)
Data Table on South Korea - Year-over-year growth 2025-2030 (%)

12.5.3 China - Market size and forecast 2025-2030

Chart on China - Market size and forecast 2025-2030 ($ million)
Data Table on China - Market size and forecast 2025-2030 ($ million)
Chart on China - Year-over-year growth 2025-2030 (%)
Data Table on China - Year-over-year growth 2025-2030 (%)

12.5.4 Australia - Market size and forecast 2025-2030

Chart on Australia - Market size and forecast 2025-2030 ($ million)
Data Table on Australia - Market size and forecast 2025-2030 ($ million)
Chart on Australia - Year-over-year growth 2025-2030 (%)
Data Table on Australia - Year-over-year growth 2025-2030 (%)

12.5.5 India - Market size and forecast 2025-2030

Chart on India - Market size and forecast 2025-2030 ($ million)
Data Table on India - Market size and forecast 2025-2030 ($ million)
Chart on India - Year-over-year growth 2025-2030 (%)
Data Table on India - Year-over-year growth 2025-2030 (%)

12.5.6 Indonesia - Market size and forecast 2025-2030

Chart on Indonesia - Market size and forecast 2025-2030 ($ million)
Data Table on Indonesia - Market size and forecast 2025-2030 ($ million)
Chart on Indonesia - Year-over-year growth 2025-2030 (%)
Data Table on Indonesia - Year-over-year growth 2025-2030 (%)

12.6 South America - Market size and forecast 2025-2030

Chart on South America - Market size and forecast 2025-2030 ($ million)
Data Table on South America - Market size and forecast 2025-2030 ($ million)
Chart on South America - Year-over-year growth 2025-2030 (%)
Data Table on South America - Year-over-year growth 2025-2030 (%)
Chart on Regional Comparison - South America
Data Table on Regional Comparison - South America

12.6.1 Brazil - Market size and forecast 2025-2030

Chart on Brazil - Market size and forecast 2025-2030 ($ million)
Data Table on Brazil - Market size and forecast 2025-2030 ($ million)
Chart on Brazil - Year-over-year growth 2025-2030 (%)
Data Table on Brazil - Year-over-year growth 2025-2030 (%)

12.6.2 Argentina - Market size and forecast 2025-2030

Chart on Argentina - Market size and forecast 2025-2030 ($ million)
Data Table on Argentina - Market size and forecast 2025-2030 ($ million)
Chart on Argentina - Year-over-year growth 2025-2030 (%)
Data Table on Argentina - Year-over-year growth 2025-2030 (%)

12.6.3 Chile - Market size and forecast 2025-2030

Chart on Chile - Market size and forecast 2025-2030 ($ million)
Data Table on Chile - Market size and forecast 2025-2030 ($ million)
Chart on Chile - Year-over-year growth 2025-2030 (%)
Data Table on Chile - Year-over-year growth 2025-2030 (%)

12.7 Middle East and Africa - Market size and forecast 2025-2030

Chart on Middle East and Africa - Market size and forecast 2025-2030 ($ million)
Data Table on Middle East and Africa - Market size and forecast 2025-2030 ($ million)
Chart on Middle East and Africa - Year-over-year growth 2025-2030 (%)
Data Table on Middle East and Africa - Year-over-year growth 2025-2030 (%)
Chart on Regional Comparison - Middle East and Africa
Data Table on Regional Comparison - Middle East and Africa

12.7.1 Saudi Arabia - Market size and forecast 2025-2030

Chart on Saudi Arabia - Market size and forecast 2025-2030 ($ million)
Data Table on Saudi Arabia - Market size and forecast 2025-2030 ($ million)
Chart on Saudi Arabia - Year-over-year growth 2025-2030 (%)
Data Table on Saudi Arabia - Year-over-year growth 2025-2030 (%)

12.7.2 UAE - Market size and forecast 2025-2030

Chart on UAE - Market size and forecast 2025-2030 ($ million)
Data Table on UAE - Market size and forecast 2025-2030 ($ million)
Chart on UAE - Year-over-year growth 2025-2030 (%)
Data Table on UAE - Year-over-year growth 2025-2030 (%)

12.7.3 South Africa - Market size and forecast 2025-2030

Chart on South Africa - Market size and forecast 2025-2030 ($ million)
Data Table on South Africa - Market size and forecast 2025-2030 ($ million)
Chart on South Africa - Year-over-year growth 2025-2030 (%)
Data Table on South Africa - Year-over-year growth 2025-2030 (%)

12.7.4 Israel - Market size and forecast 2025-2030

Chart on Israel - Market size and forecast 2025-2030 ($ million)
Data Table on Israel - Market size and forecast 2025-2030 ($ million)
Chart on Israel - Year-over-year growth 2025-2030 (%)
Data Table on Israel - Year-over-year growth 2025-2030 (%)

12.7.5 Turkey - Market size and forecast 2025-2030

Chart on Turkey - Market size and forecast 2025-2030 ($ million)
Data Table on Turkey - Market size and forecast 2025-2030 ($ million)
Chart on Turkey - Year-over-year growth 2025-2030 (%)
Data Table on Turkey - Year-over-year growth 2025-2030 (%)

12.8 Market opportunity by geography

Market opportunity by geography ($ million)
Data Tables on Market opportunity by geography ($ million)

13. Drivers, Challenges, and Opportunity

13.1 Market drivers

Expanding participation and demographic diversification in golf
Enhanced promotional and marketing strategies
Integration of fashion-forward designs and high-performance materials

13.2 Market challenges

Intense market competition and price sensitivity
Inherent seasonality and dependence on climatic conditions
Navigating rapidly evolving consumer preferences and supply chain complexities

13.3 Impact of drivers and challenges

Impact of drivers and challenges in 2025 and 2030

13.4 Market opportunities

Convergence of performance and lifestyle apparel
Ascendancy of sustainable and ethical production
Pervasive integration of fabric technology and innovation

14. Competitive Landscape

14.1 Overview

14.2

Overview on criticality of inputs and factors of differentiation

14.3 Landscape disruption

Overview on factors of disruption

14.4 Industry risks

Impact of key risks on business

15. Competitive Analysis

15.1 Companies profiled

Companies covered

15.2 Company ranking index

15.3 Market positioning of companies

Matrix on companies position and classification

15.4 Adidas AG

Adidas AG - Overview
Adidas AG - Business segments
Adidas AG - Key offerings
Adidas AG - Segment focus
SWOT

15.5 EPNY Golf

EPNY Golf - Overview
EPNY Golf - Product / Service
EPNY Golf - Key offerings
SWOT

15.6 Greyson Clothiers

Greyson Clothiers - Overview
Greyson Clothiers - Product / Service
Greyson Clothiers - Key offerings
SWOT

15.7 Holderness and Bourne LLC

Holderness and Bourne LLC - Overview
Holderness and Bourne LLC - Product / Service
Holderness and Bourne LLC - Key offerings
SWOT

15.8 LK International AG

LK International AG - Overview
LK International AG - Product / Service
LK International AG - Key offerings
SWOT

15.9 lululemon athletica Inc.

lululemon athletica Inc. - Overview
lululemon athletica Inc. - Business segments
lululemon athletica Inc. - Key offerings
lululemon athletica Inc. - Segment focus
SWOT

15.10 Nike Inc.

Nike Inc. - Overview
Nike Inc. - Business segments
Nike Inc. - Key offerings
Nike Inc. - Segment focus
SWOT

15.11 PING Inc.

PING Inc. - Overview
PING Inc. - Product / Service
PING Inc. - Key offerings
SWOT

15.12 PUMA SE

PUMA SE - Overview
PUMA SE - Business segments
PUMA SE - Key news
PUMA SE - Key offerings
PUMA SE - Segment focus
SWOT

15.13 Ralph Lauren Corp.

Ralph Lauren Corp. - Overview
Ralph Lauren Corp. - Business segments
Ralph Lauren Corp. - Key news
Ralph Lauren Corp. - Key offerings
Ralph Lauren Corp. - Segment focus
SWOT

15.14 Rhone Apparel Inc

Rhone Apparel Inc - Overview
Rhone Apparel Inc - Product / Service
Rhone Apparel Inc - Key offerings
SWOT

15.15 Swing Control

Swing Control - Overview
Swing Control - Product / Service
Swing Control - Key offerings
SWOT

15.16 Taylor Made Golf Co. Inc.

Taylor Made Golf Co. Inc. - Overview
Taylor Made Golf Co. Inc. - Product / Service
Taylor Made Golf Co. Inc. - Key offerings
SWOT

15.17 Topgolf Callaway Brands Corp.

Topgolf Callaway Brands Corp. - Overview
Topgolf Callaway Brands Corp. - Business segments
Topgolf Callaway Brands Corp. - Key offerings
Topgolf Callaway Brands Corp. - Segment focus
SWOT

15.18 Under Armour Inc.

Under Armour Inc. - Overview
Under Armour Inc. - Business segments
Under Armour Inc. - Key offerings
Under Armour Inc. - Segment focus
SWOT

16. Appendix

16.1 Scope of the report

Market definition
Objectives
Notes and caveats

16.2 Inclusions and exclusions checklist

Inclusions checklist
Exclusions checklist

16.3 Currency conversion rates for US$

16.4 Research methodology

16.5 Data procurement

Information sources

16.6 Data validation

16.7 Validation techniques employed for market sizing

16.8 Data synthesis

16.9 360 degree market analysis

16.10 List of abbreviations

Research Methodology

Technavio presents a detailed picture of the market by way of study, synthesis, and summation of data from multiple sources. The analysts have presented the various facets of the market with a particular focus on identifying the key industry influencers. The data thus presented is comprehensive, reliable, and the result of extensive research, both primary and secondary.

INFORMATION SOURCES

Primary sources

  • Manufacturers and suppliers
  • Channel partners
  • Industry experts
  • Strategic decision makers

Secondary sources

  • Industry journals and periodicals
  • Government data
  • Financial reports of key industry players
  • Historical data
  • Press releases

DATA ANALYSIS

Data Synthesis

  • Collation of data
  • Estimation of key figures
  • Analysis of derived insights

Data Validation

  • Triangulation with data models
  • Reference against proprietary databases
  • Corroboration with industry experts

REPORT WRITING

Qualitative

  • Market drivers
  • Market challenges
  • Market trends
  • Five forces analysis

Quantitative

  • Market size and forecast
  • Market segmentation
  • Geographical insights
  • Competitive landscape

Interested in this report?

Get your sample now to see our research methodology and insights!

Download Now

Frequently Asked Questions

Golf Apparel market growth will increase by USD 2136.6 million during 2026-2030.

The Golf Apparel market is expected to grow at a CAGR of 6.9% during 2026-2030.

Golf Apparel market is segmented by End-user (Men, Women, Children) Distribution channel (Offline, Online) Type (Top wear, Bottom wear, Accessories)

Adidas AG, EPNY Golf, G FORE, Galvin Green AB, Greyson Clothiers, Holderness and Bourne LLC, J.Lindeberg AB, Johnnie O Inc, LK International AG, lululemon athletica Inc., Nike Inc., PING Inc., PUMA SE, Ralph Lauren Corp., Rhone Apparel Inc, Sunice Sports, Swing Control, Taylor Made Golf Co. Inc., Topgolf Callaway Brands Corp., Under Armour Inc. are a few of the key vendors in the Golf Apparel market.

North America will register the highest growth rate of 38.8% among the other regions. Therefore, the Golf Apparel market in North America is expected to garner significant business opportunities for the vendors during the forecast period.

US, Canada, Mexico, UK, Germany, France, Sweden, Spain, Italy, Japan, South Korea, China, Australia, India, Indonesia, Brazil, Argentina, Chile, Saudi Arabia, UAE, South Africa, Israel, Turkey

  • Expanding participation and demographic diversification in golf is the driving factor this market.

The Golf Apparel market vendors should focus on grabbing business opportunities from the End-user segment as it accounted for the largest market share in the base year.
RIA - Research AI Assistant
Ask RIA