Cotton Market Analysis, Size, and Forecast 2026-2030: APAC (China, Japan, and India), Middle East and Africa (Turkey, South Africa, and UAE), North America (US, Canada, and Mexico), South America (Brazil, Argentina, and Colombia), Europe (Germany, UK, and France), and Rest of World (ROW)

Cotton Market Analysis, Size, and Forecast 2026-2030:
APAC (China, Japan, and India), Middle East and Africa (Turkey, South Africa, and UAE), North America (US, Canada, and Mexico), South America (Brazil, Argentina, and Colombia), Europe (Germany, UK, and France), and Rest of World (ROW)

Published: Mar 2026 289 Pages SKU: IRTNTR70357

Market Overview at a Glance

$9.60 B
Market Opportunity
3.4%
CAGR 2025 - 2030
74.9%
APAC Growth
$40.53 B
Cotton fiber segment 2024

Cotton Market Size 2026-2030

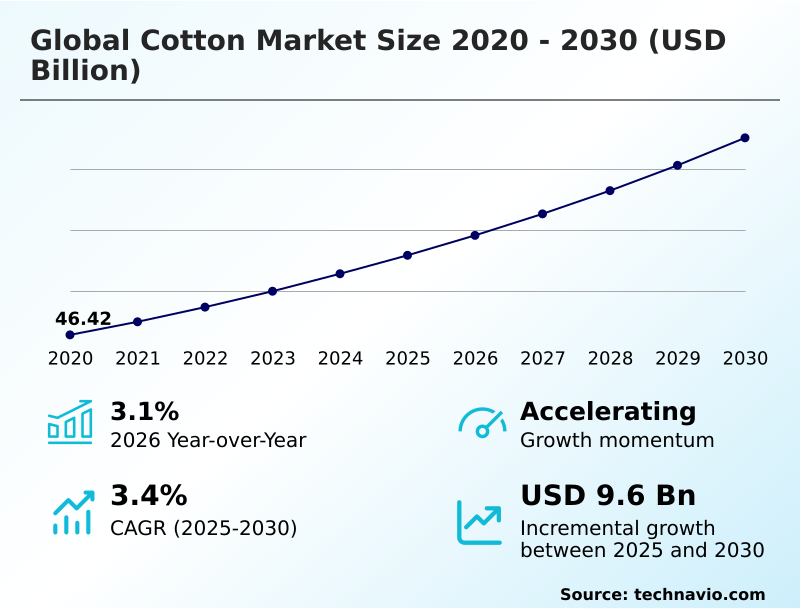
The cotton market size is valued to increase by USD 9.60 billion, at a CAGR of 3.4% from 2025 to 2030. Expanding entrepreneurship culture encouraging low risk business ownership models will drive the cotton market.

Major Market Trends & Insights

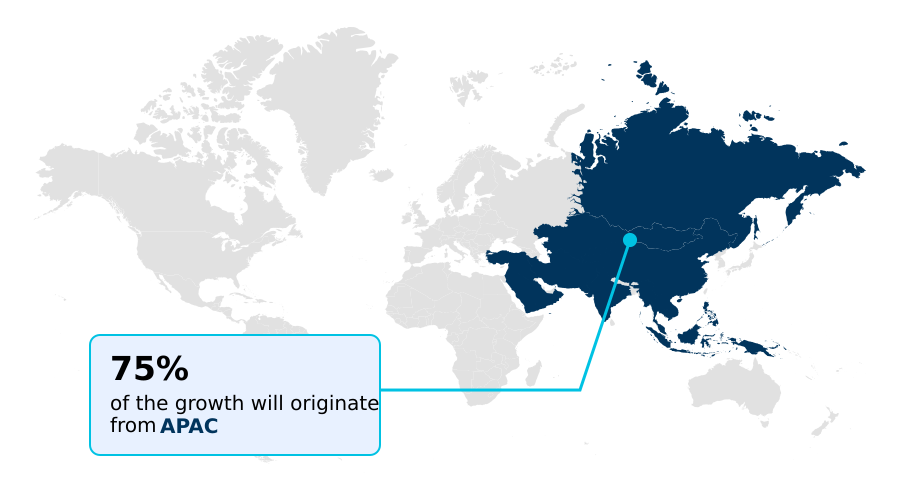
  • APAC dominated the market and accounted for a 74.9% growth during the forecast period.
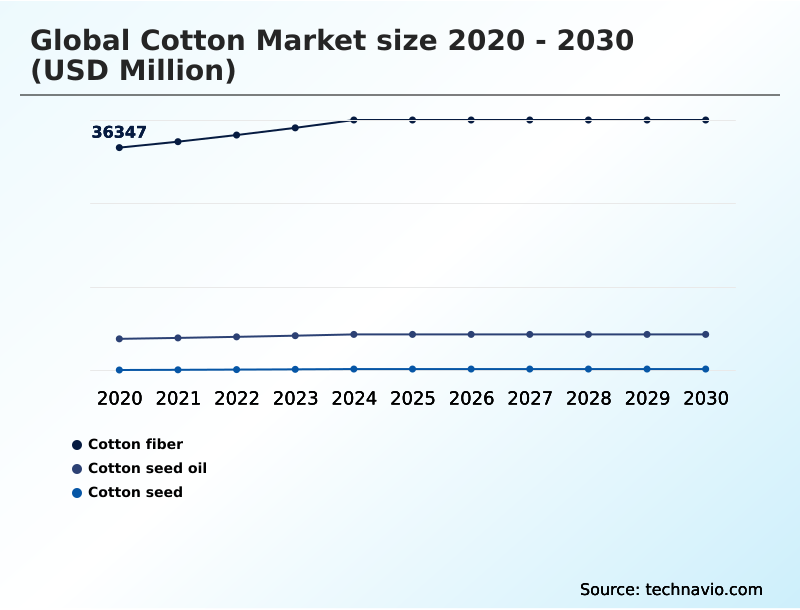
  • By Application - Cotton fiber segment was valued at USD 40.53 billion in 2024
  • By Distribution Channel - Offline segment accounted for the largest market revenue share in 2024

Market Size & Forecast

  • Market Opportunities: USD 16.12 billion
  • Market Future Opportunities: USD 9.60 billion
  • CAGR from 2025 to 2030 : 3.4%

Market Summary

  • The cotton market remains a vital pillar of the global agricultural and textile economy, driven by perpetual consumer demand for natural fibers. Core industry trends revolve around the pivotal shift toward sustainability, with a significant emphasis on regenerative agriculture, water conservation, and the adoption of organic cotton.
  • Concurrently, technological advancement is reshaping production through precision agriculture, genetically modified seeds, and digital quality monitoring, which enhance yield and fiber consistency. However, the sector grapples with challenges such as high capital investment for mechanical harvesting and complex regulatory compliance for supply chain transparency.
  • For example, a textile manufacturer navigating new import regulations might leverage a blockchain-based trading platform to provide immutable proof of origin for its pima cotton, ensuring compliance and meeting consumer demands for traceable, ethically sourced goods. This strategic integration of technology and sustainable practices is critical for maintaining competitiveness and navigating the evolving demands of the global cotton market 2026-2030.

What will be the Size of the Cotton Market during the forecast period?

Get Key Insights on Market Forecast (PDF) Request Free Sample

How is the Cotton Market Segmented?

The cotton industry research report provides comprehensive data (region-wise segment analysis), with forecasts and estimates in "USD million" for the period 2026-2030, as well as historical data from 2020-2024 for the following segments.

  • Application
    • Cotton fiber
    • Cotton seed oil
    • Cotton seed
  • Distribution channel
    • Offline
    • Online
  • Type
    • Medium staple
    • Long staple
    • Short staple
  • Geography
    • APAC
      • China
      • Japan
      • India
    • Middle East and Africa
      • Turkey
      • South Africa
      • UAE
    • North America
      • US
      • Canada
      • Mexico
    • South America
      • Brazil
      • Argentina
      • Colombia
    • Europe
      • Germany
      • UK
      • France
    • Rest of World (ROW)

By Application Insights

The cotton fiber segment is estimated to witness significant growth during the forecast period.

The cotton fiber segment is foundational to the worldwide apparel industry, serving as the essential raw material for textiles.

This market is defined by its versatility, with varying fiber length and yarn counts enabling production of everything from everyday apparel to high-performance industrial fabrics.

A key dynamic is the increasing adoption of high-tech inputs and advanced ginning techniques to improve textile processing and meet rigorous quality specifications.

The shift toward sustainable fiber production is pronounced, with a clear focus on regenerative agriculture and water conservation.

For instance, branded garments made from certified fibers have demonstrated a 25% higher retail velocity, underscoring the commercial value of quality and traceability in modern fiber classification.

Request Free Sample

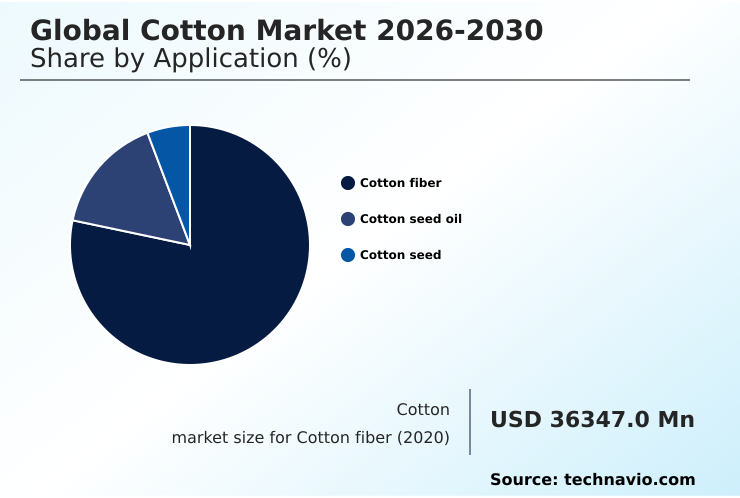
The Cotton fiber segment was valued at USD 40.53 billion in 2024 and showed a gradual increase during the forecast period.

Request Free Sample

Regional Analysis

APAC is estimated to contribute 74.9% to the growth of the global market during the forecast period.Technavio’s analysts have elaborately explained the regional trends and drivers that shape the market during the forecast period.

See How Cotton Market Demand is Rising in APAC Request Free Sample

The geographic landscape is dominated by APAC, which functions as the epicenter for both production and consumption, accounting for over 70% of the market's incremental growth.

This region's large-scale spinning mills are pivotal, processing vast quantities of fiber for global apparel manufacturing. In contrast, North America excels in high-efficiency, export-oriented production, leveraging high-volume instrument classing and precision farming to ensure premium quality.

Europe influences the market through stringent regulations and a focus on the circular economy, driving demand for sustainable cotton sourcing and textile recycling innovation.

The implementation of new EU directives on supply chain traceability has forced exporters to overhaul tracking systems, adding significant operational costs but also creating opportunities for providers of compliant, high-performance fibers and advanced textile solutions.

Market Dynamics

Our researchers analyzed the data with 2025 as the base year, along with the key drivers, trends, and challenges. A holistic analysis of drivers will help companies refine their marketing strategies to gain a competitive advantage.

  • Strategic decision-making in the contemporary cotton market requires a comprehensive analysis of interconnected factors. Evaluating the impact of gmo seeds on cotton yield is a critical first step for procurement teams aiming to secure a consistent supply of raw materials.
  • Simultaneously, businesses are assessing the benefits of precision agriculture in cotton farming, which promises not only enhanced output but also significant cost reductions in water and input usage. Adherence to sustainable cotton production best practices is no longer optional but a core component of corporate ESG strategy, influencing brand perception and market access.
  • To support these initiatives, exploring the role of blockchain in the textile supply chain is essential for ensuring transparency and traceability. Product development strategies often involve comparing long staple vs medium staple cotton to target specific consumer segments, from luxury apparel to mass-market goods.
  • Diversification efforts also extend to byproducts, with many integrated firms examining how is cottonseed oil used in food processing to create additional revenue streams. Companies that successfully adopt sustainable practices have reported up to a 15% reduction in water consumption compared to conventional methods, underscoring the tangible benefits of a modern, data-driven approach to cotton production and management.

What are the key market drivers leading to the rise in the adoption of Cotton Industry?

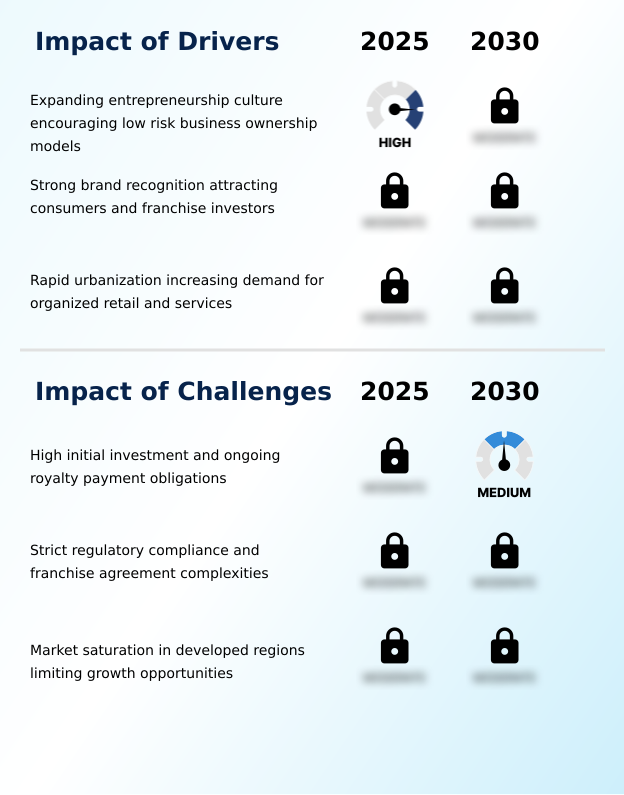
  • An expanding entrepreneurship culture that encourages low-risk business ownership models is a key driver for market growth.

  • Market growth is significantly influenced by strong brand recognition and demographic shifts. Certified labels for high-performance fibers are a powerful driver, as branded garments have demonstrated a 25% higher retail velocity, attracting investment in premium segments like luxury shirting fabrics.
  • This is complemented by rapid urbanization, which has fueled demand in organized retail and expanded consumption of medium-staple lint by 12% in developing regions.
  • The rise of an entrepreneurial culture in agriculture, supported by low-risk business models and off-take agreements, is also broadening the production base. These factors collectively boost demand across the value chain, from raw material trading to finished apparel.

What are the market trends shaping the Cotton Industry?

  • A key trend shaping the market is the rising adoption of digital ordering and delivery integration. This shift is transforming commodity trading through online B2B platforms.

  • Key trends are reshaping the market, driven by digitalization and a strong focus on environmental stewardship. The adoption of digital commodity platforms is accelerating, with new blockchain-based trading portals enabling real-time pricing and improving textile supply chain logistics. This technological shift facilitates greater market access for smaller producers and enhances traceability for buyers.
  • Concurrently, sustainability has become a strategic imperative, as demonstrated by a major industry initiative where leading retailers pledged to source 50% of their cotton from recycled and regenerative sources. This move toward a circular fashion economy and green cotton production is transforming sourcing strategies and fostering innovation in high-quality paper and technical textile applications.

What challenges does the Cotton Industry face during its growth?

  • High initial investments and ongoing royalty payment obligations present a key challenge affecting industry growth.

  • The market faces significant hurdles related to high upfront capital and market saturation. The substantial initial investment required for modern biotechnology and automated processing equipment has led to a consolidation of the ginning sector, making it difficult for smaller operators to compete. This financial strain is compounded by ongoing royalty payments for genetically modified seeds.
  • In developed economies, market saturation has resulted in a stagnation of import volumes for standard-grade apparel. This forces businesses to focus on niche segments like durable cotton linens or innovative fiber blends, as traditional growth paths become limited by intense competition and the rising popularity of the second-hand clothing market.

Exclusive Technavio Analysis on Customer Landscape

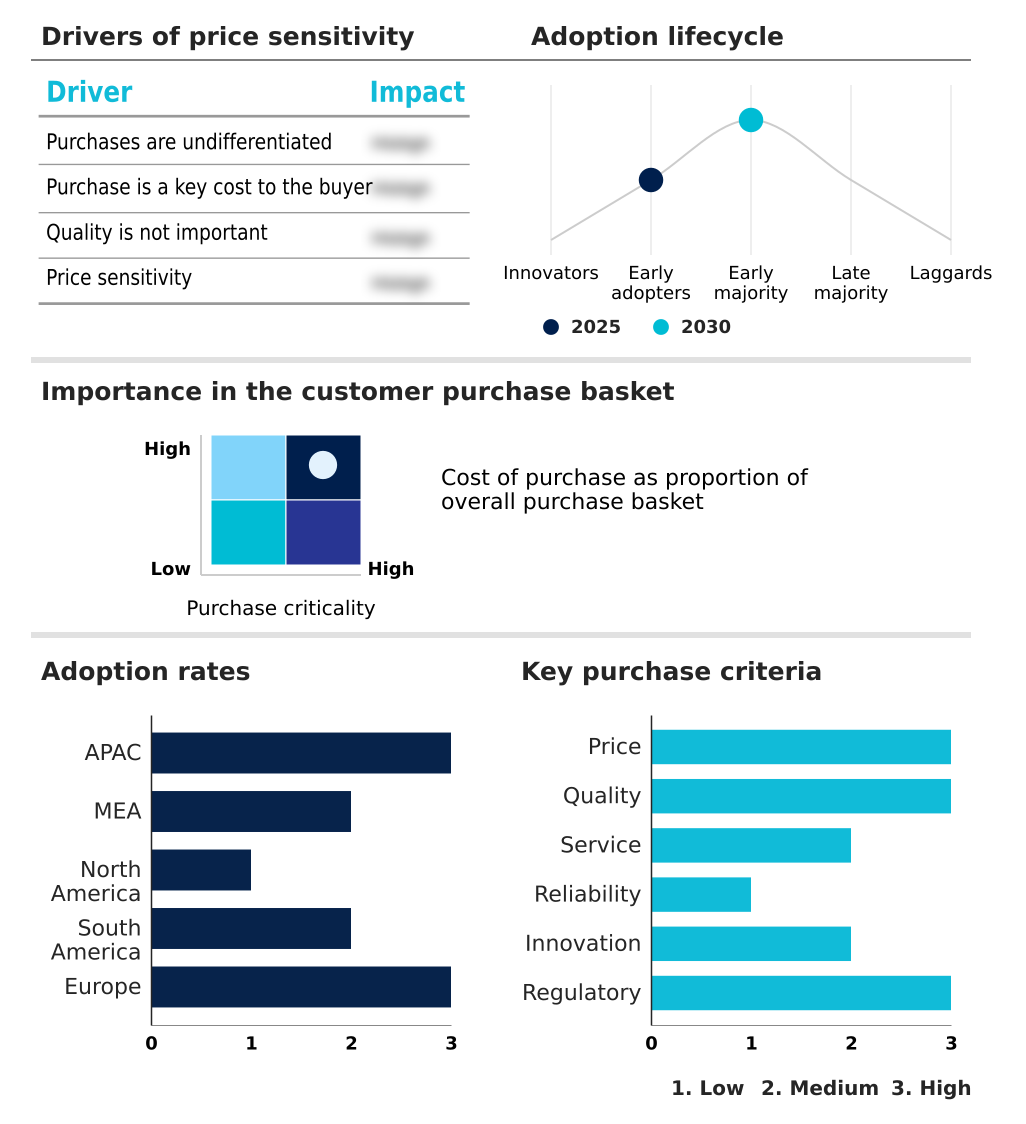
The cotton market forecasting report includes the adoption lifecycle of the market, covering from the innovator’s stage to the laggard’s stage. It focuses on adoption rates in different regions based on penetration. Furthermore, the cotton market report also includes key purchase criteria and drivers of price sensitivity to help companies evaluate and develop their market growth analysis strategies.

Customer Landscape of Cotton Industry

Competitive Landscape

Companies are implementing various strategies, such as strategic alliances, cotton market forecast, partnerships, mergers and acquisitions, geographical expansion, and product/service launches, to enhance their presence in the industry.

Ambika Cotton Mills Ltd. - Operations are centered on producing high-quality compact cotton yarn, which is essential for manufacturing premium shirts and hosiery products.

The industry research and growth report includes detailed analyses of the competitive landscape of the market and information about key companies, including:

  • Ambika Cotton Mills Ltd.
  • Asha Cotton Industries
  • Banswara Syntex Ltd.
  • Bombay Dyeing Co.
  • Carr Textile
  • Damodar Group
  • Hengli Group Co. Ltd.
  • Huafu Fashion Co. Ltd.
  • Loyal Textile Mills Ltd.
  • Lu Thai Textile Co. Ltd.
  • Oswal Group
  • Sintex Industries Ltd.
  • Sutlej Textiles and Industries
  • The Lakshmi Mills Co. Ltd.
  • Trident Ltd.
  • Unifi Inc.
  • Vardhman Textile Ltd.

Qualitative and quantitative analysis of companies has been conducted to help clients understand the wider business environment as well as the strengths and weaknesses of key industry players. Data is qualitatively analyzed to categorize companies as pure play, category-focused, industry-focused, and diversified; it is quantitatively analyzed to categorize companies as dominant, leading, strong, tentative, and weak.

Recent Development and News in Cotton market

  • In May, 2025, the International Cotton Advisory Committee released a strategic framework highlighting how decentralized micro-farming models increased local participation in the global cotton market by 30% in West Africa.
  • In April, 2025, the European Commission issued an updated directive on textile supply chain transparency, introducing stricter reporting requirements for fiber sold within the union, impacting all market participants.
  • In March, 2025, the Cotton India Conference featured the announcement of a blockchain-based trading portal designed to integrate the entire supply chain, from farm to textile mill.
  • In January, 2025, an agricultural finance briefing from Rabobank highlighted that the rising cost of advanced fiber processing technology has led to a consolidation of the ginning sector.

Dive into Technavio’s robust research methodology, blending expert interviews, extensive data synthesis, and validated models for unparalleled Cotton Market insights. See full methodology.

Market Scope
Page number 289
Base year 2025
Historic period 2020-2024
Forecast period 2026-2030
Growth momentum & CAGR Accelerate at a CAGR of 3.4%
Market growth 2026-2030 USD 9603.8 million
Market structure Fragmented
YoY growth 2025-2026(%) 3.1%
Key countries China, Japan, India, Pakistan, South Korea, Australia, Turkey, Egypt, South Africa, UAE, Mali, US, Canada, Mexico, Brazil, Argentina, Colombia, Germany, UK, France, Italy, Spain and The Netherlands
Competitive landscape Leading Companies, Market Positioning of Companies, Competitive Strategies, and Industry Risks

Request Free Sample

Research Analyst Overview

  • The cotton market is navigating a complex transition defined by technological adoption and sustainability mandates. Boardroom-level decisions increasingly center on balancing the high capital expenditure required for mechanical harvesting and advanced ginning with the long-term benefits of enhanced fiber length and consistency.
  • A key trend is the industry-wide move toward traceable supply chains, driven by regulatory pressures and consumer demand for organic cotton and other certified fibers. This shift favors producers who utilize high-volume instrument classing and precision agriculture to deliver verifiable quality.
  • The success of decentralized micro-farming models, which increased local participation by 30% in certain regions, highlights a powerful opportunity to build more resilient and ethical supply networks.
  • As spinning mills and textile manufacturers demand greater transparency, the integration of genetically modified seeds, digital quality monitoring, and sustainable farming practices becomes essential for maintaining a competitive advantage in a market where origin and environmental impact are as critical as price.

What are the Key Data Covered in this Cotton Market Research and Growth Report?

  • What is the expected growth of the Cotton Market between 2026 and 2030?

    • USD 9.60 billion, at a CAGR of 3.4%

  • What segmentation does the market report cover?

    • The report is segmented by Application (Cotton fiber, Cotton seed oil, and Cotton seed), Distribution Channel (Offline, and Online), Type (Medium staple, Long staple, and Short staple) and Geography (APAC, Middle East and Africa, North America, South America, Europe)

  • Which regions are analyzed in the report?

    • APAC, Middle East and Africa, North America, South America and Europe

  • What are the key growth drivers and market challenges?

    • Expanding entrepreneurship culture encouraging low risk business ownership models, High initial investment and ongoing royalty payment obligations

  • Who are the major players in the Cotton Market?

    • Ambika Cotton Mills Ltd., Asha Cotton Industries, Banswara Syntex Ltd., Bombay Dyeing Co., Carr Textile, Damodar Group, Hengli Group Co. Ltd., Huafu Fashion Co. Ltd., Loyal Textile Mills Ltd., Lu Thai Textile Co. Ltd., Oswal Group, Sintex Industries Ltd., Sutlej Textiles and Industries, The Lakshmi Mills Co. Ltd., Trident Ltd., Unifi Inc. and Vardhman Textile Ltd.

Market Research Insights

  • The market's momentum is increasingly influenced by the convergence of consumer-driven branding and agricultural innovation. Strong brand recognition for certified fibers is a key driver, with premium garments showing a 25% higher retail velocity, directly impacting investment returns in specialized long-staple cotton production.
  • This trend is amplified by the expansion of organized retail in urbanizing regions, which has increased medium-staple lint consumption by 12% in key Asian markets. Furthermore, decentralized micro-farming models supported by digital advisory services have successfully boosted local participation in the global supply chain by 30%.
  • These dynamics illustrate a clear shift where sustainable cotton sourcing, facilitated by digital commodity platforms, is becoming integral to securing market share and satisfying demand for everything from luxury shirting fabrics to everyday apparel.

We can help! Our analysts can customize this cotton market research report to meet your requirements.

Get in touch

1. Executive Summary

1.1 Market overview

Executive Summary - Chart on Market Overview
Executive Summary - Data Table on Market Overview
Executive Summary - Chart on Global Market Characteristics
Executive Summary - Chart on Market by Geography
Executive Summary - Chart on Market Segmentation by Application
Executive Summary - Chart on Market Segmentation by Distribution Channel
Executive Summary - Chart on Market Segmentation by Type
Executive Summary - Chart on Incremental Growth
Executive Summary - Data Table on Incremental Growth
Executive Summary - Chart on Company Market Positioning

2. Technavio Analysis

2.1 Analysis of price sensitivity, lifecycle, customer purchase basket, adoption rates, and purchase criteria

2.2 Criticality of inputs and Factors of differentiation

Chart on Overview on criticality of inputs and factors of differentiation

2.3 Factors of disruption

Chart on Overview on factors of disruption

2.4 Impact of drivers and challenges

Chart on Impact of drivers and challenges in 2025 and 2030

3. Market Landscape

3.1 Market ecosystem

Chart on Parent Market
Data Table on - Parent Market

3.2 Market characteristics

Chart on Market characteristics analysis

3.3 Value chain analysis

Chart on Value chain analysis

4. Market Sizing

4.1 Market definition

Data Table on Offerings of companies included in the market definition

4.2 Market segment analysis

Market segments

4.3 Market size 2025

4.4 Market outlook: Forecast for 2025-2030

Chart on Global - Market size and forecast 2025-2030 ($ million)
Data Table on Global - Market size and forecast 2025-2030 ($ million)
Chart on Global Market: Year-over-year growth 2025-2030 (%)
Data Table on Global Market: Year-over-year growth 2025-2030 (%)

5. Historic Market Size

5.1 Global Cotton Market 2020 - 2024

Historic Market Size - Data Table on Global Cotton Market 2020 - 2024 ($ million)

5.2 Application segment analysis 2020 - 2024

Historic Market Size - Application Segment 2020 - 2024 ($ million)

5.3 Distribution Channel segment analysis 2020 - 2024

Historic Market Size - Distribution Channel Segment 2020 - 2024 ($ million)

5.4 Type segment analysis 2020 - 2024

Historic Market Size - Type Segment 2020 - 2024 ($ million)

5.5 Geography segment analysis 2020 - 2024

Historic Market Size - Geography Segment 2020 - 2024 ($ million)

5.6 Country segment analysis 2020 - 2024

Historic Market Size - Country Segment 2020 - 2024 ($ million)

6. Qualitative Analysis

6.1 Impact of AI on Global Cotton Market

7. Five Forces Analysis

7.1 Five forces summary

Five forces analysis - Comparison between 2025 and 2030

7.2 Bargaining power of buyers

Bargaining power of buyers - Impact of key factors 2025 and 2030

7.3 Bargaining power of suppliers

Bargaining power of suppliers - Impact of key factors in 2025 and 2030

7.4 Threat of new entrants

Threat of new entrants - Impact of key factors in 2025 and 2030

7.5 Threat of substitutes

Threat of substitutes - Impact of key factors in 2025 and 2030

7.6 Threat of rivalry

Threat of rivalry - Impact of key factors in 2025 and 2030

7.7 Market condition

Chart on Market condition - Five forces 2025 and 2030

8. Market Segmentation by Application

8.1 Market segments

Chart on Application - Market share 2025-2030 (%)
Data Table on Application - Market share 2025-2030 (%)

8.2 Comparison by Application

Chart on Comparison by Application
Data Table on Comparison by Application

8.3 Cotton fiber - Market size and forecast 2025-2030

Chart on Cotton fiber - Market size and forecast 2025-2030 ($ million)
Data Table on Cotton fiber - Market size and forecast 2025-2030 ($ million)
Chart on Cotton fiber - Year-over-year growth 2025-2030 (%)
Data Table on Cotton fiber - Year-over-year growth 2025-2030 (%)

8.4 Cotton seed oil - Market size and forecast 2025-2030

Chart on Cotton seed oil - Market size and forecast 2025-2030 ($ million)
Data Table on Cotton seed oil - Market size and forecast 2025-2030 ($ million)
Chart on Cotton seed oil - Year-over-year growth 2025-2030 (%)
Data Table on Cotton seed oil - Year-over-year growth 2025-2030 (%)

8.5 Cotton seed - Market size and forecast 2025-2030

Chart on Cotton seed - Market size and forecast 2025-2030 ($ million)
Data Table on Cotton seed - Market size and forecast 2025-2030 ($ million)
Chart on Cotton seed - Year-over-year growth 2025-2030 (%)
Data Table on Cotton seed - Year-over-year growth 2025-2030 (%)

8.6 Market opportunity by Application

Market opportunity by Application ($ million)
Data Table on Market opportunity by Application ($ million)

9. Market Segmentation by Distribution Channel

9.1 Market segments

Chart on Distribution Channel - Market share 2025-2030 (%)
Data Table on Distribution Channel - Market share 2025-2030 (%)

9.2 Comparison by Distribution Channel

Chart on Comparison by Distribution Channel
Data Table on Comparison by Distribution Channel

9.3 Offline - Market size and forecast 2025-2030

Chart on Offline - Market size and forecast 2025-2030 ($ million)
Data Table on Offline - Market size and forecast 2025-2030 ($ million)
Chart on Offline - Year-over-year growth 2025-2030 (%)
Data Table on Offline - Year-over-year growth 2025-2030 (%)

9.4 Online - Market size and forecast 2025-2030

Chart on Online - Market size and forecast 2025-2030 ($ million)
Data Table on Online - Market size and forecast 2025-2030 ($ million)
Chart on Online - Year-over-year growth 2025-2030 (%)
Data Table on Online - Year-over-year growth 2025-2030 (%)

9.5 Market opportunity by Distribution Channel

Market opportunity by Distribution Channel ($ million)
Data Table on Market opportunity by Distribution Channel ($ million)

10. Market Segmentation by Type

10.1 Market segments

Chart on Type - Market share 2025-2030 (%)
Data Table on Type - Market share 2025-2030 (%)

10.2 Comparison by Type

Chart on Comparison by Type
Data Table on Comparison by Type

10.3 Medium staple - Market size and forecast 2025-2030

Chart on Medium staple - Market size and forecast 2025-2030 ($ million)
Data Table on Medium staple - Market size and forecast 2025-2030 ($ million)
Chart on Medium staple - Year-over-year growth 2025-2030 (%)
Data Table on Medium staple - Year-over-year growth 2025-2030 (%)

10.4 Long staple - Market size and forecast 2025-2030

Chart on Long staple - Market size and forecast 2025-2030 ($ million)
Data Table on Long staple - Market size and forecast 2025-2030 ($ million)
Chart on Long staple - Year-over-year growth 2025-2030 (%)
Data Table on Long staple - Year-over-year growth 2025-2030 (%)

10.5 Short staple - Market size and forecast 2025-2030

Chart on Short staple - Market size and forecast 2025-2030 ($ million)
Data Table on Short staple - Market size and forecast 2025-2030 ($ million)
Chart on Short staple - Year-over-year growth 2025-2030 (%)
Data Table on Short staple - Year-over-year growth 2025-2030 (%)

10.6 Market opportunity by Type

Market opportunity by Type ($ million)
Data Table on Market opportunity by Type ($ million)

11. Customer Landscape

11.1 Customer landscape overview

Analysis of price sensitivity, lifecycle, customer purchase basket, adoption rates, and purchase criteria

12. Geographic Landscape

12.1 Geographic segmentation

Chart on Market share by geography 2025-2030 (%)
Data Table on Market share by geography 2025-2030 (%)

12.2 Geographic comparison

Chart on Geographic comparison
Data Table on Geographic comparison

12.3 APAC - Market size and forecast 2025-2030

Chart on APAC - Market size and forecast 2025-2030 ($ million)
Data Table on APAC - Market size and forecast 2025-2030 ($ million)
Chart on APAC - Year-over-year growth 2025-2030 (%)
Data Table on APAC - Year-over-year growth 2025-2030 (%)
Chart on Regional Comparison - APAC
Data Table on Regional Comparison - APAC

12.3.1 China - Market size and forecast 2025-2030

Chart on China - Market size and forecast 2025-2030 ($ million)
Data Table on China - Market size and forecast 2025-2030 ($ million)
Chart on China - Year-over-year growth 2025-2030 (%)
Data Table on China - Year-over-year growth 2025-2030 (%)

12.3.2 Japan - Market size and forecast 2025-2030

Chart on Japan - Market size and forecast 2025-2030 ($ million)
Data Table on Japan - Market size and forecast 2025-2030 ($ million)
Chart on Japan - Year-over-year growth 2025-2030 (%)
Data Table on Japan - Year-over-year growth 2025-2030 (%)

12.3.3 India - Market size and forecast 2025-2030

Chart on India - Market size and forecast 2025-2030 ($ million)
Data Table on India - Market size and forecast 2025-2030 ($ million)
Chart on India - Year-over-year growth 2025-2030 (%)
Data Table on India - Year-over-year growth 2025-2030 (%)

12.3.4 Pakistan - Market size and forecast 2025-2030

Chart on Pakistan - Market size and forecast 2025-2030 ($ million)
Data Table on Pakistan - Market size and forecast 2025-2030 ($ million)
Chart on Pakistan - Year-over-year growth 2025-2030 (%)
Data Table on Pakistan - Year-over-year growth 2025-2030 (%)

12.3.5 South Korea - Market size and forecast 2025-2030

Chart on South Korea - Market size and forecast 2025-2030 ($ million)
Data Table on South Korea - Market size and forecast 2025-2030 ($ million)
Chart on South Korea - Year-over-year growth 2025-2030 (%)
Data Table on South Korea - Year-over-year growth 2025-2030 (%)

12.3.6 Australia - Market size and forecast 2025-2030

Chart on Australia - Market size and forecast 2025-2030 ($ million)
Data Table on Australia - Market size and forecast 2025-2030 ($ million)
Chart on Australia - Year-over-year growth 2025-2030 (%)
Data Table on Australia - Year-over-year growth 2025-2030 (%)

12.4 Middle East and Africa - Market size and forecast 2025-2030

Chart on Middle East and Africa - Market size and forecast 2025-2030 ($ million)
Data Table on Middle East and Africa - Market size and forecast 2025-2030 ($ million)
Chart on Middle East and Africa - Year-over-year growth 2025-2030 (%)
Data Table on Middle East and Africa - Year-over-year growth 2025-2030 (%)
Chart on Regional Comparison - Middle East and Africa
Data Table on Regional Comparison - Middle East and Africa

12.4.1 Turkey - Market size and forecast 2025-2030

Chart on Turkey - Market size and forecast 2025-2030 ($ million)
Data Table on Turkey - Market size and forecast 2025-2030 ($ million)
Chart on Turkey - Year-over-year growth 2025-2030 (%)
Data Table on Turkey - Year-over-year growth 2025-2030 (%)

12.4.2 Egypt - Market size and forecast 2025-2030

Chart on Egypt - Market size and forecast 2025-2030 ($ million)
Data Table on Egypt - Market size and forecast 2025-2030 ($ million)
Chart on Egypt - Year-over-year growth 2025-2030 (%)
Data Table on Egypt - Year-over-year growth 2025-2030 (%)

12.4.3 South Africa - Market size and forecast 2025-2030

Chart on South Africa - Market size and forecast 2025-2030 ($ million)
Data Table on South Africa - Market size and forecast 2025-2030 ($ million)
Chart on South Africa - Year-over-year growth 2025-2030 (%)
Data Table on South Africa - Year-over-year growth 2025-2030 (%)

12.4.4 UAE - Market size and forecast 2025-2030

Chart on UAE - Market size and forecast 2025-2030 ($ million)
Data Table on UAE - Market size and forecast 2025-2030 ($ million)
Chart on UAE - Year-over-year growth 2025-2030 (%)
Data Table on UAE - Year-over-year growth 2025-2030 (%)

12.4.5 Mali - Market size and forecast 2025-2030

Chart on Mali - Market size and forecast 2025-2030 ($ million)
Data Table on Mali - Market size and forecast 2025-2030 ($ million)
Chart on Mali - Year-over-year growth 2025-2030 (%)
Data Table on Mali - Year-over-year growth 2025-2030 (%)

12.5 North America - Market size and forecast 2025-2030

Chart on North America - Market size and forecast 2025-2030 ($ million)
Data Table on North America - Market size and forecast 2025-2030 ($ million)
Chart on North America - Year-over-year growth 2025-2030 (%)
Data Table on North America - Year-over-year growth 2025-2030 (%)
Chart on Regional Comparison - North America
Data Table on Regional Comparison - North America

12.5.1 US - Market size and forecast 2025-2030

Chart on US - Market size and forecast 2025-2030 ($ million)
Data Table on US - Market size and forecast 2025-2030 ($ million)
Chart on US - Year-over-year growth 2025-2030 (%)
Data Table on US - Year-over-year growth 2025-2030 (%)

12.5.2 Canada - Market size and forecast 2025-2030

Chart on Canada - Market size and forecast 2025-2030 ($ million)
Data Table on Canada - Market size and forecast 2025-2030 ($ million)
Chart on Canada - Year-over-year growth 2025-2030 (%)
Data Table on Canada - Year-over-year growth 2025-2030 (%)

12.5.3 Mexico - Market size and forecast 2025-2030

Chart on Mexico - Market size and forecast 2025-2030 ($ million)
Data Table on Mexico - Market size and forecast 2025-2030 ($ million)
Chart on Mexico - Year-over-year growth 2025-2030 (%)
Data Table on Mexico - Year-over-year growth 2025-2030 (%)

12.6 South America - Market size and forecast 2025-2030

Chart on South America - Market size and forecast 2025-2030 ($ million)
Data Table on South America - Market size and forecast 2025-2030 ($ million)
Chart on South America - Year-over-year growth 2025-2030 (%)
Data Table on South America - Year-over-year growth 2025-2030 (%)
Chart on Regional Comparison - South America
Data Table on Regional Comparison - South America

12.6.1 Brazil - Market size and forecast 2025-2030

Chart on Brazil - Market size and forecast 2025-2030 ($ million)
Data Table on Brazil - Market size and forecast 2025-2030 ($ million)
Chart on Brazil - Year-over-year growth 2025-2030 (%)
Data Table on Brazil - Year-over-year growth 2025-2030 (%)

12.6.2 Argentina - Market size and forecast 2025-2030

Chart on Argentina - Market size and forecast 2025-2030 ($ million)
Data Table on Argentina - Market size and forecast 2025-2030 ($ million)
Chart on Argentina - Year-over-year growth 2025-2030 (%)
Data Table on Argentina - Year-over-year growth 2025-2030 (%)

12.6.3 Colombia - Market size and forecast 2025-2030

Chart on Colombia - Market size and forecast 2025-2030 ($ million)
Data Table on Colombia - Market size and forecast 2025-2030 ($ million)
Chart on Colombia - Year-over-year growth 2025-2030 (%)
Data Table on Colombia - Year-over-year growth 2025-2030 (%)

12.7 Europe - Market size and forecast 2025-2030

Chart on Europe - Market size and forecast 2025-2030 ($ million)
Data Table on Europe - Market size and forecast 2025-2030 ($ million)
Chart on Europe - Year-over-year growth 2025-2030 (%)
Data Table on Europe - Year-over-year growth 2025-2030 (%)
Chart on Regional Comparison - Europe
Data Table on Regional Comparison - Europe

12.7.1 Germany - Market size and forecast 2025-2030

Chart on Germany - Market size and forecast 2025-2030 ($ million)
Data Table on Germany - Market size and forecast 2025-2030 ($ million)
Chart on Germany - Year-over-year growth 2025-2030 (%)
Data Table on Germany - Year-over-year growth 2025-2030 (%)

12.7.2 UK - Market size and forecast 2025-2030

Chart on UK - Market size and forecast 2025-2030 ($ million)
Data Table on UK - Market size and forecast 2025-2030 ($ million)
Chart on UK - Year-over-year growth 2025-2030 (%)
Data Table on UK - Year-over-year growth 2025-2030 (%)

12.7.3 France - Market size and forecast 2025-2030

Chart on France - Market size and forecast 2025-2030 ($ million)
Data Table on France - Market size and forecast 2025-2030 ($ million)
Chart on France - Year-over-year growth 2025-2030 (%)
Data Table on France - Year-over-year growth 2025-2030 (%)

12.7.4 Italy - Market size and forecast 2025-2030

Chart on Italy - Market size and forecast 2025-2030 ($ million)
Data Table on Italy - Market size and forecast 2025-2030 ($ million)
Chart on Italy - Year-over-year growth 2025-2030 (%)
Data Table on Italy - Year-over-year growth 2025-2030 (%)

12.7.5 Spain - Market size and forecast 2025-2030

Chart on Spain - Market size and forecast 2025-2030 ($ million)
Data Table on Spain - Market size and forecast 2025-2030 ($ million)
Chart on Spain - Year-over-year growth 2025-2030 (%)
Data Table on Spain - Year-over-year growth 2025-2030 (%)

12.7.6 The Netherlands - Market size and forecast 2025-2030

Chart on The Netherlands - Market size and forecast 2025-2030 ($ million)
Data Table on The Netherlands - Market size and forecast 2025-2030 ($ million)
Chart on The Netherlands - Year-over-year growth 2025-2030 (%)
Data Table on The Netherlands - Year-over-year growth 2025-2030 (%)

12.8 Market opportunity by geography

Market opportunity by geography ($ million)
Data Tables on Market opportunity by geography ($ million)

13. Drivers, Challenges, and Opportunity

13.1 Market drivers

Expanding entrepreneurship culture encouraging low risk business ownership models
Strong brand recognition attracting consumers and franchise investors
Rapid urbanization increasing demand for organized retail and services

13.2 Market challenges

High initial investment and ongoing royalty payment obligations
Strict regulatory compliance and franchise agreement complexities
Market saturation in developed regions limiting growth opportunities

13.3 Impact of drivers and challenges

Impact of drivers and challenges in 2025 and 2030

13.4 Market opportunities

Rising adoption of digital ordering and delivery integration
Growing expansion of franchise models into emerging markets
Increasing focus on sustainable and socially responsible operations

14. Competitive Landscape

14.1 Overview

14.2

Overview on criticality of inputs and factors of differentiation

14.3 Landscape disruption

Overview on factors of disruption

14.4 Industry risks

Impact of key risks on business

15. Competitive Analysis

15.1 Companies profiled

Companies covered

15.2 Company ranking index

15.3 Market positioning of companies

Matrix on companies position and classification

15.4 Ambika Cotton Mills Ltd.

Ambika Cotton Mills Ltd. - Overview
Ambika Cotton Mills Ltd. - Product / Service
Ambika Cotton Mills Ltd. - Key offerings
SWOT

15.5 Asha Cotton Industries

Asha Cotton Industries - Overview
Asha Cotton Industries - Product / Service
Asha Cotton Industries - Key offerings
SWOT

15.6 Banswara Syntex Ltd.

Banswara Syntex Ltd. - Overview
Banswara Syntex Ltd. - Business segments
Banswara Syntex Ltd. - Key offerings
Banswara Syntex Ltd. - Segment focus
SWOT

15.7 Bombay Dyeing Co.

Bombay Dyeing Co. - Overview
Bombay Dyeing Co. - Business segments
Bombay Dyeing Co. - Key offerings
Bombay Dyeing Co. - Segment focus
SWOT

15.8 Carr Textile

Carr Textile - Overview
Carr Textile - Product / Service
Carr Textile - Key offerings
SWOT

15.9 Damodar Group

Damodar Group - Overview
Damodar Group - Product / Service
Damodar Group - Key offerings
SWOT

15.10 Hengli Group Co. Ltd.

Hengli Group Co. Ltd. - Overview
Hengli Group Co. Ltd. - Product / Service
Hengli Group Co. Ltd. - Key offerings
SWOT

15.11 Huafu Fashion Co. Ltd.

Huafu Fashion Co. Ltd. - Overview
Huafu Fashion Co. Ltd. - Business segments
Huafu Fashion Co. Ltd. - Key offerings
Huafu Fashion Co. Ltd. - Segment focus
SWOT

15.12 Loyal Textile Mills Ltd.

Loyal Textile Mills Ltd. - Overview
Loyal Textile Mills Ltd. - Business segments
Loyal Textile Mills Ltd. - Key offerings
Loyal Textile Mills Ltd. - Segment focus
SWOT

15.13 Lu Thai Textile Co. Ltd.

Lu Thai Textile Co. Ltd. - Overview
Lu Thai Textile Co. Ltd. - Business segments
Lu Thai Textile Co. Ltd. - Key offerings
Lu Thai Textile Co. Ltd. - Segment focus
SWOT

15.14 Oswal Group

Oswal Group - Overview
Oswal Group - Product / Service
Oswal Group - Key offerings
SWOT

15.15 Sintex Industries Ltd.

Sintex Industries Ltd. - Overview
Sintex Industries Ltd. - Product / Service
Sintex Industries Ltd. - Key offerings
SWOT

15.16 Sutlej Textiles and Industries

Sutlej Textiles and Industries - Overview
Sutlej Textiles and Industries - Business segments
Sutlej Textiles and Industries - Key offerings
Sutlej Textiles and Industries - Segment focus
SWOT

15.17 Trident Ltd.

Trident Ltd. - Overview
Trident Ltd. - Business segments
Trident Ltd. - Key offerings
Trident Ltd. - Segment focus
SWOT

15.18 Unifi Inc.

Unifi Inc. - Overview
Unifi Inc. - Business segments
Unifi Inc. - Key offerings
Unifi Inc. - Segment focus
SWOT

16. Appendix

16.1 Scope of the report

Market definition
Objectives
Notes and caveats

16.2 Inclusions and exclusions checklist

Inclusions checklist
Exclusions checklist

16.3 Currency conversion rates for US$

16.4 Research methodology

16.5 Data procurement

Information sources

16.6 Data validation

16.7 Validation techniques employed for market sizing

16.8 Data synthesis

16.9 360 degree market analysis

16.10 List of abbreviations

Research Methodology

Technavio presents a detailed picture of the market by way of study, synthesis, and summation of data from multiple sources. The analysts have presented the various facets of the market with a particular focus on identifying the key industry influencers. The data thus presented is comprehensive, reliable, and the result of extensive research, both primary and secondary.

INFORMATION SOURCES

Primary sources

  • Manufacturers and suppliers
  • Channel partners
  • Industry experts
  • Strategic decision makers

Secondary sources

  • Industry journals and periodicals
  • Government data
  • Financial reports of key industry players
  • Historical data
  • Press releases

DATA ANALYSIS

Data Synthesis

  • Collation of data
  • Estimation of key figures
  • Analysis of derived insights

Data Validation

  • Triangulation with data models
  • Reference against proprietary databases
  • Corroboration with industry experts

REPORT WRITING

Qualitative

  • Market drivers
  • Market challenges
  • Market trends
  • Five forces analysis

Quantitative

  • Market size and forecast
  • Market segmentation
  • Geographical insights
  • Competitive landscape

Interested in this report?

Get your sample now to see our research methodology and insights!

Download Now

Frequently Asked Questions

Cotton market growth will increase by USD 9603.8 million during 2026-2030.

The Cotton market is expected to grow at a CAGR of 3.4% during 2026-2030.

Cotton market is segmented by Application (Cotton fiber, Cotton seed oil, Cotton seed) Distribution channel (Offline, Online) Type (Medium staple, Long staple, Short staple)

Ambika Cotton Mills Ltd., Asha Cotton Industries, Banswara Syntex Ltd., Bombay Dyeing Co., Carr Textile, Damodar Group, Hengli Group Co. Ltd., Huafu Fashion Co. Ltd., Loyal Textile Mills Ltd., Lu Thai Textile Co. Ltd., Oswal Group, Sintex Industries Ltd., Sutlej Textiles and Industries, The Lakshmi Mills Co. Ltd., Trident Ltd., Unifi Inc., Vardhman Textile Ltd. are a few of the key vendors in the Cotton market.

APAC will register the highest growth rate of 74.9% among the other regions. Therefore, the Cotton market in APAC is expected to garner significant business opportunities for the vendors during the forecast period.

China, Japan, India, Pakistan, South Korea, Australia, Turkey, Egypt, South Africa, UAE, Mali, US, Canada, Mexico, Brazil, Argentina, Colombia, Germany, UK, France, Italy, Spain, The Netherlands

  • Expanding entrepreneurship culture encouraging low risk business ownership models is the driving factor this market.

The Cotton market vendors should focus on grabbing business opportunities from the Application segment as it accounted for the largest market share in the base year.
RIA - Research AI Assistant
Ask RIA