Grain Cart Market Analysis, Size, and Forecast 2026-2030: North America (US, Canada, and Mexico), Europe (Germany, UK, and France), APAC (China, Japan, and Australia), South America (Brazil, Argentina, and Colombia), Middle East and Africa (South Africa, Saudi Arabia, and UAE), and Rest of World (ROW)

Grain Cart Market Analysis, Size, and Forecast 2026-2030:
North America (US, Canada, and Mexico), Europe (Germany, UK, and France), APAC (China, Japan, and Australia), South America (Brazil, Argentina, and Colombia), Middle East and Africa (South Africa, Saudi Arabia, and UAE), and Rest of World (ROW)

Published: Dec 2025 290 Pages SKU: IRTNTR81182

Market Overview at a Glance

$652.4 Mn
Market Opportunity
7.9%
CAGR 2025 - 2030
38.2%
North America Growth
$905.9 Mn
Direct sales segment 2024

Grain Cart Market Size 2026-2030

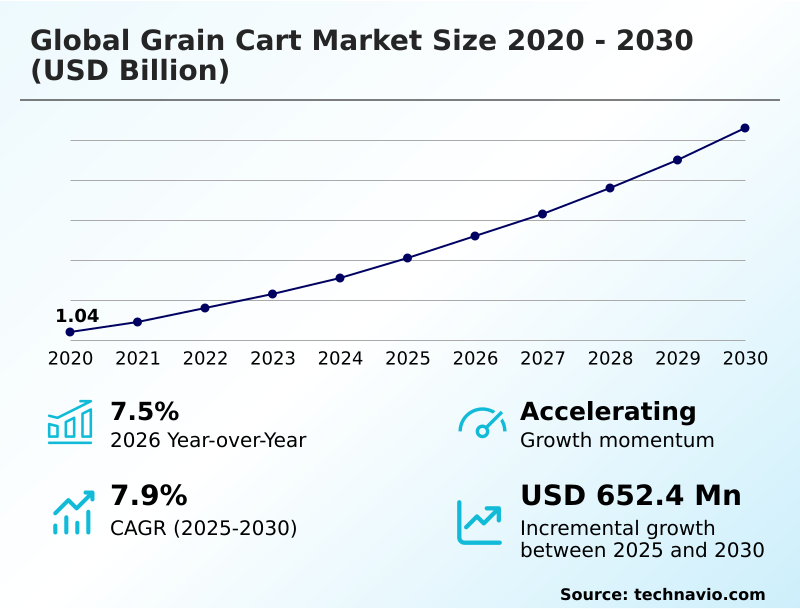
The grain cart market size is valued to increase by USD 652.4 million, at a CAGR of 7.9% from 2025 to 2030. Increasing farm consolidation and larger agricultural operations will drive the grain cart market.

Major Market Trends & Insights

  • North America dominated the market and accounted for a 38.2% growth during the forecast period.
  • By Distribution Channel - Direct sales segment was valued at USD 905.9 million in 2024
  • By Type - Dual auger cart segment accounted for the largest market revenue share in 2024

Market Size & Forecast

  • Market Opportunities: USD 1.03 billion
  • Market Future Opportunities: USD 652.4 million
  • CAGR from 2025 to 2030 : 7.9%

Market Summary

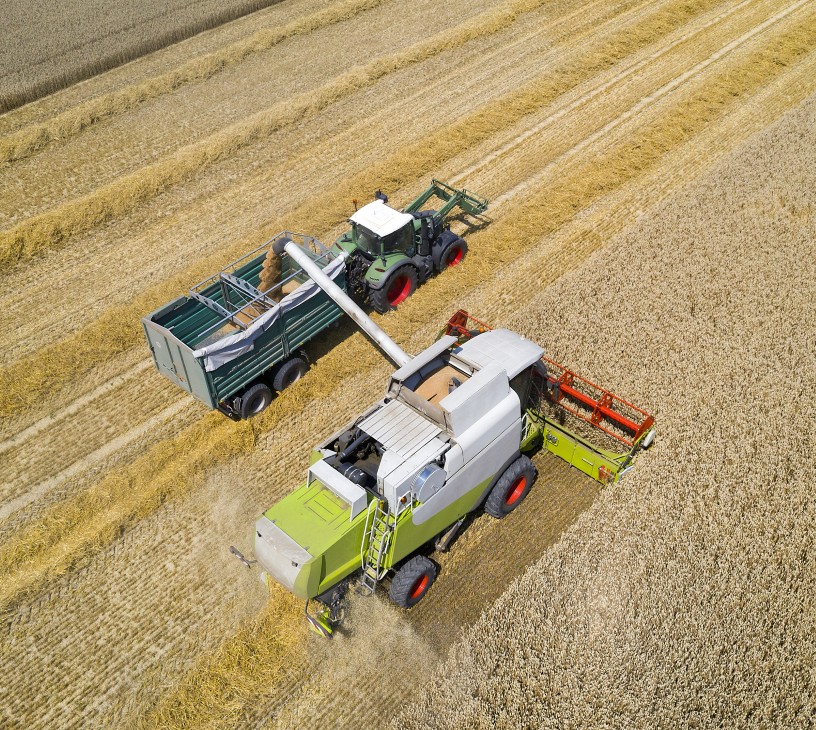
  • The grain cart market is undergoing a significant transformation, evolving from its traditional role in grain handling solutions to becoming a pivotal component of smart farming equipment. This shift is primarily driven by farm consolidation trends, which necessitate larger, more efficient machinery to maximize harvest window efficiency.
  • Key technologies such as autonomous operation, telematics, and onboard weighing systems are no longer niche features but are becoming standard for harvest logistics optimization. As modern combines achieve higher throughput, the seamless integration with a high-capacity single auger cart or dual auger cart is crucial for maintaining a continuous harvesting process.
  • For instance, a large-scale farming operation must ensure equipment interoperability between a combine, tractor, and chaser bins to facilitate real-time farm data management for crop yield mapping. However, the high initial cost of advanced farming machinery and challenges in data integration present hurdles to widespread smart agriculture adoption.
  • The industry's trajectory points towards more connected and automated systems that enhance farm productivity enhancement while addressing persistent labor shortages through labor-saving agricultural technology. The use of GPS guidance and remote monitoring is central to this evolution.

What will be the Size of the Grain Cart Market during the forecast period?

Get Key Insights on Market Forecast (PDF) Request Free Sample

How is the Grain Cart Market Segmented?

The grain cart industry research report provides comprehensive data (region-wise segment analysis), with forecasts and estimates in "USD million" for the period 2026-2030, as well as historical data from 2020-2024 for the following segments.

  • Distribution channel
    • Direct sales
    • Indirect sales
  • Type
    • Dual auger cart
    • Single auger cart
    • Classic front fold cart
  • Application
    • Corn
    • Wheat
    • Rice
    • Others
  • Geography
    • North America
      • US
      • Canada
      • Mexico
    • Europe
      • Germany
      • UK
      • France
    • APAC
      • China
      • Japan
      • Australia
    • South America
      • Brazil
      • Argentina
      • Colombia
    • Middle East and Africa
      • South Africa
      • Saudi Arabia
      • UAE
    • Rest of World (ROW)

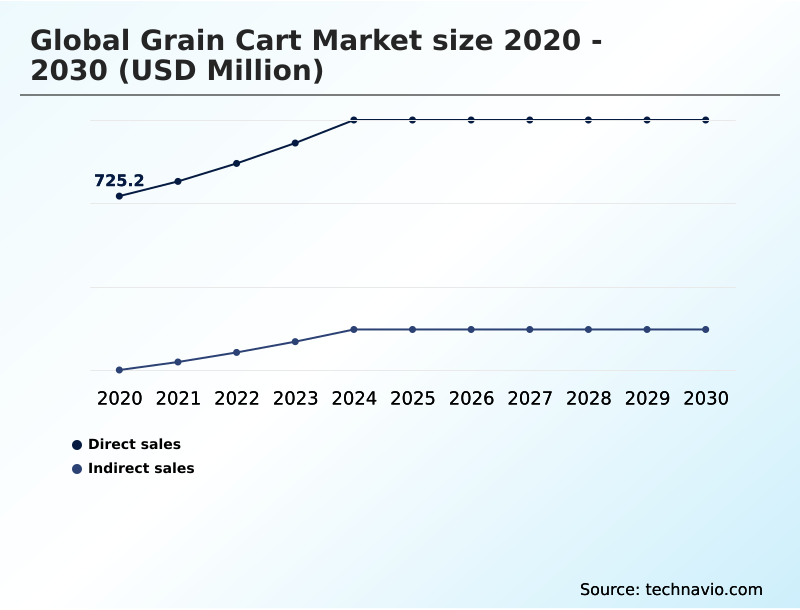
By Distribution Channel Insights

The direct sales segment is estimated to witness significant growth during the forecast period.

The direct sales channel is gaining traction as manufacturers leverage digital platforms to manage the customer journey, enhancing brand control and enabling higher profit margins.

This model facilitates direct farmer feedback, which is invaluable for R&D in high-capacity grain handling and crop transport solutions.

By engaging directly, manufacturers of equipment featuring hydraulic drive systems and adjustable spouts can better tailor agricultural equipment financing and demonstrate how a front fold auger design contributes to operational cost reduction.

This direct engagement fosters innovation and strengthens relationships, bypassing traditional intermediaries.

This approach improves the feedback loop for grain handling solutions, with some manufacturers noting a direct-to-consumer sales model can enhance farm productivity enhancement by aligning product development more closely with end-user needs, reducing the sales cycle by over 15%.

Request Free Sample

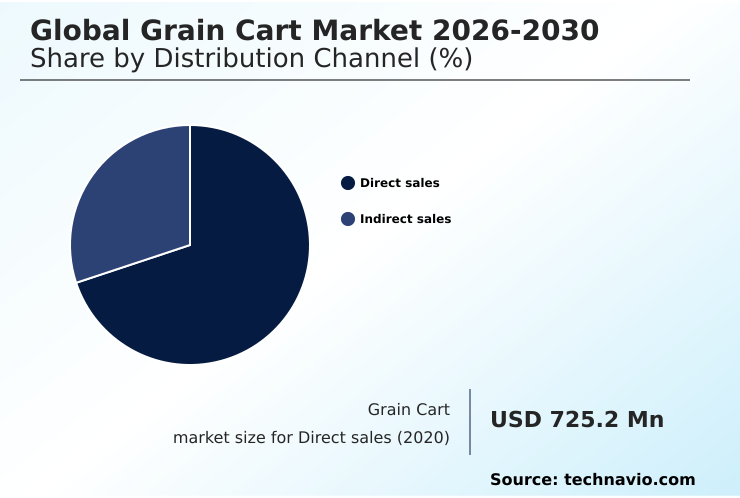
The Direct sales segment was valued at USD 905.9 million in 2024 and showed a gradual increase during the forecast period.

Request Free Sample

Regional Analysis

North America is estimated to contribute 38.2% to the growth of the global market during the forecast period.Technavio’s analysts have elaborately explained the regional trends and drivers that shape the market during the forecast period.

See How Grain Cart Market Demand is Rising in North America Request Free Sample

The geographic landscape of the grain cart market is led by North America, which is set to contribute 38% of the market's incremental growth, driven by large-scale farms and high technology adoption.

This region's focus on harvest logistics optimization and soil compaction management through the use of track systems is pronounced.

In contrast, the APAC region is projected to exhibit the fastest growth, with a CAGR of 8.9%, fueled by government-led mechanization initiatives. In this region, the adoption of yield monitoring sensors and GPS guidance for in-field grain transport is increasing.

Europe maintains a stable market, emphasizing sustainable farming practices and fleet management telematics.

South America, particularly Brazil and Argentina, shows strong demand for robust equipment for crop yield mapping, while the Middle East and Africa represent an emerging market with long-term potential.

Market Dynamics

Our researchers analyzed the data with 2025 as the base year, along with the key drivers, trends, and challenges. A holistic analysis of drivers will help companies refine their marketing strategies to gain a competitive advantage.

  • Strategic decision-making for farm equipment now extends beyond simple capacity, focusing on the total cost-benefit analysis of autonomous grain carts and the specific benefits of dual auger vs single auger cart designs. Selecting flotation tires for high-capacity grain carts or investing in technology to reduce grain cart soil compaction are critical agronomic choices.
  • The role of grain carts in precision agriculture is expanding, with farmers using grain cart data for yield mapping to inform subsequent planting strategies. To combat workforce issues, grain cart automation for labor shortages has become a key investment driver. The core operational goal is maximizing combine uptime with grain carts, which requires perfectly synchronizing grain cart speed with combines.
  • Integrating GPS into grain cart operations and utilizing telematics for remote grain cart monitoring are now standard for improving harvest logistics with smart grain carts. However, challenges of grain cart technology integration persist. Success also hinges on practical considerations, from understanding front fold auger visibility and safety benefits to ensuring proper grain cart maintenance for harvest readiness.
  • Given that government subsidies for agricultural mechanization are often available, the ROI of onboard weighing systems on grain carts becomes even more compelling, with some automated systems improving unloading speeds by over 20% compared to manual methods.

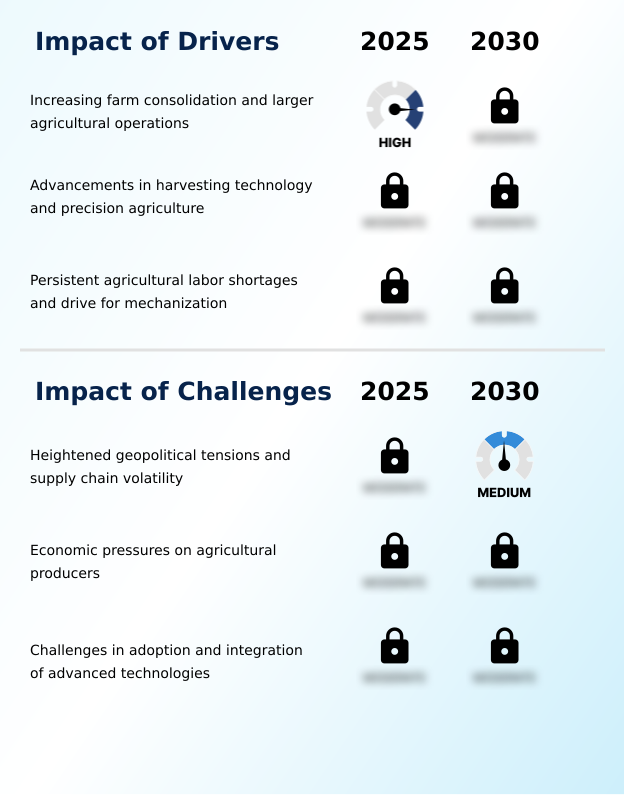
What are the key market drivers leading to the rise in the adoption of Grain Cart Industry?

  • The ongoing consolidation of farms into larger agricultural operations is a principal driver for the grain cart market, creating demand for higher-capacity equipment.

  • The market's primary driver is the structural shift toward larger agricultural operations due to farm consolidation trends, which magnifies logistical challenges and demands equipment that maximizes harvest window efficiency.
  • Modern, high-capacity combines require seamless combine harvester integration with grain carts to enable a continuous harvesting process, directly boosting combine uptime maximization.
  • Agricultural mechanization, including the adoption of flotation tires to handle larger loads, is further propelled by persistent labor shortages, with 80% of farmers citing rising labor costs as a reason for investing in labor-saving agricultural technology.
  • Advanced farm data management systems are becoming essential, creating a sustained global demand for efficient grain handling solutions that support the productivity of these expanding, data-driven operations.

What are the market trends shaping the Grain Cart Industry?

  • The accelerating integration of precision agriculture technologies is a predominant trend. This development is fundamentally altering the role of the grain cart within the modern farming ecosystem.

  • A transformative trend in the market is the rapid integration of precision agriculture technologies, shifting the grain cart's function from simple transport to a data-rich node in the agricultural ecosystem. The commercial rollout of autonomous operation systems, enabling the synchronization of cart and combine for unloading-on-the-go, exemplifies this push.
  • This advanced farming machinery, supported by telematics and digital farming platforms, addresses labor shortages and boosts efficiency. With guidance system usage at 70% and yield maps at 68% on large farms, the demand for smart farming equipment with strong equipment interoperability is clear.
  • This technological drive is creating autonomous harvesting systems that promise to revolutionize harvest logistics by enhancing precision and reducing operator-dependent tasks, reflecting a significant leap in agricultural automation.

What challenges does the Grain Cart Industry face during its growth?

  • Heightened geopolitical tensions and resulting supply chain volatility present a significant challenge, impacting raw material costs and component availability across the industry.

  • Economic pressures and supply chain volatility present significant challenges, as fluctuating commodity prices and high input costs squeeze farmer profit margins, leading to delayed machinery investments. This is evident in the UK, where new tractor registrations fell 15% in 2024.
  • Consequently, the high initial cost of a technologically advanced dual auger cart or single auger cart remains a barrier to smart agriculture adoption for many. Even for those who invest, issues persist around data-driven agriculture, including ensuring seamless data transfer between chaser bins, onboard weighing systems, and farm management software.
  • Effective post-harvest logistics and grain spillage reduction depend on operator skill and reliable remote monitoring, highlighting a need for better training and more robust, user-friendly systems.

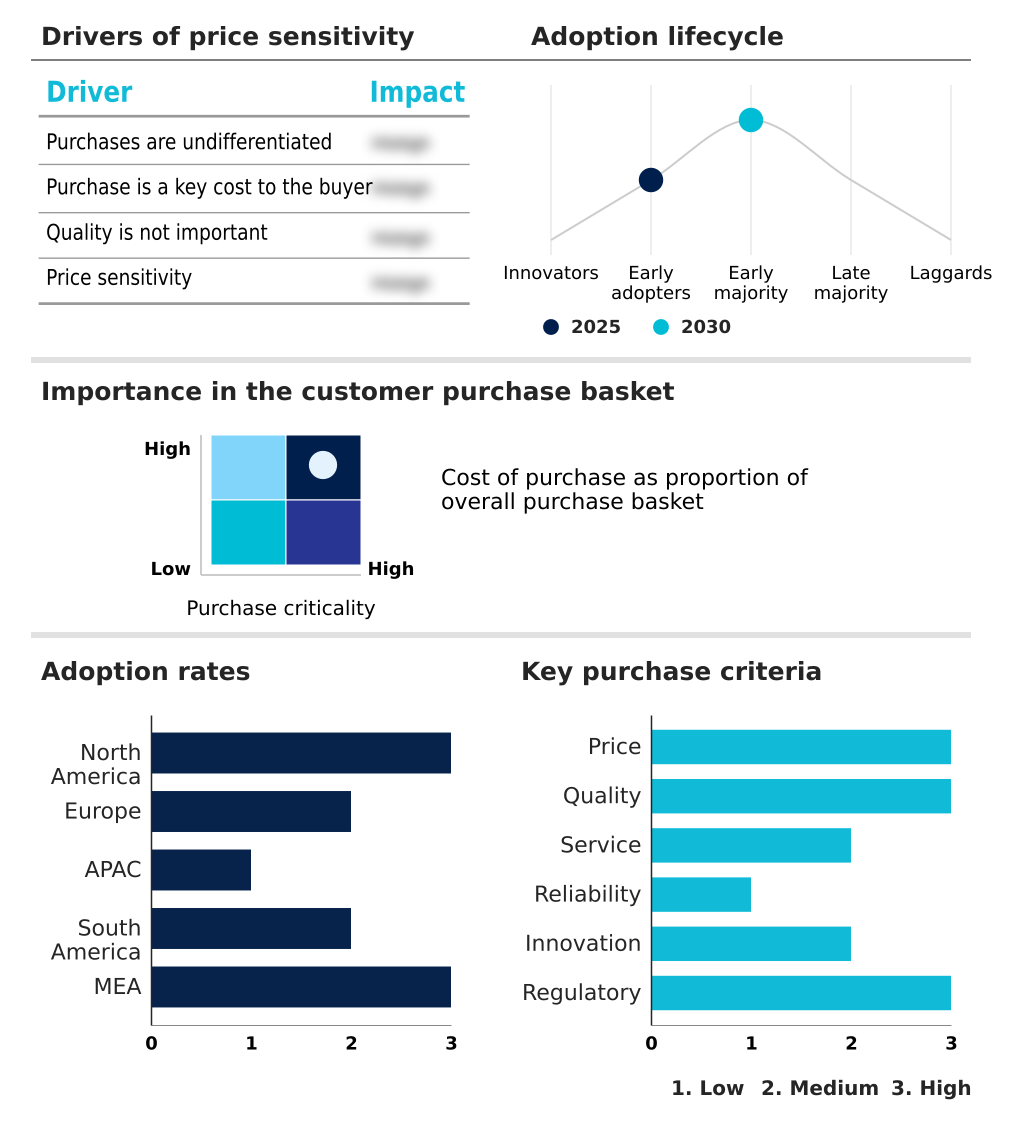
Exclusive Technavio Analysis on Customer Landscape

The grain cart market forecasting report includes the adoption lifecycle of the market, covering from the innovator’s stage to the laggard’s stage. It focuses on adoption rates in different regions based on penetration. Furthermore, the grain cart market report also includes key purchase criteria and drivers of price sensitivity to help companies evaluate and develop their market growth analysis strategies.

Customer Landscape of Grain Cart Industry

Competitive Landscape

Companies are implementing various strategies, such as strategic alliances, grain cart market forecast, partnerships, mergers and acquisitions, geographical expansion, and product/service launches, to enhance their presence in the industry.

Balzer Inc. - A specialized portfolio of large-capacity agricultural equipment, including grain carts and manure handling systems, addresses the needs of extensive farming operations.

The industry research and growth report includes detailed analyses of the competitive landscape of the market and information about key companies, including:

  • Balzer Inc.
  • Bourgault Industries Ltd.
  • Brandt Group of Companies
  • Brent Equipment
  • CNH Industrial N.V.
  • Deere and Co.
  • Demco Products
  • Elmers Manufacturing Inc.
  • Grain Saver
  • GRAINKING
  • J and M Manufacturing Co. Inc.
  • Kinze Manufacturing Inc.
  • KUHN SAS
  • MK Martin
  • Stara SA Industria De
  • Unverferth Manufacturing Co. Inc.

Qualitative and quantitative analysis of companies has been conducted to help clients understand the wider business environment as well as the strengths and weaknesses of key industry players. Data is qualitatively analyzed to categorize companies as pure play, category-focused, industry-focused, and diversified; it is quantitatively analyzed to categorize companies as dominant, leading, strong, tentative, and weak.

Recent Development and News in Grain cart market

  • In August 2024, PTx Trimble introduced OutRun, the first commercially available autonomous retrofit grain cart solution designed for mixed fleets, enabling the combine operator to control the entire unloading process.
  • In November 2024, Unverferth Manufacturing began accepting orders for its new model 2520 dual-auger grain cart, featuring a 2,500-bushel capacity and an advanced hydraulically tensioned track system for the 2025 season.
  • In February 2025, Deere and Co. presented its model year 2025 innovations, including autonomy-ready high-horsepower tractors and C-Series air carts, reflecting an industry-wide push toward automation that impacts grain handling.
  • In May 2025, Al Dahra, a prominent multinational agribusiness, partnered with Syngenta to deploy the Cropwise Operations digital farm management platform across its farms, showcasing a commitment to high-tech, large-scale agriculture.

Dive into Technavio’s robust research methodology, blending expert interviews, extensive data synthesis, and validated models for unparalleled Grain Cart Market insights. See full methodology.

Market Scope
Page number 290
Base year 2025
Historic period 2020-2024
Forecast period 2026-2030
Growth momentum & CAGR Accelerate at a CAGR of 7.9%
Market growth 2026-2030 USD 652.4 million
Market structure Fragmented
YoY growth 2025-2026(%) 7.5%
Key countries US, Canada, Mexico, Germany, UK, France, Italy, Spain, The Netherlands, China, Japan, Australia, India, South Korea, Indonesia, Brazil, Argentina, Colombia, South Africa, Saudi Arabia, UAE, Turkey and Israel
Competitive landscape Leading Companies, Market Positioning of Companies, Competitive Strategies, and Industry Risks

Request Free Sample

Research Analyst Overview

  • The grain cart market is defined by its evolution from a simple conveyance to a critical data-gathering asset in precision agriculture technologies. The integration of onboard weighing systems, yield monitoring sensors, and GPS guidance transforms these machines into mobile hubs for farm data management.
  • This shift is not merely about convenience; it is about providing the granular data needed for harvest logistics optimization and strategic farm planning. A key boardroom consideration is how data from a smart grain cart, such as a dual auger cart or single auger cart, informs capital expenditure on other smart farming equipment.
  • For example, with yield maps being used on 68% of large-scale crop farms, the data collected during the continuous harvesting process via unloading-on-the-go directly influences decisions on variable-rate application technology for the following season.
  • This trend toward agricultural mechanization, including the use of track systems for soil compaction management and advanced combine harvester integration, underscores the cart's role as an indispensable tool for high-capacity grain handling and achieving tangible gains in operational efficiency.

What are the Key Data Covered in this Grain Cart Market Research and Growth Report?

  • What is the expected growth of the Grain Cart Market between 2026 and 2030?

    • USD 652.4 million, at a CAGR of 7.9%

  • What segmentation does the market report cover?

    • The report is segmented by Distribution Channel (Direct sales, and Indirect sales), Type (Dual auger cart, Single auger cart, and Classic front fold cart), Application (Corn, Wheat, Rice, and Others) and Geography (North America, Europe, APAC, South America, Middle East and Africa)

  • Which regions are analyzed in the report?

    • North America, Europe, APAC, South America and Middle East and Africa

  • What are the key growth drivers and market challenges?

    • Increasing farm consolidation and larger agricultural operations, Heightened geopolitical tensions and supply chain volatility

  • Who are the major players in the Grain Cart Market?

    • Balzer Inc., Bourgault Industries Ltd., Brandt Group of Companies, Brent Equipment, CNH Industrial N.V., Deere and Co., Demco Products, Elmers Manufacturing Inc., Grain Saver, GRAINKING, J and M Manufacturing Co. Inc., Kinze Manufacturing Inc., KUHN SAS, MK Martin, Stara SA Industria De and Unverferth Manufacturing Co. Inc.

Market Research Insights

  • The grain cart market dynamics are shaped by the pursuit of operational efficiency, with advanced farming machinery becoming central to modern agriculture. The adoption of labor-saving agricultural technology is not merely a choice but a necessity, as evidenced by data showing 80% of farmers invested in such tech due to rising labor costs.
  • Farm consolidation trends further accelerate this shift, as larger operations require solutions that maximize combine uptime. Digital farming platforms and autonomous harvesting systems are at the forefront of this evolution, offering enhanced farm productivity enhancement. For example, the use of guidance systems is prevalent on 70% of large-scale crop farms, demonstrating a high rate of smart agriculture adoption.
  • This integration of technology is critical for improving post-harvest logistics and achieving significant operational cost reduction.

We can help! Our analysts can customize this grain cart market research report to meet your requirements.

Get in touch

1. Executive Summary

1.1 Market overview

Executive Summary - Chart on Market Overview
Executive Summary - Data Table on Market Overview
Executive Summary - Chart on Global Market Characteristics
Executive Summary - Chart on Market by Geography
Executive Summary - Chart on Market Segmentation by Distribution Channel
Executive Summary - Chart on Market Segmentation by Type
Executive Summary - Chart on Market Segmentation by Application
Executive Summary - Chart on Incremental Growth
Executive Summary - Data Table on Incremental Growth
Executive Summary - Chart on Company Market Positioning

2. Technavio Analysis

2.1 Analysis of price sensitivity, lifecycle, customer purchase basket, adoption rates, and purchase criteria

2.2 Criticality of inputs and Factors of differentiation

Chart on Overview on criticality of inputs and factors of differentiation

2.3 Factors of disruption

Chart on Overview on factors of disruption

2.4 Impact of drivers and challenges

Chart on Impact of drivers and challenges in 2025 and 2030

3. Market Landscape

3.1 Market ecosystem

Chart on Parent Market
Data Table on - Parent Market

3.2 Market characteristics

Chart on Market characteristics analysis

3.3 Value chain analysis

Chart on Value chain analysis

4. Market Sizing

4.1 Market definition

Data Table on Offerings of companies included in the market definition

4.2 Market segment analysis

Market segments

4.3 Market size 2025

4.4 Market outlook: Forecast for 2025-2030

Chart on Global - Market size and forecast 2025-2030 ($ million)
Data Table on Global - Market size and forecast 2025-2030 ($ million)
Chart on Global Market: Year-over-year growth 2025-2030 (%)
Data Table on Global Market: Year-over-year growth 2025-2030 (%)

5. Historic Market Size

5.1 Global Grain Cart Market 2020 - 2024

Historic Market Size - Data Table on Global Grain Cart Market 2020 - 2024 ($ million)

5.2 Distribution Channel segment analysis 2020 - 2024

Historic Market Size - Distribution Channel Segment 2020 - 2024 ($ million)

5.3 Type segment analysis 2020 - 2024

Historic Market Size - Type Segment 2020 - 2024 ($ million)

5.4 Application segment analysis 2020 - 2024

Historic Market Size - Application Segment 2020 - 2024 ($ million)

5.5 Geography segment analysis 2020 - 2024

Historic Market Size - Geography Segment 2020 - 2024 ($ million)

5.6 Country segment analysis 2020 - 2024

Historic Market Size - Country Segment 2020 - 2024 ($ million)

6. Qualitative Analysis

6.1 The AI impact on global grain cart market

7. Five Forces Analysis

7.1 Five forces summary

Five forces analysis - Comparison between 2025 and 2030

7.2 Bargaining power of buyers

Bargaining power of buyers - Impact of key factors 2025 and 2030

7.3 Bargaining power of suppliers

Bargaining power of suppliers - Impact of key factors in 2025 and 2030

7.4 Threat of new entrants

Threat of new entrants - Impact of key factors in 2025 and 2030

7.5 Threat of substitutes

Threat of substitutes - Impact of key factors in 2025 and 2030

7.6 Threat of rivalry

Threat of rivalry - Impact of key factors in 2025 and 2030

7.7 Market condition

Chart on Market condition - Five forces 2025 and 2030

8. Market Segmentation by Distribution Channel

8.1 Market segments

Chart on Distribution Channel - Market share 2025-2030 (%)
Data Table on Distribution Channel - Market share 2025-2030 (%)

8.2 Comparison by Distribution Channel

Chart on Comparison by Distribution Channel
Data Table on Comparison by Distribution Channel

8.3 Direct sales - Market size and forecast 2025-2030

Chart on Direct sales - Market size and forecast 2025-2030 ($ million)
Data Table on Direct sales - Market size and forecast 2025-2030 ($ million)
Chart on Direct sales - Year-over-year growth 2025-2030 (%)
Data Table on Direct sales - Year-over-year growth 2025-2030 (%)

8.4 Indirect sales - Market size and forecast 2025-2030

Chart on Indirect sales - Market size and forecast 2025-2030 ($ million)
Data Table on Indirect sales - Market size and forecast 2025-2030 ($ million)
Chart on Indirect sales - Year-over-year growth 2025-2030 (%)
Data Table on Indirect sales - Year-over-year growth 2025-2030 (%)

8.5 Market opportunity by Distribution Channel

Market opportunity by Distribution Channel ($ million)
Data Table on Market opportunity by Distribution Channel ($ million)

9. Market Segmentation by Type

9.1 Market segments

Chart on Type - Market share 2025-2030 (%)
Data Table on Type - Market share 2025-2030 (%)

9.2 Comparison by Type

Chart on Comparison by Type
Data Table on Comparison by Type

9.3 Dual auger cart - Market size and forecast 2025-2030

Chart on Dual auger cart - Market size and forecast 2025-2030 ($ million)
Data Table on Dual auger cart - Market size and forecast 2025-2030 ($ million)
Chart on Dual auger cart - Year-over-year growth 2025-2030 (%)
Data Table on Dual auger cart - Year-over-year growth 2025-2030 (%)

9.4 Single auger cart - Market size and forecast 2025-2030

Chart on Single auger cart - Market size and forecast 2025-2030 ($ million)
Data Table on Single auger cart - Market size and forecast 2025-2030 ($ million)
Chart on Single auger cart - Year-over-year growth 2025-2030 (%)
Data Table on Single auger cart - Year-over-year growth 2025-2030 (%)

9.5 Classic front fold cart - Market size and forecast 2025-2030

Chart on Classic front fold cart - Market size and forecast 2025-2030 ($ million)
Data Table on Classic front fold cart - Market size and forecast 2025-2030 ($ million)
Chart on Classic front fold cart - Year-over-year growth 2025-2030 (%)
Data Table on Classic front fold cart - Year-over-year growth 2025-2030 (%)

9.6 Market opportunity by Type

Market opportunity by Type ($ million)
Data Table on Market opportunity by Type ($ million)

10. Market Segmentation by Application

10.1 Market segments

Chart on Application - Market share 2025-2030 (%)
Data Table on Application - Market share 2025-2030 (%)

10.2 Comparison by Application

Chart on Comparison by Application
Data Table on Comparison by Application

10.3 Corn - Market size and forecast 2025-2030

Chart on Corn - Market size and forecast 2025-2030 ($ million)
Data Table on Corn - Market size and forecast 2025-2030 ($ million)
Chart on Corn - Year-over-year growth 2025-2030 (%)
Data Table on Corn - Year-over-year growth 2025-2030 (%)

10.4 Wheat - Market size and forecast 2025-2030

Chart on Wheat - Market size and forecast 2025-2030 ($ million)
Data Table on Wheat - Market size and forecast 2025-2030 ($ million)
Chart on Wheat - Year-over-year growth 2025-2030 (%)
Data Table on Wheat - Year-over-year growth 2025-2030 (%)

10.5 Rice - Market size and forecast 2025-2030

Chart on Rice - Market size and forecast 2025-2030 ($ million)
Data Table on Rice - Market size and forecast 2025-2030 ($ million)
Chart on Rice - Year-over-year growth 2025-2030 (%)
Data Table on Rice - Year-over-year growth 2025-2030 (%)

10.6 Others - Market size and forecast 2025-2030

Chart on Others - Market size and forecast 2025-2030 ($ million)
Data Table on Others - Market size and forecast 2025-2030 ($ million)
Chart on Others - Year-over-year growth 2025-2030 (%)
Data Table on Others - Year-over-year growth 2025-2030 (%)

10.7 Market opportunity by Application

Market opportunity by Application ($ million)
Data Table on Market opportunity by Application ($ million)

11. Customer Landscape

11.1 Customer landscape overview

Analysis of price sensitivity, lifecycle, customer purchase basket, adoption rates, and purchase criteria

12. Geographic Landscape

12.1 Geographic segmentation

Chart on Market share by geography 2025-2030 (%)
Data Table on Market share by geography 2025-2030 (%)

12.2 Geographic comparison

Chart on Geographic comparison
Data Table on Geographic comparison

12.3 North America - Market size and forecast 2025-2030

Chart on North America - Market size and forecast 2025-2030 ($ million)
Data Table on North America - Market size and forecast 2025-2030 ($ million)
Chart on North America - Year-over-year growth 2025-2030 (%)
Data Table on North America - Year-over-year growth 2025-2030 (%)
Chart on Regional Comparison - North America
Data Table on Regional Comparison - North America

12.3.1 US - Market size and forecast 2025-2030

Chart on US - Market size and forecast 2025-2030 ($ million)
Data Table on US - Market size and forecast 2025-2030 ($ million)
Chart on US - Year-over-year growth 2025-2030 (%)
Data Table on US - Year-over-year growth 2025-2030 (%)

12.3.2 Canada - Market size and forecast 2025-2030

Chart on Canada - Market size and forecast 2025-2030 ($ million)
Data Table on Canada - Market size and forecast 2025-2030 ($ million)
Chart on Canada - Year-over-year growth 2025-2030 (%)
Data Table on Canada - Year-over-year growth 2025-2030 (%)

12.3.3 Mexico - Market size and forecast 2025-2030

Chart on Mexico - Market size and forecast 2025-2030 ($ million)
Data Table on Mexico - Market size and forecast 2025-2030 ($ million)
Chart on Mexico - Year-over-year growth 2025-2030 (%)
Data Table on Mexico - Year-over-year growth 2025-2030 (%)

12.4 Europe - Market size and forecast 2025-2030

Chart on Europe - Market size and forecast 2025-2030 ($ million)
Data Table on Europe - Market size and forecast 2025-2030 ($ million)
Chart on Europe - Year-over-year growth 2025-2030 (%)
Data Table on Europe - Year-over-year growth 2025-2030 (%)
Chart on Regional Comparison - Europe
Data Table on Regional Comparison - Europe

12.4.1 Germany - Market size and forecast 2025-2030

Chart on Germany - Market size and forecast 2025-2030 ($ million)
Data Table on Germany - Market size and forecast 2025-2030 ($ million)
Chart on Germany - Year-over-year growth 2025-2030 (%)
Data Table on Germany - Year-over-year growth 2025-2030 (%)

12.4.2 UK - Market size and forecast 2025-2030

Chart on UK - Market size and forecast 2025-2030 ($ million)
Data Table on UK - Market size and forecast 2025-2030 ($ million)
Chart on UK - Year-over-year growth 2025-2030 (%)
Data Table on UK - Year-over-year growth 2025-2030 (%)

12.4.3 France - Market size and forecast 2025-2030

Chart on France - Market size and forecast 2025-2030 ($ million)
Data Table on France - Market size and forecast 2025-2030 ($ million)
Chart on France - Year-over-year growth 2025-2030 (%)
Data Table on France - Year-over-year growth 2025-2030 (%)

12.4.4 Italy - Market size and forecast 2025-2030

Chart on Italy - Market size and forecast 2025-2030 ($ million)
Data Table on Italy - Market size and forecast 2025-2030 ($ million)
Chart on Italy - Year-over-year growth 2025-2030 (%)
Data Table on Italy - Year-over-year growth 2025-2030 (%)

12.4.5 Spain - Market size and forecast 2025-2030

Chart on Spain - Market size and forecast 2025-2030 ($ million)
Data Table on Spain - Market size and forecast 2025-2030 ($ million)
Chart on Spain - Year-over-year growth 2025-2030 (%)
Data Table on Spain - Year-over-year growth 2025-2030 (%)

12.4.6 The Netherlands - Market size and forecast 2025-2030

Chart on The Netherlands - Market size and forecast 2025-2030 ($ million)
Data Table on The Netherlands - Market size and forecast 2025-2030 ($ million)
Chart on The Netherlands - Year-over-year growth 2025-2030 (%)
Data Table on The Netherlands - Year-over-year growth 2025-2030 (%)

12.5 APAC - Market size and forecast 2025-2030

Chart on APAC - Market size and forecast 2025-2030 ($ million)
Data Table on APAC - Market size and forecast 2025-2030 ($ million)
Chart on APAC - Year-over-year growth 2025-2030 (%)
Data Table on APAC - Year-over-year growth 2025-2030 (%)
Chart on Regional Comparison - APAC
Data Table on Regional Comparison - APAC

12.5.1 China - Market size and forecast 2025-2030

Chart on China - Market size and forecast 2025-2030 ($ million)
Data Table on China - Market size and forecast 2025-2030 ($ million)
Chart on China - Year-over-year growth 2025-2030 (%)
Data Table on China - Year-over-year growth 2025-2030 (%)

12.5.2 Japan - Market size and forecast 2025-2030

Chart on Japan - Market size and forecast 2025-2030 ($ million)
Data Table on Japan - Market size and forecast 2025-2030 ($ million)
Chart on Japan - Year-over-year growth 2025-2030 (%)
Data Table on Japan - Year-over-year growth 2025-2030 (%)

12.5.3 Australia - Market size and forecast 2025-2030

Chart on Australia - Market size and forecast 2025-2030 ($ million)
Data Table on Australia - Market size and forecast 2025-2030 ($ million)
Chart on Australia - Year-over-year growth 2025-2030 (%)
Data Table on Australia - Year-over-year growth 2025-2030 (%)

12.5.4 India - Market size and forecast 2025-2030

Chart on India - Market size and forecast 2025-2030 ($ million)
Data Table on India - Market size and forecast 2025-2030 ($ million)
Chart on India - Year-over-year growth 2025-2030 (%)
Data Table on India - Year-over-year growth 2025-2030 (%)

12.5.5 South Korea - Market size and forecast 2025-2030

Chart on South Korea - Market size and forecast 2025-2030 ($ million)
Data Table on South Korea - Market size and forecast 2025-2030 ($ million)
Chart on South Korea - Year-over-year growth 2025-2030 (%)
Data Table on South Korea - Year-over-year growth 2025-2030 (%)

12.5.6 Indonesia - Market size and forecast 2025-2030

Chart on Indonesia - Market size and forecast 2025-2030 ($ million)
Data Table on Indonesia - Market size and forecast 2025-2030 ($ million)
Chart on Indonesia - Year-over-year growth 2025-2030 (%)
Data Table on Indonesia - Year-over-year growth 2025-2030 (%)

12.6 South America - Market size and forecast 2025-2030

Chart on South America - Market size and forecast 2025-2030 ($ million)
Data Table on South America - Market size and forecast 2025-2030 ($ million)
Chart on South America - Year-over-year growth 2025-2030 (%)
Data Table on South America - Year-over-year growth 2025-2030 (%)
Chart on Regional Comparison - South America
Data Table on Regional Comparison - South America

12.6.1 Brazil - Market size and forecast 2025-2030

Chart on Brazil - Market size and forecast 2025-2030 ($ million)
Data Table on Brazil - Market size and forecast 2025-2030 ($ million)
Chart on Brazil - Year-over-year growth 2025-2030 (%)
Data Table on Brazil - Year-over-year growth 2025-2030 (%)

12.6.2 Argentina - Market size and forecast 2025-2030

Chart on Argentina - Market size and forecast 2025-2030 ($ million)
Data Table on Argentina - Market size and forecast 2025-2030 ($ million)
Chart on Argentina - Year-over-year growth 2025-2030 (%)
Data Table on Argentina - Year-over-year growth 2025-2030 (%)

12.6.3 Colombia - Market size and forecast 2025-2030

Chart on Colombia - Market size and forecast 2025-2030 ($ million)
Data Table on Colombia - Market size and forecast 2025-2030 ($ million)
Chart on Colombia - Year-over-year growth 2025-2030 (%)
Data Table on Colombia - Year-over-year growth 2025-2030 (%)

12.7 Middle East and Africa - Market size and forecast 2025-2030

Chart on Middle East and Africa - Market size and forecast 2025-2030 ($ million)
Data Table on Middle East and Africa - Market size and forecast 2025-2030 ($ million)
Chart on Middle East and Africa - Year-over-year growth 2025-2030 (%)
Data Table on Middle East and Africa - Year-over-year growth 2025-2030 (%)
Chart on Regional Comparison - Middle East and Africa
Data Table on Regional Comparison - Middle East and Africa

12.7.1 South Africa - Market size and forecast 2025-2030

Chart on South Africa - Market size and forecast 2025-2030 ($ million)
Data Table on South Africa - Market size and forecast 2025-2030 ($ million)
Chart on South Africa - Year-over-year growth 2025-2030 (%)
Data Table on South Africa - Year-over-year growth 2025-2030 (%)

12.7.2 Saudi Arabia - Market size and forecast 2025-2030

Chart on Saudi Arabia - Market size and forecast 2025-2030 ($ million)
Data Table on Saudi Arabia - Market size and forecast 2025-2030 ($ million)
Chart on Saudi Arabia - Year-over-year growth 2025-2030 (%)
Data Table on Saudi Arabia - Year-over-year growth 2025-2030 (%)

12.7.3 UAE - Market size and forecast 2025-2030

Chart on UAE - Market size and forecast 2025-2030 ($ million)
Data Table on UAE - Market size and forecast 2025-2030 ($ million)
Chart on UAE - Year-over-year growth 2025-2030 (%)
Data Table on UAE - Year-over-year growth 2025-2030 (%)

12.7.4 Turkey - Market size and forecast 2025-2030

Chart on Turkey - Market size and forecast 2025-2030 ($ million)
Data Table on Turkey - Market size and forecast 2025-2030 ($ million)
Chart on Turkey - Year-over-year growth 2025-2030 (%)
Data Table on Turkey - Year-over-year growth 2025-2030 (%)

12.7.5 Israel - Market size and forecast 2025-2030

Chart on Israel - Market size and forecast 2025-2030 ($ million)
Data Table on Israel - Market size and forecast 2025-2030 ($ million)
Chart on Israel - Year-over-year growth 2025-2030 (%)
Data Table on Israel - Year-over-year growth 2025-2030 (%)

12.8 Market opportunity by geography

Market opportunity by geography ($ million)
Data Tables on Market opportunity by geography ($ million)

13. Drivers, Challenges, and Opportunity

13.1 Market drivers

Increasing farm consolidation and larger agricultural operations
Advancements in harvesting technology and precision agriculture
Persistent agricultural labor shortages and drive for mechanization

13.2 Market challenges

Heightened geopolitical tensions and supply chain volatility
Economic pressures on agricultural producers
Challenges in adoption and integration of advanced technologies

13.3 Impact of drivers and challenges

Impact of drivers and challenges in 2025 and 2030

13.4 Market opportunities

Integration of precision agriculture technologies
Advancements in automation and autonomous operation
Farm consolidation and demand for larger capacity carts

14. Competitive Landscape

14.1 Overview

14.2

Overview on criticality of inputs and factors of differentiation

14.3 Landscape disruption

Overview on factors of disruption

14.4 Industry risks

Impact of key risks on business

15. Competitive Analysis

15.1 Companies profiled

Companies covered

15.2 Company ranking index

15.3 Market positioning of companies

Matrix on companies position and classification

15.4 Balzer Inc.

Balzer Inc. - Overview
Balzer Inc. - Product / Service
Balzer Inc. - Key offerings
SWOT

15.5 Bourgault Industries Ltd.

Bourgault Industries Ltd. - Overview
Bourgault Industries Ltd. - Product / Service
Bourgault Industries Ltd. - Key offerings
SWOT

15.6 Brandt Group of Companies

Brandt Group of Companies - Overview
Brandt Group of Companies - Product / Service
Brandt Group of Companies - Key news
Brandt Group of Companies - Key offerings
SWOT

15.7 CNH Industrial N.V.

CNH Industrial N.V. - Overview
CNH Industrial N.V. - Product / Service
CNH Industrial N.V. - Key news
CNH Industrial N.V. - Key offerings
SWOT

15.8 Deere and Co.

Deere and Co. - Overview
Deere and Co. - Business segments
Deere and Co. - Key news
Deere and Co. - Key offerings
Deere and Co. - Segment focus
SWOT

15.9 Demco Products

Demco Products - Overview
Demco Products - Product / Service
Demco Products - Key offerings
SWOT

15.10 Elmers Manufacturing Inc.

Elmers Manufacturing Inc. - Overview
Elmers Manufacturing Inc. - Product / Service
Elmers Manufacturing Inc. - Key offerings
SWOT

15.11 Grain Saver

Grain Saver - Overview
Grain Saver - Product / Service
Grain Saver - Key offerings
SWOT

15.12 GRAINKING

GRAINKING - Overview
GRAINKING - Product / Service
GRAINKING - Key offerings
SWOT

15.13 J and M Manufacturing Co. Inc.

J and M Manufacturing Co. Inc. - Overview
J and M Manufacturing Co. Inc. - Product / Service
J and M Manufacturing Co. Inc. - Key offerings
SWOT

15.14 Kinze Manufacturing Inc.

Kinze Manufacturing Inc. - Overview
Kinze Manufacturing Inc. - Product / Service
Kinze Manufacturing Inc. - Key offerings
SWOT

15.15 KUHN SAS

KUHN SAS - Overview
KUHN SAS - Product / Service
KUHN SAS - Key offerings
SWOT

15.16 MK Martin

MK Martin - Overview
MK Martin - Product / Service
MK Martin - Key offerings
SWOT

15.17 Stara SA Industria De

Stara SA Industria De - Overview
Stara SA Industria De - Product / Service
Stara SA Industria De - Key offerings
SWOT

15.18 Unverferth Manufacturing Co. Inc.

Unverferth Manufacturing Co. Inc. - Overview
Unverferth Manufacturing Co. Inc. - Product / Service
Unverferth Manufacturing Co. Inc. - Key offerings
SWOT

16. Appendix

16.1 Scope of the report

Market definition
Objectives
Notes and caveats

16.2 Inclusions and exclusions checklist

Inclusions checklist
Exclusions checklist

16.3 Currency conversion rates for US$

16.4 Research methodology

16.5 Data procurement

Information sources

16.6 Data validation

16.7 Validation techniques employed for market sizing

16.8 Data synthesis

16.9 360 degree market analysis

16.10 List of abbreviations

Research Methodology

Technavio presents a detailed picture of the market by way of study, synthesis, and summation of data from multiple sources. The analysts have presented the various facets of the market with a particular focus on identifying the key industry influencers. The data thus presented is comprehensive, reliable, and the result of extensive research, both primary and secondary.

INFORMATION SOURCES

Primary sources

  • Manufacturers and suppliers
  • Channel partners
  • Industry experts
  • Strategic decision makers

Secondary sources

  • Industry journals and periodicals
  • Government data
  • Financial reports of key industry players
  • Historical data
  • Press releases

DATA ANALYSIS

Data Synthesis

  • Collation of data
  • Estimation of key figures
  • Analysis of derived insights

Data Validation

  • Triangulation with data models
  • Reference against proprietary databases
  • Corroboration with industry experts

REPORT WRITING

Qualitative

  • Market drivers
  • Market challenges
  • Market trends
  • Five forces analysis

Quantitative

  • Market size and forecast
  • Market segmentation
  • Geographical insights
  • Competitive landscape

Interested in this report?

Get your sample now to see our research methodology and insights!

Download Now

Frequently Asked Questions

Grain Cart market growth will increase by USD 652.4 million during 2026-2030 .

The Grain Cart market is expected to grow at a CAGR of 7.9% during 2026-2030 .

Grain Cart market is segmented by Distribution channel (Direct sales, Indirect sales) Type (Dual auger cart, Single auger cart, Classic front fold cart) Application (Corn, Wheat, Rice, Others)

Balzer Inc., Bourgault Industries Ltd., Brandt Group of Companies, Brent Equipment, CNH Industrial N.V., Deere and Co., Demco Products, Elmers Manufacturing Inc., Grain Saver, GRAINKING, J and M Manufacturing Co. Inc., Kinze Manufacturing Inc., KUHN SAS, MK Martin, Stara SA Industria De, Unverferth Manufacturing Co. Inc. are a few of the key vendors in the Grain Cart market.

North America will register the highest growth rate of 38.2% among the other regions. Therefore, the Grain Cart market in North America is expected to garner significant business opportunities for the vendors during the forecast period.

US, Canada, Mexico, Germany, UK, France, Italy, Spain, The Netherlands, China, Japan, Australia, India, South Korea, Indonesia, Brazil, Argentina, Colombia, South Africa, Saudi Arabia, UAE, Turkey, Israel

  • Increasing farm consolidation and larger agricultural operations is the driving factor this market.

The Grain Cart market vendors should focus on grabbing business opportunities from the Distribution channel segment as it accounted for the largest market share in the base year.