Combine Harvester Market Size 2026-2030
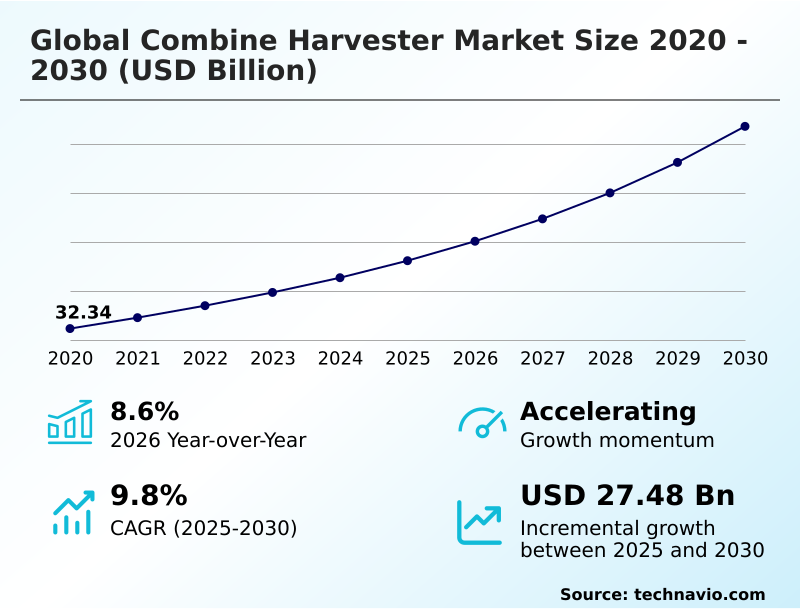
The combine harvester market size is valued to increase by USD 27.48 billion, at a CAGR of 9.8% from 2025 to 2030. Surging global population and imperative for enhanced food security will drive the combine harvester market.
Major Market Trends & Insights
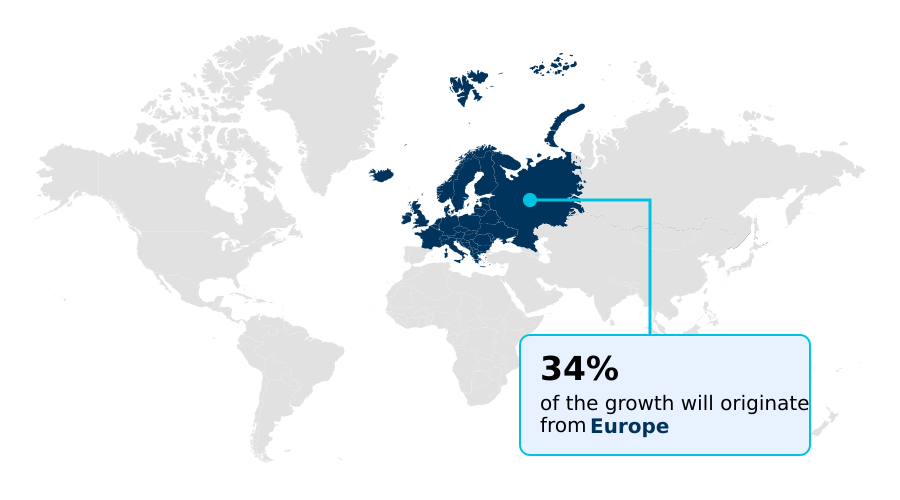
- Europe dominated the market and accounted for a 33.5% growth during the forecast period.
- By Product - Self-propelled segment was valued at USD 26.07 billion in 2024
- By Type - Wheel type segment accounted for the largest market revenue share in 2024
Market Size & Forecast
- Market Opportunities: USD 41.36 billion
- Market Future Opportunities: USD 27.48 billion
- CAGR from 2025 to 2030 : 9.8%
Market Summary
- The combine harvester market is defined by the continuous drive for agricultural productivity, spurred by global food security needs and the industrialization of farming practices. This imperative fuels demand for machinery that integrates core functions like reaping, threshing, and cleaning into a single, efficient process.
- Technological advancement is a cornerstone, with innovations in precision agriculture, including GPS guidance and automated yield monitoring, enhancing operational efficiency. For instance, farms are leveraging telematics to manage equipment fleets, optimizing deployment and maintenance schedules to maximize uptime during critical harvest windows. Such data-driven farm management enables better decision-making, from in-field adjustments to long-term crop strategy.
- While high capital costs present a barrier, the return on investment through increased yield, reduced labor dependency, and minimized crop loss validates the adoption of advanced self-propelled combine and crawler-type combine harvester models. The evolution toward autonomous and sustainable machinery, featuring electrified powertrains and advanced sensor technology, signals the industry's future trajectory, balancing productivity with environmental stewardship.
- The focus remains on maximizing yield and ensuring the quality of harvested grains like wheat and corn.
What will be the Size of the Combine Harvester Market during the forecast period?
Get Key Insights on Market Forecast (PDF) Get Free Sample
How is the Combine Harvester Market Segmented?
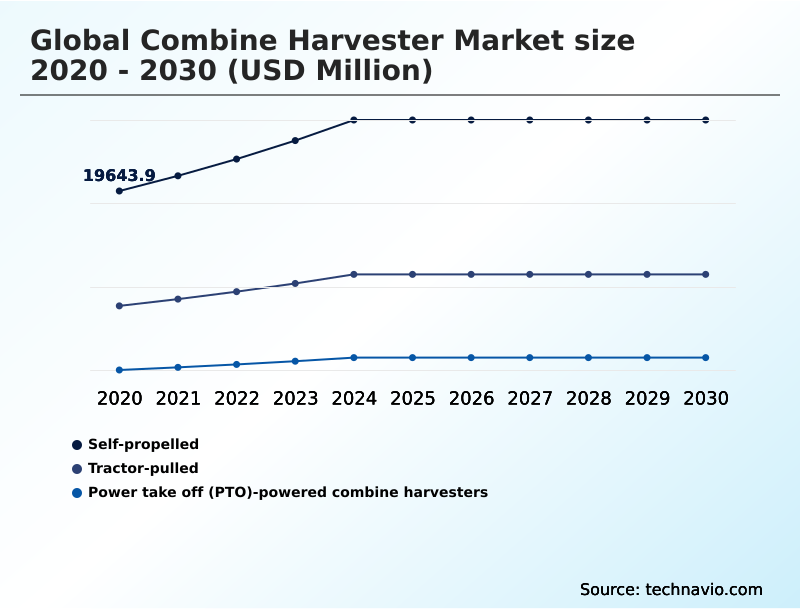
The combine harvester industry research report provides comprehensive data (region-wise segment analysis), with forecasts and estimates in "USD million" for the period 2026-2030, as well as historical data from 2020-2024 for the following segments.
- Product
- Self-propelled
- Tractor-pulled
- Power take off (PTO)-powered combine harvesters
- Type
- Wheel type
- Crawler type
- Power output
- 301 to 450 HP
- 151 to 300 HP
- Less than 150 HP
- Above 450 HP
- Geography
- Europe
- Germany
- France
- UK
- North America
- US
- Canada
- Mexico
- APAC
- China
- India
- Japan
- South America
- Brazil
- Argentina
- Middle East and Africa
- Turkey
- Saudi Arabia
- South Africa
- Rest of World (ROW)
- Europe
By Product Insights
The self-propelled segment is estimated to witness significant growth during the forecast period.
The self-propelled segment is central to modern, large-scale agriculture, driven by the need for enhanced productivity and operational efficiency amid ongoing farm consolidation. These integrated machines, which feature an onboard engine and complete harvesting systems, offer unparalleled capacity and speed.
Technological innovation is a primary competitive differentiator, leading to the integration of sophisticated systems. For instance, the adoption of telematics data systems has improved fleet management efficiency by over 20%.
Features such as GPS guidance control, automated yield mapping, and real-time machine diagnostics are now integral, empowering operators with data-driven insights.
The development of more powerful and fuel-efficient engines, along with advanced grain threshing mechanisms and rotary separator technology, further boosts throughput. These advancements address the chronic shortage of skilled agricultural labor by maximizing output per worker.
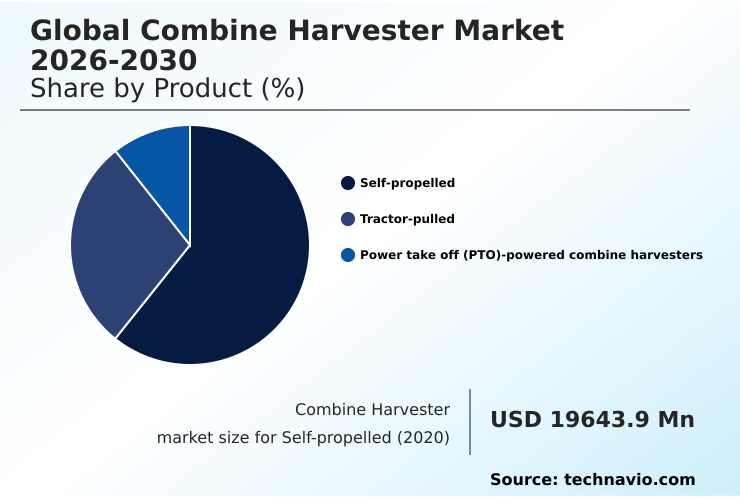
The Self-propelled segment was valued at USD 26.07 billion in 2024 and showed a gradual increase during the forecast period.
Regional Analysis
Europe is estimated to contribute 33.5% to the growth of the global market during the forecast period.Technavio’s analysts have elaborately explained the regional trends and drivers that shape the market during the forecast period.
See How Combine Harvester Market Demand is Rising in Europe Get Free Sample
The geographic landscape of the combine harvester market is diverse, with regional dynamics shaped by farm scale, crop types, and regulatory environments.
In North America and Europe, large-scale commercial farming drives demand for high-capacity, technologically advanced machines with features supporting precision agriculture integration. These regions account for a combined 59% of the market.
Conversely, in parts of APAC and South America, the focus is on smaller, more versatile equipment suited to varied terrain and farm sizes, alongside a growing farm mechanization rate.
Government subsidies and a focus on food security in these emerging markets are accelerating the transition from manual labor. The market in the Middle East and Africa, while smaller, shows high growth potential as modern agricultural practices are adopted.
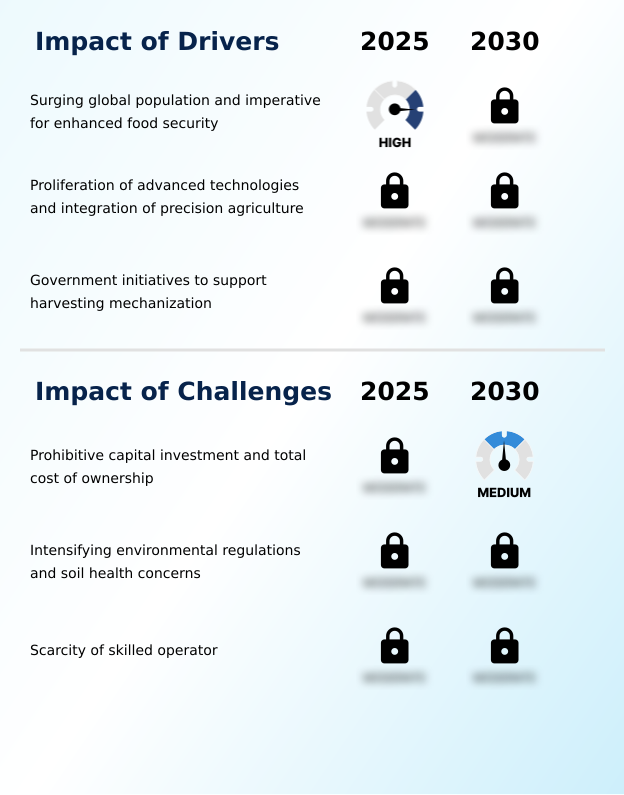
Market Dynamics
Our researchers analyzed the data with 2025 as the base year, along with the key drivers, trends, and challenges. A holistic analysis of drivers will help companies refine their marketing strategies to gain a competitive advantage.
- Strategic decision-making in the combine harvester market is increasingly complex, requiring a deep understanding of multiple performance factors. A key consideration is the impact of header design on harvesting speed, as optimized designs can improve field coverage by over 15% without increasing grain loss.
- Another critical debate is the crawler vs wheel type combine soil impact, where tracked systems demonstrably reduce soil compaction. As operations diversify, optimizing threshing systems for specialty crops becomes essential for maintaining quality. Operationally, the use of telematics for remote combine fleet management is now standard for large enterprises.
- Firms are also focusing on automation features for reducing operator fatigue and analyzing the cost-benefit of GPS autosteering in combines. The ability in improving grain quality with advanced sensors offers a distinct competitive advantage. Financially, assessing the ROI on precision yield monitoring systems and evaluating total cost of ownership for combines are critical.
- Businesses must explore financing options for high-capacity combine harvesters to manage capital expenditure. The benefits of automated ground speed control and the predictive maintenance impact on repair costs are also key evaluation points. Emerging technologies prompt analysis of hybrid-electric combine fuel efficiency benefits and comparisons between a multi-crop platform vs dedicated combine harvester.
- Agronomic challenges, such as reducing harvest losses in high-moisture corn, require specific combine harvester adjustments for small grain harvesting. Finally, the role of automation in addressing labor shortages and the impact of tire technology on soil compaction are central to future-proofing operations, alongside seamless data integration from combine to farm software.
What are the key market drivers leading to the rise in the adoption of Combine Harvester Industry?
- The primary market driver is the inexorable growth of the global population and the corresponding escalation in food demand, which creates sustained pressure to enhance agricultural productivity and efficiency.
- Market growth is propelled by foundational drivers linked to global food security and technological adoption. The increasing farm mechanization rate, especially in developing economies, is expanding the addressable market for both new and used equipment.
- Government initiatives providing subsidies and equipment financing solutions are critical in lowering adoption barriers. On large-scale commercial farming operations, the need for harvesting efficiency and grain quality preservation is paramount, driving investment in high-capacity machines.
- For example, adoption of auto-steering functions has been shown to reduce harvesting overlap by up to 10%, directly improving profitability.
- The proliferation of advanced technologies and precision agriculture integration is enabling farmers to optimize every aspect of the harvest, from reducing grain loss to better management of the total cost of ownership.
What are the market trends shaping the Combine Harvester Industry?
- A significant trend shaping the market is the accelerated research and development into electrification and alternative powertrain systems, representing a fundamental shift from the industry's reliance on conventional diesel engines.
- Key trends are reshaping the market, driven by a focus on sustainability and efficiency. The emergence of the electrified powertrain and hybrid-electric combine models is a direct response to tightening emissions regulations and the demand for sustainable farming practices. These systems can improve fuel consumption optimization by up to 25% in certain applications.
- Concurrently, the development of modular harvesting platforms enhances versatility, allowing a single machine to adapt to various crops. This trend, combined with a growing demand for custom harvesting services and agricultural machinery rental options, is changing equipment ownership models.
- The push for data-driven farm management is also significant, with advanced telematics enabling better operational decisions and supporting the monetization of farm data through new service-based business models.
What challenges does the Combine Harvester Industry face during its growth?
- A paramount challenge confronting the market is the exceedingly high capital investment required for new machinery and the subsequent total cost of ownership for agricultural enterprises.
- Significant challenges constrain market growth, primarily related to cost and operational complexity. The prohibitive capital investment and high total cost of ownership create a substantial barrier for many operators, particularly in the small-scale farm solutions sector. These financial pressures have contributed to a 5% annual growth in the agricultural machinery rental market as an alternative to ownership.
- Furthermore, the scarcity of skilled operator training and qualified technicians for after-sales service support can lead to costly downtime. The complexity of modern systems means that reliance on genuine replacement parts is high, adding to maintenance expenses.
- Intensifying environmental regulations also present challenges, demanding investment in cleaner technologies while farmers simultaneously grapple with soil compaction mitigation and issues related to variable terrain harvesting.
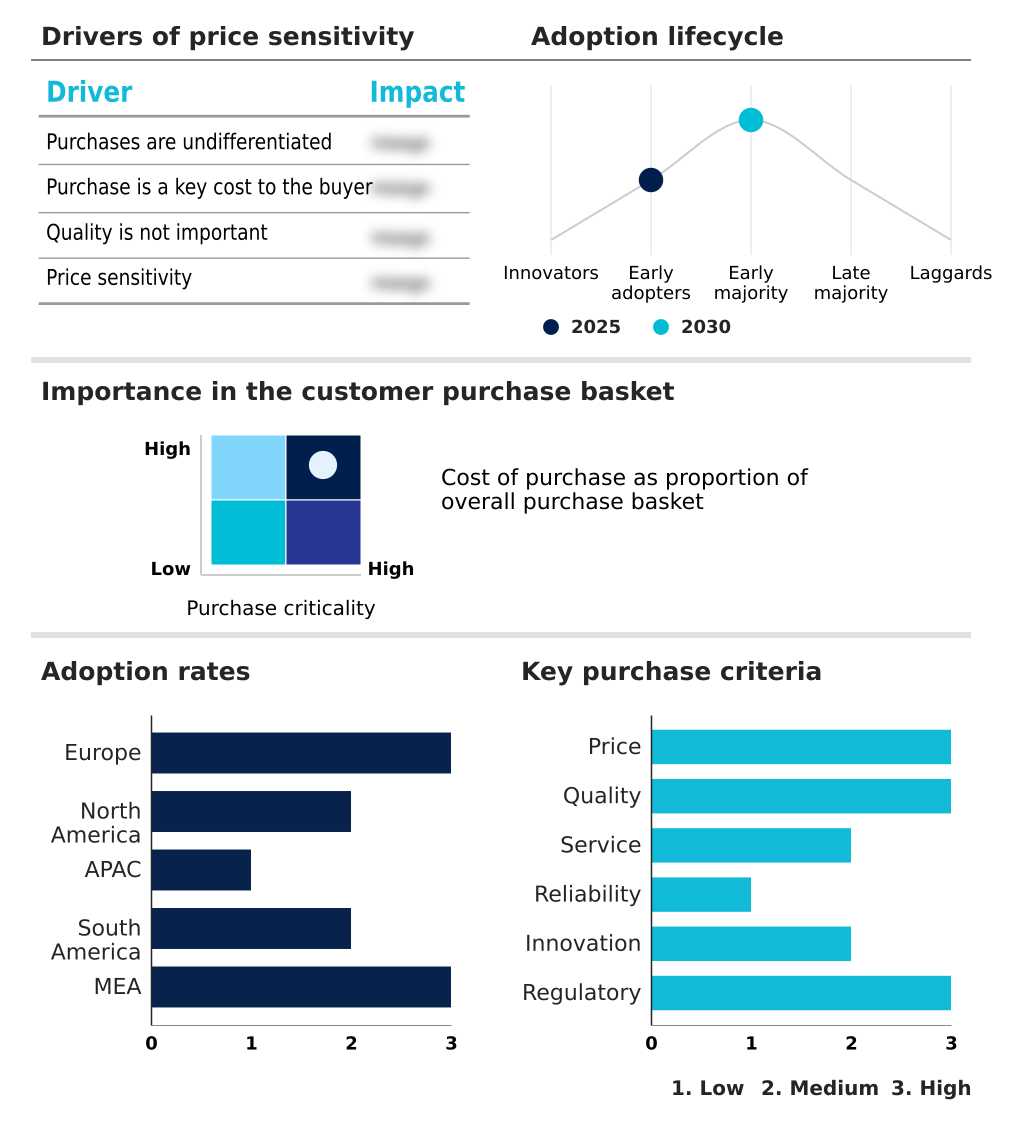
Exclusive Technavio Analysis on Customer Landscape
The combine harvester market forecasting report includes the adoption lifecycle of the market, covering from the innovator’s stage to the laggard’s stage. It focuses on adoption rates in different regions based on penetration. Furthermore, the combine harvester market report also includes key purchase criteria and drivers of price sensitivity to help companies evaluate and develop their market growth analysis strategies.
Customer Landscape of Combine Harvester Industry
Competitive Landscape
Companies are implementing various strategies, such as strategic alliances, combine harvester market forecast, partnerships, mergers and acquisitions, geographical expansion, and product/service launches, to enhance their presence in the industry.
AGCO Corp. - Offerings include technologically advanced combine harvesters, such as the Fendt IDEAL and Gleaner S series, designed for high-efficiency, large-scale agricultural operations.
The industry research and growth report includes detailed analyses of the competitive landscape of the market and information about key companies, including:
- AGCO Corp.
- Beri Udyog Pvt. Ltd.
- CLAAS KGaA
- CNH Industrial N.V.
- Deere and Co.
- ISEKI and Co. Ltd.
- Kartar Agro Industries Pvt Ltd
- KS Agrotech Pvt. Ltd.
- Kubota Corp.
- Mahindra and Mahindra Ltd.
- OJSC Gomselmash
- PREET Group
- Rostselmash
- Sampo-Rosenlew Oy
- SDF SpA
- Weichei Lovol Heavy Industry
- Yanmar Holdings Co. Ltd.
- YTO Co. Ltd
- Zoomlion Industry Co. Ltd.
Qualitative and quantitative analysis of companies has been conducted to help clients understand the wider business environment as well as the strengths and weaknesses of key industry players. Data is qualitatively analyzed to categorize companies as pure play, category-focused, industry-focused, and diversified; it is quantitatively analyzed to categorize companies as dominant, leading, strong, tentative, and weak.
Recent Development and News in Combine harvester market
- In October, 2024, CNH Industrial NV announced a strategic partnership with a leading ag-tech firm to integrate advanced AI-powered crop-sensing technology across its combine harvester lineup, aiming to boost real-time harvesting adjustments and improve grain quality.
- In November, 2024, Kubota Corp. expanded its manufacturing capacity by opening a new production facility in North America focused on mid-sized combine harvesters, designed to better serve the region's diverse farming needs.
- In February, 2025, CLAAS KGaA unveiled its first production series of combines powered by hydrogenated vegetable oil (HVO), a renewable fuel that reduces net carbon emissions, reinforcing its commitment to sustainable agriculture.
- In April, 2025, Deere and Co. launched its model year 2026 combines featuring a predictive ground speed automation system, which uses stereo cameras and satellite data to optimize harvesting efficiency and reduce operator fatigue.
Dive into Technavio’s robust research methodology, blending expert interviews, extensive data synthesis, and validated models for unparalleled Combine Harvester Market insights. See full methodology.
| Market Scope | |
|---|---|
| Page number | 293 |
| Base year | 2025 |
| Historic period | 2020-2024 |
| Forecast period | 2026-2030 |
| Growth momentum & CAGR | Accelerate at a CAGR of 9.8% |
| Market growth 2026-2030 | USD 27483.6 million |
| Market structure | Fragmented |
| YoY growth 2025-2026(%) | 8.6% |
| Key countries | Germany, France, UK, Italy, Spain, The Netherlands, US, Canada, Mexico, China, India, Japan, South Korea, Indonesia, Australia, Brazil, Argentina, Chile, Turkey, Saudi Arabia, South Africa, Egypt and Nigeria |
| Competitive landscape | Leading Companies, Market Positioning of Companies, Competitive Strategies, and Industry Risks |
Research Analyst Overview
- The combine harvester market is fundamentally driven by the need for greater agricultural efficiency. This is achieved through sophisticated machinery that integrates advanced sensor technology and powerful engine power output. The evolution from basic mechanization to precision agriculture integration is clear, with technologies like GPS guidance control and automated yield mapping becoming standard.
- Operator cab ergonomics and hydraulic system efficiency are key areas of product differentiation, directly impacting productivity during long harvesting days. The market offers a range of equipment, from the high-capacity self-propelled combine to the more specialized PTO-powered combine and tractor-pulled harvester.
- Innovations in the grain threshing mechanism, rotary separator technology, and grain cleaning system are critical for minimizing loss and maximizing quality. For instance, fleets utilizing real-time machine diagnostics have demonstrated a reduction in critical in-field failures. The inclusion of a straw chopper unit and chaff spreader system further enhances field management post-harvest.
- As farms grow larger, features like a larger grain tank design and a high-capacity unloading auger system are essential for maintaining continuous operation and achieving combine harvester automation.
What are the Key Data Covered in this Combine Harvester Market Research and Growth Report?
-
What is the expected growth of the Combine Harvester Market between 2026 and 2030?
-
USD 27.48 billion, at a CAGR of 9.8%
-
-
What segmentation does the market report cover?
-
The report is segmented by Product (Self-propelled, Tractor-pulled, and Power take off (PTO)-powered combine harvesters), Type (Wheel type, and Crawler type), Power Output (301 to 450 HP, 151 to 300 HP, Less than 150 HP, and Above 450 HP) and Geography (Europe, North America, APAC, South America, Middle East and Africa)
-
-
Which regions are analyzed in the report?
-
Europe, North America, APAC, South America and Middle East and Africa
-
-
What are the key growth drivers and market challenges?
-
Surging global population and imperative for enhanced food security, Prohibitive capital investment and total cost of ownership
-
-
Who are the major players in the Combine Harvester Market?
-
AGCO Corp., Beri Udyog Pvt. Ltd., CLAAS KGaA, CNH Industrial N.V., Deere and Co., ISEKI and Co. Ltd., Kartar Agro Industries Pvt Ltd, KS Agrotech Pvt. Ltd., Kubota Corp., Mahindra and Mahindra Ltd., OJSC Gomselmash, PREET Group, Rostselmash, Sampo-Rosenlew Oy, SDF SpA, Weichei Lovol Heavy Industry, Yanmar Holdings Co. Ltd., YTO Co. Ltd and Zoomlion Industry Co. Ltd.
-
Market Research Insights
- Market dynamics are increasingly shaped by the pursuit of operational excellence and data-driven farm management. The adoption of advanced technologies delivers tangible business outcomes, with farms using automated systems reporting up to a 15% reduction in grain loss. Similarly, the integration of telematics has been shown to improve equipment uptime maximization by 20% through predictive maintenance.
- This shift toward precision is driven by the need for greater harvesting efficiency and crop quality preservation. As a result, purchasing decisions are less about initial price and more about the total cost of ownership and long-term ROI. The availability of equipment financing solutions and a robust used equipment market further influence investment cycles, making advanced machinery more accessible.
We can help! Our analysts can customize this combine harvester market research report to meet your requirements.
 RIA -
RIA - 
