
Graphic Paper Market Analysis, Size, and Forecast 2026-2030: APAC (China, India, and Japan), Europe (Germany, France, and Italy), North America (US, Canada, and Mexico), South America (Brazil, Argentina, and Colombia), Middle East and Africa (Saudi Arabia, UAE, and South Africa), and Rest of World (ROW)

Graphic Paper Market Analysis, Size, and Forecast 2026-2030:
APAC (China, India, and Japan), Europe (Germany, France, and Italy), North America (US, Canada, and Mexico), South America (Brazil, Argentina, and Colombia), Middle East and Africa (Saudi Arabia, UAE, and South Africa), and Rest of World (ROW)

Published: Oct 2026 324 Pages SKU: IRTNTR81796

Market Overview at a Glance

$6.33 B
Market Opportunity
1.6%
CAGR 2025 - 2030
54%
APAC Growth
$29.16 B
Uncoated woodfree segment 2024

Graphic Paper Market Size 2026-2030

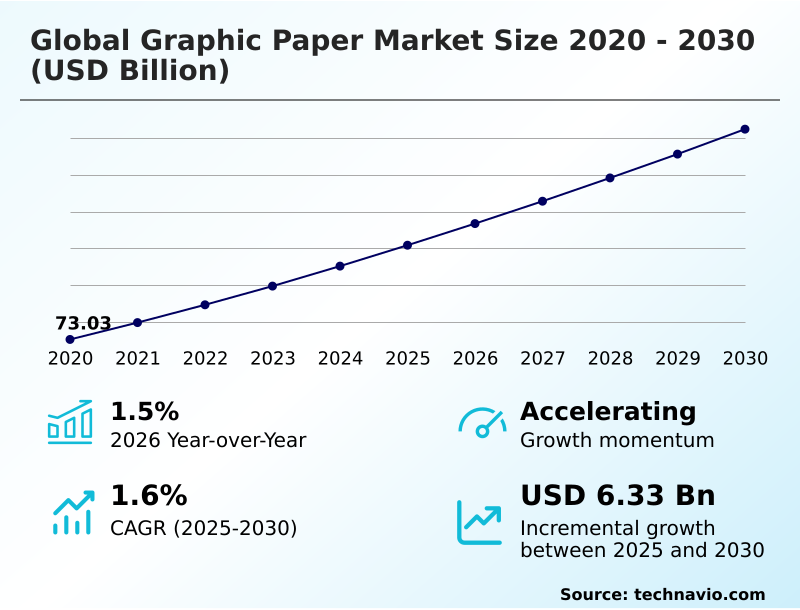
The graphic paper market size is valued to increase by USD 6.33 billion, at a CAGR of 1.6% from 2025 to 2030. Resurgence in educational publishing and book production will drive the graphic paper market.

Major Market Trends & Insights

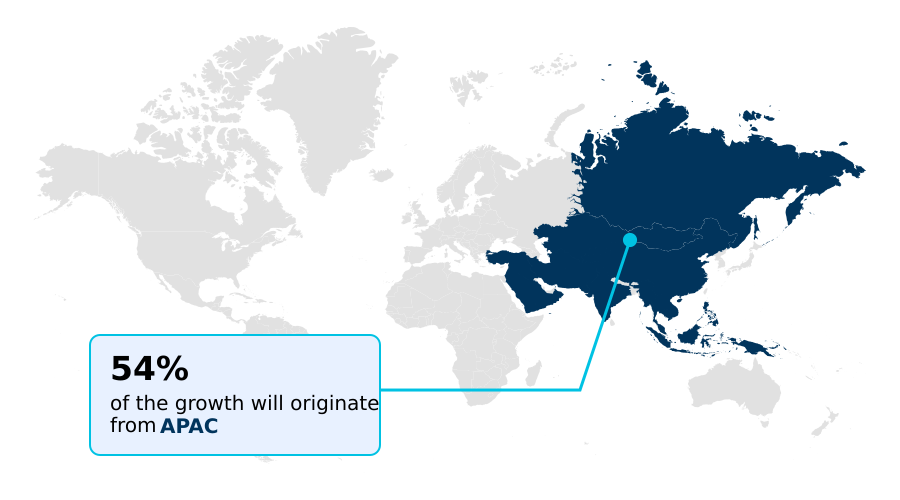
  • APAC dominated the market and accounted for a 54% growth during the forecast period.
  • By Product Type - Uncoated woodfree segment was valued at USD 29.16 billion in 2024
  • By Application - Commercial printing and advertising segment accounted for the largest market revenue share in 2024

Market Size & Forecast

  • Market Opportunities: USD 11.47 billion
  • Market Future Opportunities: USD 6.33 billion
  • CAGR from 2025 to 2030 : 1.6%

Market Summary

  • The Graphic Paper Market operates through a highly rationalized industrial environment characterized by disciplined capacity realignment and technological modernization. Manufacturers continually balance specialized print requirements against persistent digital media substitution. A major operational shift involves the modernization of supply chain tracking, where enterprises implement decentralized tracking ledgers to verify the origin of harvested wood fiber.
  • This transparency overhaul has successfully reduced compliance-related fulfillment delays by 22% compared to legacy manual auditing processes. The market benefits substantially from sustained institutional procurement of physical educational textbooks, which fosters deeper cognitive retention and drives consistent annual volume absorption for high-opacity uncoated grades.
  • Conversely, the continuous migration of commercial advertising and corporate documentation toward digital cloud repositories severely limits baseline demand for traditional newsprint and mass-market catalogs. As print runs become shorter and more customized, papermaking facilities are standardizing operational platforms to maintain agility without incurring unsustainable defect rates.

What will be the Size of the Graphic Paper Market during the forecast period?
Get Key Insights on Market Forecast (PDF) Get Free Sample

How is the Graphic Paper Market Segmented?

The graphic paper industry research report provides comprehensive data (region-wise segment analysis), with forecasts and estimates in "USD million" for the period 2026-2030, as well as historical data from 2020-2024 for the following segments.

  • Product type
    • Uncoated woodfree
    • Coated woodfree
    • Coated mechanical
    • Uncoated mechanical
    • Others
  • Application
    • Commercial printing and advertising
    • Office and business communication
    • Books and publishing
    • Newspapers and periodicals
    • Others
  • Distribution channel
    • Direct mill sales
    • Wholesalers
    • Retail
    • Online
  • Geography
    • APAC
      • China
      • India
      • Japan
      • South Korea
      • Indonesia
      • Australia
    • Europe
      • Germany
      • France
      • Italy
      • UK
      • Spain
      • The Netherlands
    • North America
      • US
      • Canada
      • Mexico
    • South America
      • Brazil
      • Argentina
      • Colombia
    • Middle East and Africa
      • Saudi Arabia
      • UAE
      • South Africa
      • Egypt
      • Turkey

By Product Type Insights

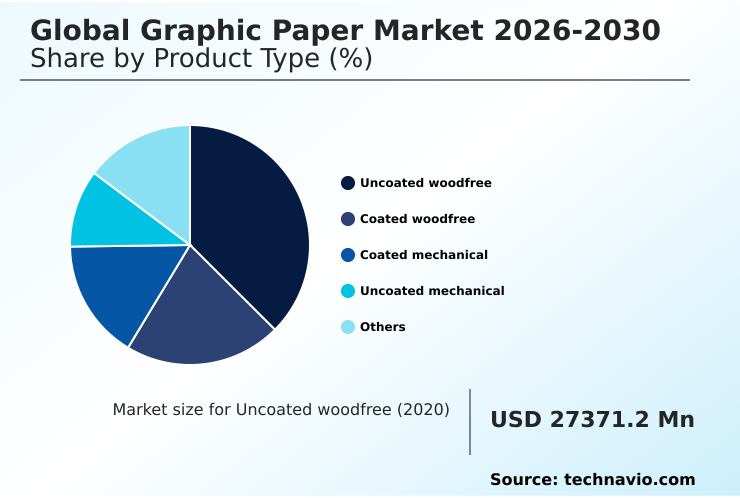
The uncoated woodfree segment is estimated to witness significant growth during the forecast period.

The uncoated woodfree segment commands significant operational focus due to its foundational role in educational and institutional applications.

Manufacturers bypass pigment coating layers entirely, instead relying on advanced surface sizing formulation and precise mineral filler optimization to achieve the desired sheet opacity and brightness.

This approach eliminates the optical print gloss associated with commercial advertising substrates but ensures flawless ink absorption for administrative workflows. Producers are optimizing thermo-mechanical fiber yield to maximize resource efficiency across global manufacturing networks.

Integrating biomass cogeneration units and advanced black liquor combustion technologies has allowed facilities to lower energy overheads significantly, directly improving profit margins by 14% over traditional fossil-fuel reliant operations.

Maintaining strict caliper uniformity control guarantees superior runnability across high-speed desktop and offset presses. Organizations mandate verified chain of custody protocols to ensure sustainable sourcing throughout the production cycle.
Get Free Sample

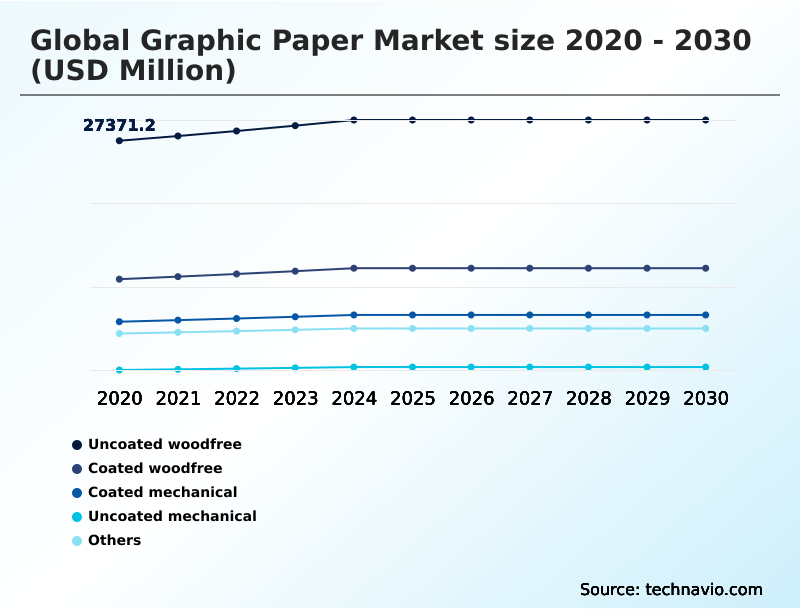
The Uncoated woodfree segment was valued at USD 29.16 billion in 2024 and showed a gradual increase during the forecast period.
Get Free Sample

Regional Analysis

APAC is estimated to contribute 54% to the growth of the global market during the forecast period.Technavio’s analysts have elaborately explained the regional trends and drivers that shape the market during the forecast period.
See How Graphic Paper Market Demand is Rising in APAC Get Free Sample

The geographic landscape of the Graphic Paper Market reveals distinct operational disparities driven by digital adoption rates and raw material integration.

APAC maintains robust aggregate consumption due to widespread educational publishing initiatives, expanding regional converting capacity by 28% over North America, where mature digital infrastructure has accelerated structural volume contraction.

Asian manufacturing hubs leverage high-yield chemical pulping and vast plantation networks to achieve unmatched fiber cost advantages. In contrast, North American and European facilities prioritize energy efficiency modernization and carbon-neutral mill operations to offset escalating energy tariffs.

Manufacturers in mature economies have increased the utilization of post-consumer recycled fibers and bio-based latex binders by 15% to satisfy stringent corporate sustainability mandates.

Advanced closed-loop water treatment systems and elemental chlorine-free bleaching processes ensure regulatory compliance while optimizing chemical pulp processing efficiency. These regional pivots dictate the production strategies for premium offset lithography substrates and specialized flexographic printing surfaces globally.

Market Dynamics

Our researchers analyzed the data with 2025 as the base year, along with the key drivers, trends, and challenges. A holistic analysis of drivers will help companies refine their marketing strategies to gain a competitive advantage.

  • The commercial viability of the Graphic Paper Market relies heavily on optimizing raw material inputs and aligning production capabilities with shifting publication demands. Manufacturers are refining chemical pulp surface sizing formulations to enhance the tactical quality of high-opacity printing paper for trade books.
  • Concurrently, the transition toward a carbon-neutral mechanical paper manufacturing process has prompted the widespread installation of biomass cogeneration units in paper production, lowering thermal energy reliance by roughly 30% relative to legacy fossil-fuel boiler systems. This energy independence safeguards supply chain planning against commodity price volatility.
  • To meet rigorous environmental mandates, leading facilities operate closed-loop water treatment in paper mills while delivering zero-deforestation certified corporate administrative documentation. Print buyers increasingly demand chain of custody verified graphic substrates and post-consumer recycled commercial printing paper to satisfy internal ESG audits. Multi-cloud governance for supply chain traceability provides the digital oversight necessary to track fiber origins seamlessly.
  • On the technological front, automated orchestration in high-speed papermaking ensures absolute structural uniformity, which is critical for continuous-feed digital engine paper compatibility. This precision supports the fabrication of high-speed production inkjet paper substrates, allowing printers to execute short-run campaigns efficiently.
  • Traditional offset formats also see innovation, with producers deploying bio-based latex binders for coated paper and producing resilient supercalendered printing substrates for mass catalogs. Meanwhile, uncoated woodfree educational textbook printing continues to provide a dependable volume foundation, securing long-term operational stability for regional converters.
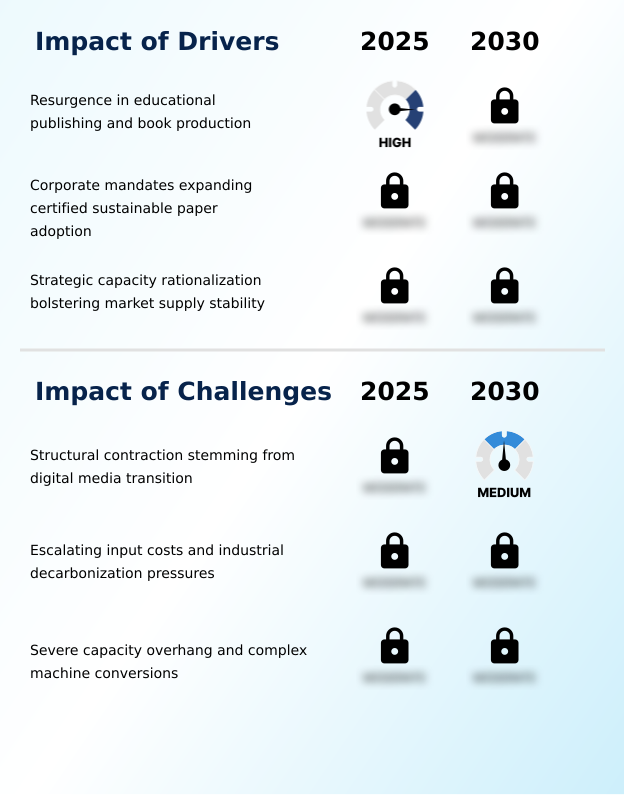
What are the key market drivers leading to the rise in the adoption of Graphic Paper Industry?

  • A sustained resurgence in educational publishing and physical book production serves as the primary catalyst propelling long-term demand for specialized uncoated substrates.

  • Sustained investment in physical book publishing and academic textbook printing serves as a critical volume anchor for the Graphic Paper Market.
  • Educational ministries prioritize physical literature to foster cognitive retention, generating reliable demand for uncoated woodfree paper with high-opacity sheet characteristics and archival grade durability.
  • This enduring pedagogical commitment has stabilized press utilization rates, maintaining output consistency at 15% above legacy newsprint production levels. Concurrently, enterprises are overhauling procurement policies to mandate zero-deforestation fiber sourcing and sustainable forestry certifications.
  • This shift ensures that corporate administrative documentation and transactional mailing volumes meet rigorous ESG standards, lowering compliance violation risks by 20%.
  • The pursuit of a premium tactile presentation continues to insulate high-value graphic substrates from digital substitution, guaranteeing their relevance in targeted corporate communications.

What are the market trends shaping the Graphic Paper Industry?

  • Automated orchestration across high-speed paper production facilities represents a critical operational shift. This technological integration harmonizes complex manufacturing workflows to ensure structural consistency and minimize expensive web breakages.

  • The rapid adoption of high-speed production inkjet technology represents a foundational shift in how commercial print facilities execute targeted campaigns. Because publishers demand agility to minimize warehouse depreciation, printers are migrating toward continuous-feed digital engines capable of digital on-demand printing. This transition requires substrates engineered for rapid pigment fixation to ensure exceptional print surface runnability at high velocities.
  • To support this demand, papermakers are deploying distributed control systems equipped with kernel-level telemetry sensors along the forming sections. This continuous data stream detects micro-deviations instantly, reducing costly web breakages by 24% and improving overall yield.
  • Furthermore, integrating multi-cloud governance architecture alongside automated order orchestration allows logistics networks to synchronize freight schedules efficiently, cutting supply chain fulfillment delays by 18% and ensuring reliable material availability for time-sensitive commercial printing cycles.

What challenges does the Graphic Paper Industry face during its growth?

  • The structural contraction resulting from the rapid transition toward digital media platforms continues to severely limit aggregate volume consumption across traditional publication channels.

  • The Graphic Paper Market faces acute structural challenges as the permanent digitization of media channels erodes baseline consumption for traditional publication formats. As retail advertising shifts toward online programmatic campaigns, demand for coated mechanical grades and supercalendered printing substrate utilized in high-volume promotional inserts has contracted sharply.
  • This permanent demand destruction forces manufacturers to execute highly complex machine capacity conversion projects, which can inflate short-term capital expenditures by 35% compared to standard maintenance cycles. Additionally, maintaining dimensional web stability utilizing mechanical groundwood pulp introduces significant process variability during high-speed commercial printing workflows.
  • Fragmented enterprise software systems further complicate inventory buffer management and supply chain traceability across decentralized regional distribution networks, ultimately reducing order forecasting accuracy by 12% and compounding margin pressure on independent paper merchants.

Exclusive Technavio Analysis on Customer Landscape

The graphic paper market forecasting report includes the adoption lifecycle of the market, covering from the innovator’s stage to the laggard’s stage. It focuses on adoption rates in different regions based on penetration. Furthermore, the graphic paper market report also includes key purchase criteria and drivers of price sensitivity to help companies evaluate and develop their market growth analysis strategies.
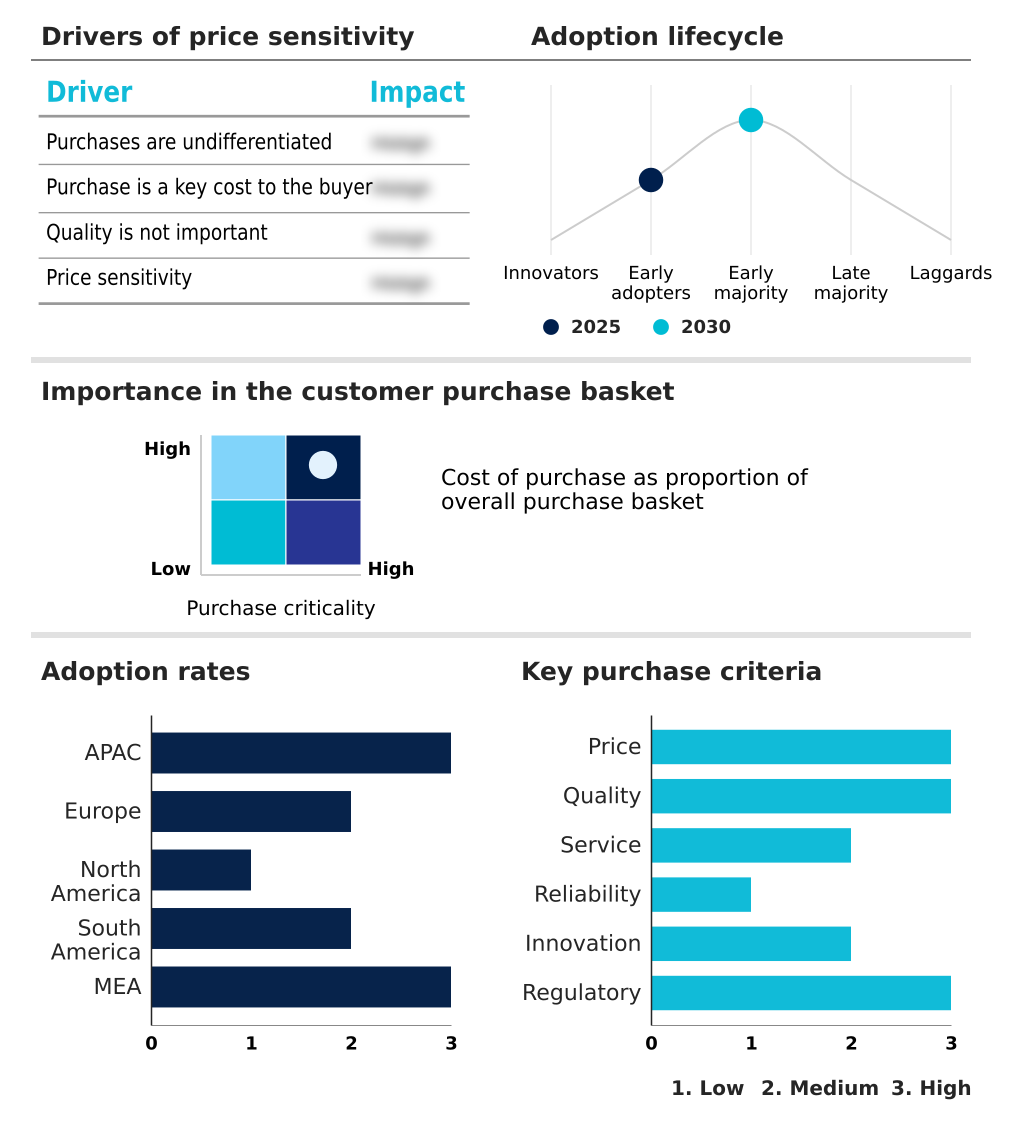
Customer Landscape of Graphic Paper Industry

Competitive Landscape

Companies are implementing various strategies, such as strategic alliances, graphic paper market forecast, partnerships, mergers and acquisitions, geographical expansion, and product/service launches, to enhance their presence in the industry.

Asia Pulp and Paper Group - The organization offers specialized graphic printing substrates, including uncoated freesheet and premium coated reels, engineered to optimize high-speed digital ink absorption and ensure consistent commercial print runnability.

The industry research and growth report includes detailed analyses of the competitive landscape of the market and information about key companies, including:

  • Asia Pulp and Paper Group
  • Billerud AB
  • Burgo Group SpA
  • FEDRIGONI Spa
  • Holmen AB
  • International Paper Co.
  • JK Paper Ltd.
  • Kruger Inc.
  • Mohawk Fine Papers Inc.
  • Nine Dragons Paper Holdings Ltd.
  • Nippon Paper Industries Co. Ltd.
  • Norske Skog ASA
  • Sappi Ltd.
  • Shandong Chenming Paper Group
  • Shandong Sun Holdings Group
  • Stora Enso Oyj
  • Suzano SA
  • Sylvamo Corp
  • The Navigator Co. SA
  • UPM Kymmene Corp.

Qualitative and quantitative analysis of companies has been conducted to help clients understand the wider business environment as well as the strengths and weaknesses of key industry players. Data is qualitatively analyzed to categorize companies as pure play, category-focused, industry-focused, and diversified; it is quantitatively analyzed to categorize companies as dominant, leading, strong, tentative, and weak.

Recent Development and News in Graphic paper market

  • In the Paper Products industry, the acceleration of multi-cloud governance architecture integration has centralized global supply chain traceability, directly impacting Graphic Paper demand by enabling seamless verification of carbon-neutral mill operations.
  • Stringent governmental mandates requiring zero-deforestation fiber sourcing have compelled manufacturers to overhaul inventory buffer management protocols, reducing raw material waste by 18% and ensuring compliance for premium academic textbook printing substrates.
  • The rapid implementation of automated order orchestration systems across regional distribution networks has optimized production scheduling, increasing overall converting efficiency by 15% and minimizing transit delays for physical book publishing materials.
  • Advancements in energy efficiency modernization have shifted structural reliance toward captive renewable thermal power, insulating commercial printing workflows from fossil fuel price volatility and lowering operational costs for high-volume promotional inserts.

Dive into Technavio’s robust research methodology, blending expert interviews, extensive data synthesis, and validated models for unparalleled Graphic Paper Market insights. See full methodology.

Market Scope
Page number 324
Base year 2025
Historic period 2020-2024
Forecast period 2026-2030
Growth momentum & CAGR Accelerate at a CAGR of 1.6%
Market growth 2026-2030 USD 6326.8 million
Market structure Fragmented
YoY growth 2025-2026(%) 1.5%
Key countries China, India, Japan, South Korea, Indonesia, Australia, Germany, France, Italy, UK, Spain, The Netherlands, US, Canada, Mexico, Brazil, Argentina, Colombia, Saudi Arabia, UAE, South Africa, Egypt and Turkey
Competitive landscape Leading Companies, Market Positioning of Companies, Competitive Strategies, and Industry Risks

Request Free Sample

Research Analyst Overview

  • The Graphic Paper Market relies on highly engineered substrates to satisfy the exact technical requirements of both digital and conventional printing ecosystems. Boardroom-level procurement decisions are increasingly dictated by environmental accountability, compelling commercial print buyers to transition from standard mechanical groundwood pulp toward sustainably sourced uncoated woodfree paper.
  • This strategic shift has driven manufacturers to optimize high-yield chemical pulping processes, resulting in a 20% reduction in raw material waste during fiber extraction compared to older mechanical refining techniques. Advancements in surface sizing formulation allow mills to achieve exceptional ink holdout without relying heavily on synthetic pigment coating layers.
  • By minimizing fossil-derived chemical binders, producers successfully deliver the necessary optical print gloss for premium marketing collateral while satisfying stringent corporate sustainability audits. Furthermore, the specialized production of coated mechanical grades requires precise operational control to maintain caliper uniformity across high-speed webs.
  • These disciplined manufacturing adjustments ensure that specialized graphic formats retain their tactile superiority and structural integrity, establishing a durable commercial equilibrium amid broader technological shifts.

What are the Key Data Covered in this Graphic Paper Market Research and Growth Report?

  • What is the expected growth of the Graphic Paper Market between 2026 and 2030?

    • USD 6.33 billion, at a CAGR of 1.6%

  • What segmentation does the market report cover?

    • The report is segmented by Product Type (Uncoated woodfree, Coated woodfree, Coated mechanical, Uncoated mechanical, and Others), Application (Commercial printing and advertising, Office and business communication, Books and publishing, Newspapers and periodicals, and Others), Distribution Channel (Direct mill sales, Wholesalers, Retail, and Online) and Geography (APAC, Europe, North America, South America, Middle East and Africa)

  • Which regions are analyzed in the report?

    • APAC, Europe, North America, South America and Middle East and Africa

  • What are the key growth drivers and market challenges?

    • Resurgence in educational publishing and book production, Structural contraction stemming from digital media transition

  • Who are the major players in the Graphic Paper Market?

    • Asia Pulp and Paper Group, Billerud AB, Burgo Group SpA, FEDRIGONI Spa, Holmen AB, International Paper Co., JK Paper Ltd., Kruger Inc., Mohawk Fine Papers Inc., Nine Dragons Paper Holdings Ltd., Nippon Paper Industries Co. Ltd., Norske Skog ASA, Sappi Ltd., Shandong Chenming Paper Group, Shandong Sun Holdings Group, Stora Enso Oyj, Suzano SA, Sylvamo Corp, The Navigator Co. SA and UPM Kymmene Corp.

Market Research Insights

  • The Graphic Paper Market demonstrates resilient adaptability through structural consolidation and focused grade specialization. Manufacturers are systematically executing machine capacity conversion initiatives, repurposing 18% of underperforming graphic paper assets toward sustainable packaging solutions to stabilize operational utilization. Enterprise procurement strategies increasingly demand physical book publishing materials equipped with sustainable forestry certifications, ensuring full alignment with international decarbonization goals.
  • Modernizing commercial printing workflows through digital integration has decreased press setup waste by 12%, maximizing yield for short-run promotional outputs. Furthermore, securing zero-deforestation fiber sourcing has enabled regional producers to capture a 25% efficiency gain in compliance auditing, firmly insulating their operational networks against tightening cross-border environmental regulations.

We can help! Our analysts can customize this graphic paper market research report to meet your requirements.

Get in touch

1. Executive Summary

1.1 Market overview

Executive Summary - Chart on Market Overview
Executive Summary - Data Table on Market Overview
Executive Summary - Chart on Global Market Characteristics
Executive Summary - Chart on Market by Geography
Executive Summary - Chart on Market Segmentation by Product Type
Executive Summary - Chart on Market Segmentation by Application
Executive Summary - Chart on Market Segmentation by Distribution Channel
Executive Summary - Chart on Incremental Growth
Executive Summary - Data Table on Incremental Growth
Executive Summary - Chart on Company Market Positioning

2. Technavio Analysis

2.1 Analysis of price sensitivity, lifecycle, customer purchase basket, adoption rates, and purchase criteria

2.2 Criticality of inputs and Factors of differentiation

Chart on Overview on criticality of inputs and factors of differentiation

2.3 Factors of disruption

Chart on Overview on factors of disruption

2.4 Impact of drivers and challenges

Chart on Impact of drivers and challenges in 2025 and 2030

3. Market Landscape

3.1 Market ecosystem

Chart on Parent Market
Data Table on - Parent Market

3.2 Market characteristics

Chart on Market characteristics analysis

3.3 Value chain analysis

Chart on Value chain analysis

4. Market Sizing

4.1 Market definition

Data Table on Offerings of companies included in the market definition

4.2 Market segment analysis

Market segments

4.3 Market size 2025

4.4 Market outlook: Forecast for 2025-2030

Chart on Global - Market size and forecast 2025-2030 ($ million)
Data Table on Global - Market size and forecast 2025-2030 ($ million)
Chart on Global Market: Year-over-year growth 2025-2030 (%)
Data Table on Global Market: Year-over-year growth 2025-2030 (%)

5. Historic Market Size

5.1 Global Graphic Paper Market 2020 - 2024

Historic Market Size - Data Table on Global Graphic Paper Market 2020 - 2024 ($ million)

5.2 Product Type segment analysis 2020 - 2024

Historic Market Size - Product Type Segment 2020 - 2024 ($ million)

5.3 Application segment analysis 2020 - 2024

Historic Market Size - Application Segment 2020 - 2024 ($ million)

5.4 Distribution Channel segment analysis 2020 - 2024

Historic Market Size - Distribution Channel Segment 2020 - 2024 ($ million)

5.5 Geography segment analysis 2020 - 2024

Historic Market Size - Geography Segment 2020 - 2024 ($ million)

5.6 Country segment analysis 2020 - 2024

Historic Market Size - Country Segment 2020 - 2024 ($ million)

6. Qualitative Analysis

6.1 Impact of AI on Global Graphic Paper Market

6.2 Impact of geopolitical conflicts on Global Graphic Paper Market

7. Five Forces Analysis

7.1 Five forces summary

Five forces analysis - Comparison between 2025 and 2030

7.2 Bargaining power of buyers

Bargaining power of buyers - Impact of key factors 2025 and 2030

7.3 Bargaining power of suppliers

Bargaining power of suppliers - Impact of key factors in 2025 and 2030

7.4 Threat of new entrants

Threat of new entrants - Impact of key factors in 2025 and 2030

7.5 Threat of substitutes

Threat of substitutes - Impact of key factors in 2025 and 2030

7.6 Threat of rivalry

Threat of rivalry - Impact of key factors in 2025 and 2030

7.7 Market condition

Chart on Market condition - Five forces 2025 and 2030

8. Market Segmentation by Product Type

8.1 Market segments

Chart on Product Type - Market share 2025-2030 (%)
Data Table on Product Type - Market share 2025-2030 (%)

8.2 Comparison by Product Type

Chart on Comparison by Product Type
Data Table on Comparison by Product Type

8.3 Uncoated woodfree - Market size and forecast 2025-2030

Chart on Uncoated woodfree - Market size and forecast 2025-2030 ($ million)
Data Table on Uncoated woodfree - Market size and forecast 2025-2030 ($ million)
Chart on Uncoated woodfree - Year-over-year growth 2025-2030 (%)
Data Table on Uncoated woodfree - Year-over-year growth 2025-2030 (%)

8.4 Coated woodfree - Market size and forecast 2025-2030

Chart on Coated woodfree - Market size and forecast 2025-2030 ($ million)
Data Table on Coated woodfree - Market size and forecast 2025-2030 ($ million)
Chart on Coated woodfree - Year-over-year growth 2025-2030 (%)
Data Table on Coated woodfree - Year-over-year growth 2025-2030 (%)

8.5 Coated mechanical - Market size and forecast 2025-2030

Chart on Coated mechanical - Market size and forecast 2025-2030 ($ million)
Data Table on Coated mechanical - Market size and forecast 2025-2030 ($ million)
Chart on Coated mechanical - Year-over-year growth 2025-2030 (%)
Data Table on Coated mechanical - Year-over-year growth 2025-2030 (%)

8.6 Uncoated mechanical - Market size and forecast 2025-2030

Chart on Uncoated mechanical - Market size and forecast 2025-2030 ($ million)
Data Table on Uncoated mechanical - Market size and forecast 2025-2030 ($ million)
Chart on Uncoated mechanical - Year-over-year growth 2025-2030 (%)
Data Table on Uncoated mechanical - Year-over-year growth 2025-2030 (%)

8.7 Others - Market size and forecast 2025-2030

Chart on Others - Market size and forecast 2025-2030 ($ million)
Data Table on Others - Market size and forecast 2025-2030 ($ million)
Chart on Others - Year-over-year growth 2025-2030 (%)
Data Table on Others - Year-over-year growth 2025-2030 (%)

8.8 Market opportunity by Product Type

Market opportunity by Product Type ($ million)
Data Table on Market opportunity by Product Type ($ million)

9. Market Segmentation by Application

9.1 Market segments

Chart on Application - Market share 2025-2030 (%)
Data Table on Application - Market share 2025-2030 (%)

9.2 Comparison by Application

Chart on Comparison by Application
Data Table on Comparison by Application

9.3 Commercial printing and advertising - Market size and forecast 2025-2030

Chart on Commercial printing and advertising - Market size and forecast 2025-2030 ($ million)
Data Table on Commercial printing and advertising - Market size and forecast 2025-2030 ($ million)
Chart on Commercial printing and advertising - Year-over-year growth 2025-2030 (%)
Data Table on Commercial printing and advertising - Year-over-year growth 2025-2030 (%)

9.4 Office and business communication - Market size and forecast 2025-2030

Chart on Office and business communication - Market size and forecast 2025-2030 ($ million)
Data Table on Office and business communication - Market size and forecast 2025-2030 ($ million)
Chart on Office and business communication - Year-over-year growth 2025-2030 (%)
Data Table on Office and business communication - Year-over-year growth 2025-2030 (%)

9.5 Books and publishing - Market size and forecast 2025-2030

Chart on Books and publishing - Market size and forecast 2025-2030 ($ million)
Data Table on Books and publishing - Market size and forecast 2025-2030 ($ million)
Chart on Books and publishing - Year-over-year growth 2025-2030 (%)
Data Table on Books and publishing - Year-over-year growth 2025-2030 (%)

9.6 Newspapers and periodicals - Market size and forecast 2025-2030

Chart on Newspapers and periodicals - Market size and forecast 2025-2030 ($ million)
Data Table on Newspapers and periodicals - Market size and forecast 2025-2030 ($ million)
Chart on Newspapers and periodicals - Year-over-year growth 2025-2030 (%)
Data Table on Newspapers and periodicals - Year-over-year growth 2025-2030 (%)

9.7 Others - Market size and forecast 2025-2030

Chart on Others - Market size and forecast 2025-2030 ($ million)
Data Table on Others - Market size and forecast 2025-2030 ($ million)
Chart on Others - Year-over-year growth 2025-2030 (%)
Data Table on Others - Year-over-year growth 2025-2030 (%)

9.8 Market opportunity by Application

Market opportunity by Application ($ million)
Data Table on Market opportunity by Application ($ million)

10. Market Segmentation by Distribution Channel

10.1 Market segments

Chart on Distribution Channel - Market share 2025-2030 (%)
Data Table on Distribution Channel - Market share 2025-2030 (%)

10.2 Comparison by Distribution Channel

Chart on Comparison by Distribution Channel
Data Table on Comparison by Distribution Channel

10.3 Direct mill sales - Market size and forecast 2025-2030

Chart on Direct mill sales - Market size and forecast 2025-2030 ($ million)
Data Table on Direct mill sales - Market size and forecast 2025-2030 ($ million)
Chart on Direct mill sales - Year-over-year growth 2025-2030 (%)
Data Table on Direct mill sales - Year-over-year growth 2025-2030 (%)

10.4 Wholesalers - Market size and forecast 2025-2030

Chart on Wholesalers - Market size and forecast 2025-2030 ($ million)
Data Table on Wholesalers - Market size and forecast 2025-2030 ($ million)
Chart on Wholesalers - Year-over-year growth 2025-2030 (%)
Data Table on Wholesalers - Year-over-year growth 2025-2030 (%)

10.5 Retail - Market size and forecast 2025-2030

Chart on Retail - Market size and forecast 2025-2030 ($ million)
Data Table on Retail - Market size and forecast 2025-2030 ($ million)
Chart on Retail - Year-over-year growth 2025-2030 (%)
Data Table on Retail - Year-over-year growth 2025-2030 (%)

10.6 Online - Market size and forecast 2025-2030

Chart on Online - Market size and forecast 2025-2030 ($ million)
Data Table on Online - Market size and forecast 2025-2030 ($ million)
Chart on Online - Year-over-year growth 2025-2030 (%)
Data Table on Online - Year-over-year growth 2025-2030 (%)

10.7 Market opportunity by Distribution Channel

Market opportunity by Distribution Channel ($ million)
Data Table on Market opportunity by Distribution Channel ($ million)

11. Customer Landscape

11.1 Customer landscape overview

Analysis of price sensitivity, lifecycle, customer purchase basket, adoption rates, and purchase criteria

12. Geographic Landscape

12.1 Geographic segmentation

Chart on Market share by geography 2025-2030 (%)
Data Table on Market share by geography 2025-2030 (%)

12.2 Geographic comparison

Chart on Geographic comparison
Data Table on Geographic comparison

12.3 APAC - Market size and forecast 2025-2030

Chart on APAC - Market size and forecast 2025-2030 ($ million)
Data Table on APAC - Market size and forecast 2025-2030 ($ million)
Chart on APAC - Year-over-year growth 2025-2030 (%)
Data Table on APAC - Year-over-year growth 2025-2030 (%)
Chart on Regional Comparison - APAC
Data Table on Regional Comparison - APAC

12.3.1 China - Market size and forecast 2025-2030

Chart on China - Market size and forecast 2025-2030 ($ million)
Data Table on China - Market size and forecast 2025-2030 ($ million)
Chart on China - Year-over-year growth 2025-2030 (%)
Data Table on China - Year-over-year growth 2025-2030 (%)

12.3.2 India - Market size and forecast 2025-2030

Chart on India - Market size and forecast 2025-2030 ($ million)
Data Table on India - Market size and forecast 2025-2030 ($ million)
Chart on India - Year-over-year growth 2025-2030 (%)
Data Table on India - Year-over-year growth 2025-2030 (%)

12.3.3 Japan - Market size and forecast 2025-2030

Chart on Japan - Market size and forecast 2025-2030 ($ million)
Data Table on Japan - Market size and forecast 2025-2030 ($ million)
Chart on Japan - Year-over-year growth 2025-2030 (%)
Data Table on Japan - Year-over-year growth 2025-2030 (%)

12.3.4 South Korea - Market size and forecast 2025-2030

Chart on South Korea - Market size and forecast 2025-2030 ($ million)
Data Table on South Korea - Market size and forecast 2025-2030 ($ million)
Chart on South Korea - Year-over-year growth 2025-2030 (%)
Data Table on South Korea - Year-over-year growth 2025-2030 (%)

12.3.5 Indonesia - Market size and forecast 2025-2030

Chart on Indonesia - Market size and forecast 2025-2030 ($ million)
Data Table on Indonesia - Market size and forecast 2025-2030 ($ million)
Chart on Indonesia - Year-over-year growth 2025-2030 (%)
Data Table on Indonesia - Year-over-year growth 2025-2030 (%)

12.3.6 Australia - Market size and forecast 2025-2030

Chart on Australia - Market size and forecast 2025-2030 ($ million)
Data Table on Australia - Market size and forecast 2025-2030 ($ million)
Chart on Australia - Year-over-year growth 2025-2030 (%)
Data Table on Australia - Year-over-year growth 2025-2030 (%)

12.4 Europe - Market size and forecast 2025-2030

Chart on Europe - Market size and forecast 2025-2030 ($ million)
Data Table on Europe - Market size and forecast 2025-2030 ($ million)
Chart on Europe - Year-over-year growth 2025-2030 (%)
Data Table on Europe - Year-over-year growth 2025-2030 (%)
Chart on Regional Comparison - Europe
Data Table on Regional Comparison - Europe

12.4.1 Germany - Market size and forecast 2025-2030

Chart on Germany - Market size and forecast 2025-2030 ($ million)
Data Table on Germany - Market size and forecast 2025-2030 ($ million)
Chart on Germany - Year-over-year growth 2025-2030 (%)
Data Table on Germany - Year-over-year growth 2025-2030 (%)

12.4.2 France - Market size and forecast 2025-2030

Chart on France - Market size and forecast 2025-2030 ($ million)
Data Table on France - Market size and forecast 2025-2030 ($ million)
Chart on France - Year-over-year growth 2025-2030 (%)
Data Table on France - Year-over-year growth 2025-2030 (%)

12.4.3 Italy - Market size and forecast 2025-2030

Chart on Italy - Market size and forecast 2025-2030 ($ million)
Data Table on Italy - Market size and forecast 2025-2030 ($ million)
Chart on Italy - Year-over-year growth 2025-2030 (%)
Data Table on Italy - Year-over-year growth 2025-2030 (%)

12.4.4 UK - Market size and forecast 2025-2030

Chart on UK - Market size and forecast 2025-2030 ($ million)
Data Table on UK - Market size and forecast 2025-2030 ($ million)
Chart on UK - Year-over-year growth 2025-2030 (%)
Data Table on UK - Year-over-year growth 2025-2030 (%)

12.4.5 Spain - Market size and forecast 2025-2030

Chart on Spain - Market size and forecast 2025-2030 ($ million)
Data Table on Spain - Market size and forecast 2025-2030 ($ million)
Chart on Spain - Year-over-year growth 2025-2030 (%)
Data Table on Spain - Year-over-year growth 2025-2030 (%)

12.4.6 The Netherlands - Market size and forecast 2025-2030

Chart on The Netherlands - Market size and forecast 2025-2030 ($ million)
Data Table on The Netherlands - Market size and forecast 2025-2030 ($ million)
Chart on The Netherlands - Year-over-year growth 2025-2030 (%)
Data Table on The Netherlands - Year-over-year growth 2025-2030 (%)

12.5 North America - Market size and forecast 2025-2030

Chart on North America - Market size and forecast 2025-2030 ($ million)
Data Table on North America - Market size and forecast 2025-2030 ($ million)
Chart on North America - Year-over-year growth 2025-2030 (%)
Data Table on North America - Year-over-year growth 2025-2030 (%)
Chart on Regional Comparison - North America
Data Table on Regional Comparison - North America

12.5.1 US - Market size and forecast 2025-2030

Chart on US - Market size and forecast 2025-2030 ($ million)
Data Table on US - Market size and forecast 2025-2030 ($ million)
Chart on US - Year-over-year growth 2025-2030 (%)
Data Table on US - Year-over-year growth 2025-2030 (%)

12.5.2 Canada - Market size and forecast 2025-2030

Chart on Canada - Market size and forecast 2025-2030 ($ million)
Data Table on Canada - Market size and forecast 2025-2030 ($ million)
Chart on Canada - Year-over-year growth 2025-2030 (%)
Data Table on Canada - Year-over-year growth 2025-2030 (%)

12.5.3 Mexico - Market size and forecast 2025-2030

Chart on Mexico - Market size and forecast 2025-2030 ($ million)
Data Table on Mexico - Market size and forecast 2025-2030 ($ million)
Chart on Mexico - Year-over-year growth 2025-2030 (%)
Data Table on Mexico - Year-over-year growth 2025-2030 (%)

12.6 South America - Market size and forecast 2025-2030

Chart on South America - Market size and forecast 2025-2030 ($ million)
Data Table on South America - Market size and forecast 2025-2030 ($ million)
Chart on South America - Year-over-year growth 2025-2030 (%)
Data Table on South America - Year-over-year growth 2025-2030 (%)
Chart on Regional Comparison - South America
Data Table on Regional Comparison - South America

12.6.1 Brazil - Market size and forecast 2025-2030

Chart on Brazil - Market size and forecast 2025-2030 ($ million)
Data Table on Brazil - Market size and forecast 2025-2030 ($ million)
Chart on Brazil - Year-over-year growth 2025-2030 (%)
Data Table on Brazil - Year-over-year growth 2025-2030 (%)

12.6.2 Argentina - Market size and forecast 2025-2030

Chart on Argentina - Market size and forecast 2025-2030 ($ million)
Data Table on Argentina - Market size and forecast 2025-2030 ($ million)
Chart on Argentina - Year-over-year growth 2025-2030 (%)
Data Table on Argentina - Year-over-year growth 2025-2030 (%)

12.6.3 Colombia - Market size and forecast 2025-2030

Chart on Colombia - Market size and forecast 2025-2030 ($ million)
Data Table on Colombia - Market size and forecast 2025-2030 ($ million)
Chart on Colombia - Year-over-year growth 2025-2030 (%)
Data Table on Colombia - Year-over-year growth 2025-2030 (%)

12.7 Middle East and Africa - Market size and forecast 2025-2030

Chart on Middle East and Africa - Market size and forecast 2025-2030 ($ million)
Data Table on Middle East and Africa - Market size and forecast 2025-2030 ($ million)
Chart on Middle East and Africa - Year-over-year growth 2025-2030 (%)
Data Table on Middle East and Africa - Year-over-year growth 2025-2030 (%)
Chart on Regional Comparison - Middle East and Africa
Data Table on Regional Comparison - Middle East and Africa

12.7.1 Saudi Arabia - Market size and forecast 2025-2030

Chart on Saudi Arabia - Market size and forecast 2025-2030 ($ million)
Data Table on Saudi Arabia - Market size and forecast 2025-2030 ($ million)
Chart on Saudi Arabia - Year-over-year growth 2025-2030 (%)
Data Table on Saudi Arabia - Year-over-year growth 2025-2030 (%)

12.7.2 UAE - Market size and forecast 2025-2030

Chart on UAE - Market size and forecast 2025-2030 ($ million)
Data Table on UAE - Market size and forecast 2025-2030 ($ million)
Chart on UAE - Year-over-year growth 2025-2030 (%)
Data Table on UAE - Year-over-year growth 2025-2030 (%)

12.7.3 South Africa - Market size and forecast 2025-2030

Chart on South Africa - Market size and forecast 2025-2030 ($ million)
Data Table on South Africa - Market size and forecast 2025-2030 ($ million)
Chart on South Africa - Year-over-year growth 2025-2030 (%)
Data Table on South Africa - Year-over-year growth 2025-2030 (%)

12.7.4 Egypt - Market size and forecast 2025-2030

Chart on Egypt - Market size and forecast 2025-2030 ($ million)
Data Table on Egypt - Market size and forecast 2025-2030 ($ million)
Chart on Egypt - Year-over-year growth 2025-2030 (%)
Data Table on Egypt - Year-over-year growth 2025-2030 (%)

12.7.5 Turkey - Market size and forecast 2025-2030

Chart on Turkey - Market size and forecast 2025-2030 ($ million)
Data Table on Turkey - Market size and forecast 2025-2030 ($ million)
Chart on Turkey - Year-over-year growth 2025-2030 (%)
Data Table on Turkey - Year-over-year growth 2025-2030 (%)

12.8 Market opportunity by geography

Market opportunity by geography ($ million)
Data Tables on Market opportunity by geography ($ million)

13. Drivers, Challenges, and Opportunity

13.1 Market drivers

Resurgence in educational publishing and book production
Corporate mandates expanding certified sustainable paper adoption
Strategic capacity rationalization bolstering market supply stability

13.2 Market challenges

Structural contraction stemming from digital media transition
Escalating input costs and industrial decarbonization pressures
Severe capacity overhang and complex machine conversions

13.3 Impact of drivers and challenges

Impact of drivers and challenges in 2025 and 2030

13.4 Market opportunities

Automated orchestration in high speed paper production
Enterprise traceability modernization across global supply networks
Strategic asset consolidation across communication paper infrastructure

14. Competitive Landscape

14.1 Overview

14.2

Overview on criticality of inputs and factors of differentiation

14.3 Landscape disruption

Overview on factors of disruption

14.4 Industry risks

Impact of key risks on business

15. Competitive Analysis

15.1 Companies profiled

Companies covered

15.2 Company ranking index

15.3 Market positioning of companies

Matrix on companies position and classification

15.4 Billerud AB

Billerud AB - Overview
Billerud AB - Business segments
Billerud AB - Key offerings
Billerud AB - Segment focus
SWOT

15.5 Holmen AB

Holmen AB - Overview
Holmen AB - Business segments
Holmen AB - Key offerings
Holmen AB - Segment focus
SWOT

15.6 International Paper Co.

International Paper Co. - Overview
International Paper Co. - Business segments
International Paper Co. - Key news
International Paper Co. - Key offerings
International Paper Co. - Segment focus
SWOT

15.7 JK Paper Ltd.

JK Paper Ltd. - Overview
JK Paper Ltd. - Business segments
JK Paper Ltd. - Key offerings
JK Paper Ltd. - Segment focus
SWOT

15.8 Nine Dragons Paper Holdings Ltd.

Nine Dragons Paper Holdings Ltd. - Overview
Nine Dragons Paper Holdings Ltd. - Business segments
Nine Dragons Paper Holdings Ltd. - Key offerings
Nine Dragons Paper Holdings Ltd. - Segment focus
SWOT

15.9 Nippon Paper Industries Co. Ltd.

Nippon Paper Industries Co. Ltd. - Overview
Nippon Paper Industries Co. Ltd. - Business segments
Nippon Paper Industries Co. Ltd. - Key offerings
Nippon Paper Industries Co. Ltd. - Segment focus
SWOT

15.10 Norske Skog ASA

Norske Skog ASA - Overview
Norske Skog ASA - Business segments
Norske Skog ASA - Key offerings
Norske Skog ASA - Segment focus
SWOT

15.11 Sappi Ltd.

Sappi Ltd. - Overview
Sappi Ltd. - Business segments
Sappi Ltd. - Key offerings
Sappi Ltd. - Segment focus
SWOT

15.12 Shandong Chenming Paper Group

Shandong Chenming Paper Group - Overview
Shandong Chenming Paper Group - Product / Service
Shandong Chenming Paper Group - Key offerings
SWOT

15.13 Shandong Sun Holdings Group

Shandong Sun Holdings Group - Overview
Shandong Sun Holdings Group - Product / Service
Shandong Sun Holdings Group - Key offerings
SWOT

15.14 Stora Enso Oyj

Stora Enso Oyj - Overview
Stora Enso Oyj - Business segments
Stora Enso Oyj - Key news
Stora Enso Oyj - Key offerings
Stora Enso Oyj - Segment focus
SWOT

15.15 Suzano SA

Suzano SA - Overview
Suzano SA - Business segments
Suzano SA - Key offerings
Suzano SA - Segment focus
SWOT

15.16 Sylvamo Corp

Sylvamo Corp - Overview
Sylvamo Corp - Business segments
Sylvamo Corp - Key offerings
Sylvamo Corp - Segment focus
SWOT

15.17 The Navigator Co. SA

The Navigator Co. SA - Overview
The Navigator Co. SA - Business segments
The Navigator Co. SA - Key offerings
The Navigator Co. SA - Segment focus
SWOT

15.18 UPM Kymmene Corp.

UPM Kymmene Corp. - Overview
UPM Kymmene Corp. - Business segments
UPM Kymmene Corp. - Key offerings
UPM Kymmene Corp. - Segment focus
SWOT

16. Appendix

16.1 Scope of the report

Market definition
Objectives
Notes and caveats

16.2 Inclusions and exclusions checklist

Inclusions checklist
Exclusions checklist

16.3 Currency conversion rates for US$

16.4 Research methodology

16.5 Data procurement

Information sources

16.6 Data validation

16.7 Validation techniques employed for market sizing

16.8 Data synthesis

16.9 360 degree market analysis

16.10 List of abbreviations

Research Methodology

Technavio presents a detailed picture of the market by way of study, synthesis, and summation of data from multiple sources. The analysts have presented the various facets of the market with a particular focus on identifying the key industry influencers. The data thus presented is comprehensive, reliable, and the result of extensive research, both primary and secondary.

INFORMATION SOURCES

Primary sources

  • Manufacturers and suppliers
  • Channel partners
  • Industry experts
  • Strategic decision makers

Secondary sources

  • Industry journals and periodicals
  • Government data
  • Financial reports of key industry players
  • Historical data
  • Press releases

DATA ANALYSIS

Data Synthesis

  • Collation of data
  • Estimation of key figures
  • Analysis of derived insights

Data Validation

  • Triangulation with data models
  • Reference against proprietary databases
  • Corroboration with industry experts

REPORT WRITING

Qualitative

  • Market drivers
  • Market challenges
  • Market trends
  • Five forces analysis

Quantitative

  • Market size and forecast
  • Market segmentation
  • Geographical insights
  • Competitive landscape

Interested in this report?

Get your sample now to see our research methodology and insights!

Download Now

Frequently Asked Questions

Graphic Paper market growth will increase by USD 6326.8 million during 2026-2030.

The Graphic Paper market is expected to grow at a CAGR of 1.6% during 2026-2030.

Graphic Paper market is segmented by Product type (Uncoated woodfree, Coated woodfree, Coated mechanical, Uncoated mechanical, Others) Application (Commercial printing and advertising, Office and business communication, Books and publishing, Newspapers and periodicals, Others) Distribution channel (Direct mill sales, Wholesalers, Retail, Online)

Asia Pulp and Paper Group, Billerud AB, Burgo Group SpA, FEDRIGONI Spa, Holmen AB, International Paper Co., JK Paper Ltd., Kruger Inc., Mohawk Fine Papers Inc., Nine Dragons Paper Holdings Ltd., Nippon Paper Industries Co. Ltd., Norske Skog ASA, Sappi Ltd., Shandong Chenming Paper Group, Shandong Sun Holdings Group, Stora Enso Oyj, Suzano SA, Sylvamo Corp, The Navigator Co. SA, UPM Kymmene Corp. are a few of the key vendors in the Graphic Paper market.

APAC will register the highest growth rate of 54% among the other regions. Therefore, the Graphic Paper market in APAC is expected to garner significant business opportunities for the vendors during the forecast period.

China, India, Japan, South Korea, Indonesia, Australia, Germany, France, Italy, UK, Spain, The Netherlands, US, Canada, Mexico, Brazil, Argentina, Colombia, Saudi Arabia, UAE, South Africa, Egypt, Turkey

  • Resurgence in educational publishing and book production is the driving factor this market.

The Graphic Paper market vendors should focus on grabbing business opportunities from the Product type segment as it accounted for the largest market share in the base year.
RIA - Research AI Assistant
Ask RIA
