Greenhouse Horticulture Market Size 2025-2029
The greenhouse horticulture market size is valued to increase USD 12.95 billion, at a CAGR of 7.9% from 2024 to 2029. Increased urban demand driving horticultural production will drive the greenhouse horticulture market.
Major Market Trends & Insights
- Europe dominated the market and accounted for a 56% growth during the forecast period.
- By Product - Plastic segment was valued at USD 18.74 billion in 2023
- By Crop Type - Fruits and vegetables segment accounted for the largest market revenue share in 2023
Market Size & Forecast
- Market Opportunities: USD 82.26 million
- Market Future Opportunities: USD 12946.10 million
- CAGR from 2024 to 2029 : 7.9%
Market Summary
- The market experiences continuous expansion due to escalating urban demand for locally grown, fresh produce. This trend is fueled by the growing awareness of health and wellness, as consumers increasingly seek access to nutritious fruits and vegetables. One significant development in this sector is the increasing relevance of LED growth lights in greenhouse operations. These energy-efficient lights offer numerous advantages, including reduced energy consumption, longer operational hours, and improved crop quality. However, the high capital and operational costs associated with greenhouse infrastructure remain a challenge for market growth. Despite these hurdles, the industry continues to innovate, with advancements in automation, precision farming, and vertical farming systems.
- The market was valued at over USD 50 billion in 2020 and is projected to expand at a steady pace in the coming years. This growth is driven by the increasing demand for locally grown produce, technological advancements, and the rising adoption of sustainable farming practices.
What will be the Size of the Greenhouse Horticulture Market during the forecast period?

Get Key Insights on Market Forecast (PDF) Request Free Sample
How is the Greenhouse Horticulture Market Segmented?
The greenhouse horticulture industry research report provides comprehensive data (region-wise segment analysis), with forecasts and estimates in "USD million" for the period 2025-2029, as well as historical data from 2019-2023 for the following segments.
- Product
- Plastic
- Glass
- Crop Type
- Fruits and vegetables
- Nursery crops
- Flowers and ornamentals
- Others
- Technology
- Hydroponics
- Aeroponics
- Aquaponics
- Vertical farming
- Others
- Geography
- North America
- US
- Canada
- Europe
- France
- Germany
- Italy
- Spain
- The Netherlands
- UK
- APAC
- China
- India
- Rest of World (ROW)
- North America
By Product Insights
The plastic segment is estimated to witness significant growth during the forecast period.
The market continues to evolve, with ongoing advancements in environmental control systems and CO2 enrichment methods driving growth. Substrate irrigation techniques, such as nutrient film technology and precision fertigation systems, optimize crop yield and water-use efficiency. Greenhouse gas emissions are minimized through energy efficiency greenhouses, soil nutrient cycling, and plant nutrient solutions. Plant growth regulators, microbial inoculant application, and integrated pest management strategies enhance crop stress tolerance and disease resistance. Advancements in climate data logging, yield prediction modeling, and light spectrum optimization improve crop quality assessment and root zone monitoring. Hydroponic systems design, including soilless growing media and automated climate control, enable year-round production.

The Plastic segment was valued at USD 18.74 billion in 2019 and showed a gradual increase during the forecast period.
Vertical farming techniques and growth chamber technology facilitate seed germination optimization and photosynthetic efficiency. Humic acid fertilizers and nutrient uptake efficiency enhance plant hormone modulation. One notable statistic underscores the market's potential: greenhouse production accounts for approximately 25% of global vegetable production. With ongoing research and innovation, the market is poised to continue shaping the future of sustainable agriculture.

Regional Analysis
Europe is estimated to contribute 56% to the growth of the global market during the forecast period. Technavio's analysts have elaborately explained the regional trends and drivers that shape the market during the forecast period.

See How Greenhouse Horticulture Market Demand is Rising in Europe Request Free Sample
The European market is poised for substantial expansion due to technological advancements and the growing emphasis on sustainable agricultural practices. Favorable climate conditions and well-established infrastructure in Europe will foster market growth. Innovations in climate control systems, energy-efficient solutions, and automation will boost productivity and lower operational costs. European countries will prioritize eco-friendly practices and renewable energy sources to comply with stringent environmental regulations. The market will gain momentum from government initiatives and subsidies that promote sustainable agriculture. Moreover, the increasing consumer preference for locally grown fresh produce will fuel demand for greenhouse horticulture.
According to recent studies, the European market is expected to grow at a steady pace, with the tomato segment holding the largest market share. Another report indicates that the energy-efficient solutions segment will witness significant growth due to the increasing adoption of sustainable practices.
Market Dynamics
Our researchers analyzed the data with 2024 as the base year, along with the key drivers, trends, and challenges. A holistic analysis of drivers will help companies refine their marketing strategies to gain a competitive advantage.
The market is experiencing significant growth as innovations in technology and sustainable practices continue to optimize plant growth and increase yields. One key area of focus is the optimization of light spectrum, with researchers and growers exploring the use of specific wavelengths to enhance photosynthesis and promote healthier plant growth. Another important factor is the impact of CO2 enrichment on plant growth, with many greenhouses implementing systems to increase CO2 levels for improved yield and faster growth. Water-use efficiency is also a major concern in the greenhouse horticulture industry, with hydroponics systems being adopted for their ability to precisely control nutrient delivery and minimize water waste. Effective pest and disease control strategies are essential for maintaining healthy crops, with precision fertigation and automated climate control systems playing a crucial role in preventing and managing outbreaks. Advancements in plant breeding are leading to the development of disease-resistant crop varieties, while root zone monitoring techniques and data-driven insights are helping growers optimize nutrient uptake and improve crop health. Analyzing photosynthetic efficiency in various plant species and evaluating the effectiveness of microbial inoculants and humic acid fertilizers are also areas of active research. Energy efficiency is a priority in the market, with designers and operators implementing energy-efficient systems and organic practices to improve soil nutrient cycling. Advanced techniques for enhancing crop stress tolerance and employing water recycling for sustainable horticulture are also gaining popularity. The use of artificial intelligence in plant disease detection and precision seed germination techniques are further driving innovation in the industry. Overall, the market is characterized by a constant pursuit of new technologies and sustainable practices to optimize crop production and meet the growing demand for fresh, high-quality produce.

What are the key market drivers leading to the rise in the adoption of Greenhouse Horticulture Industry?
- The significant surge in urban population's demand for horticultural products serves as the primary market driver.
- The market is experiencing significant growth, driven by the increasing urban population and the resulting demand for fresh fruits and vegetables. In North America, Europe, and Latin America and the Caribbean, over 70% of the population resides in urban areas. In Asia and Africa, the urban population comprises approximately 50% and 43% of their respective populations. This demographic shift signifies an increase in affluence and a corresponding rise in the consumption of fresh produce. Traditional farming in rural areas may struggle to meet this demand due to logistical challenges.
- Greenhouse horticulture offers a solution, enabling the production of fresh fruits and vegetables closer to urban centers. This not only reduces transportation costs and time but also ensures the availability of high-quality produce year-round.
What are the market trends shaping the Greenhouse Horticulture Industry?
- The increasing relevance of LED growth lights is a notable trend in the market. LED growth lights are becoming increasingly significant in the realm of greenhouse horticulture.
- Greenhouses have evolved to address the insufficient natural sunlight during certain seasons and conditions, particularly for plants that require specific day lengths for photosynthesis. This need has led to the application of horticultural lighting solutions, including photoperiodic and supplemental lighting. Photosynthesis occurs within a defined spectrum, referred to as photosynthetically active radiation (PAR) light. This spectrum encompasses light waves between 400 and 700 nanometers.
- The intensity of this light plays a crucial role in the application, as some plants demand higher light levels for optimal growth. The integration of horticultural lighting systems ensures that plants receive the necessary light for photosynthesis, regardless of external conditions, thereby enhancing their growth and productivity.
What challenges does the Greenhouse Horticulture Industry face during its growth?
- The escalating costs related to greenhouse operations pose a significant challenge and hinder the growth of the industry.
- Greenhouses are essential structures for optimizing plant growth, yet their construction and maintenance involve significant investments. Capital expenses include the cost of greenhouse materials, such as plastic or glass roofing, and advanced climate control equipment, including vents, fans, heaters, and lighting systems. These expenses can range from USD 5,000 for a basic greenhouse to USD 25,000 for a high-tech, high-end one. Annual farm income can be comparable to these substantial capital outlays, making greenhouse horticulture a significant commitment for farmers.
- Despite the high initial investment, the evolving nature of greenhouse technology and its applications across various sectors, including agriculture, pharmaceuticals, and research, underscores the potential for robust returns.
Exclusive Technavio Analysis on Customer Landscape
The greenhouse horticulture market forecasting report includes the adoption lifecycle of the market, covering from the innovator's stage to the laggard's stage. It focuses on adoption rates in different regions based on penetration. Furthermore, the greenhouse horticulture market report also includes key purchase criteria and drivers of price sensitivity to help companies evaluate and develop their market growth analysis strategies.
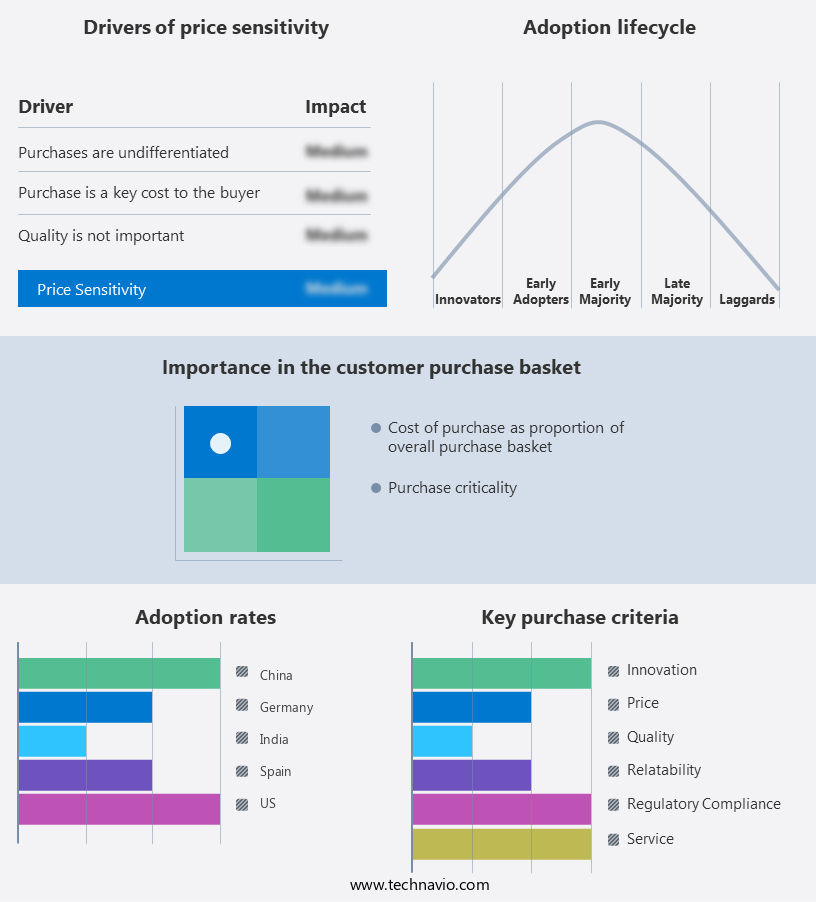
Customer Landscape of Greenhouse Horticulture Industry
Competitive Landscape
Companies are implementing various strategies, such as strategic alliances, greenhouse horticulture market forecast, partnerships, mergers and acquisitions, geographical expansion, and product/service launches, to enhance their presence in the industry.
Asian Perlite Industries Sdn Bhd - This company specializes in advanced greenhouse technology for cultivating a diverse range of vegetables, fruits, and flowers, optimizing yield and sustainability. .
The industry research and growth report includes detailed analyses of the competitive landscape of the market and information about key companies, including:
- Asian Perlite Industries Sdn Bhd
- Batenburg Techniek NV
- Beijing Kingpeng International Hi-tech Corp.
- Ceres Greenhouse Solutions
- Certhon Build B.V.
- CMF Groupe
- Dalsem Greenhouse Projects BV
- Europrogress Srl
- Industries Harnois Inc.
- IsraelAgri
- Netafim Ltd.
- Novavert GmbH and Co. KG.
- Prasada Xiamen Agricultural Engineering Co. Ltd.
- Priva Holding BV
- Prospiant Inc.
- Richel Group SAS
- Ridder Drive Systems BV
- Top Greenhouses Ltd.
- Van der Hoeven Horticultural Projects BV
Qualitative and quantitative analysis of companies has been conducted to help clients understand the wider business environment as well as the strengths and weaknesses of key industry players. Data is qualitatively analyzed to categorize companies as pure play, category-focused, industry-focused, and diversified; it is quantitatively analyzed to categorize companies as dominant, leading, strong, tentative, and weak.
Recent Development and News in Greenhouse Horticulture Market
- In January 2024, Signify, a global leader in lighting, announced the launch of their new Philips GreenPower LED toplighting system, designed specifically for greenhouse horticulture. This innovative solution reportedly increases yield and reduces energy consumption by up to 30% (Signify press release).
- In March 2024, Plenty, an urban farming company, and BrightFarms, a leader in hydroponic farming, formed a strategic partnership to expand their combined reach in the greenhouse produce market. The collaboration aimed to leverage Plenty's vertical farming technology and BrightFarms' retail partnerships (BrightFarms press release).
- In April 2025, Hortau, a leading provider of irrigation and water management solutions, secured a strategic investment of USD 25 million from S2G Ventures. The funding will support the expansion of their global operations and the development of new technologies (S2G Ventures press release).
- In May 2025, the European Union approved the Horizon 2020 project "GreenTechConnect," which aims to create a European greenhouse horticulture innovation hub. The initiative will focus on research and development, technology transfer, and business support services (European Commission press release).
Dive into Technavio's robust research methodology, blending expert interviews, extensive data synthesis, and validated models for unparalleled Greenhouse Horticulture Market insights. See full methodology.
|
Market Scope |
|
|
Report Coverage |
Details |
|
Page number |
222 |
|
Base year |
2024 |
|
Historic period |
2019-2023 |
|
Forecast period |
2025-2029 |
|
Growth momentum & CAGR |
Accelerate at a CAGR of 7.9% |
|
Market growth 2025-2029 |
USD 12946.1 million |
|
Market structure |
Fragmented |
|
YoY growth 2024-2025(%) |
7.2 |
|
Key countries |
The Netherlands, US, Spain, Germany, Italy, China, France, India, Canada, and UK |
|
Competitive landscape |
Leading Companies, Market Positioning of Companies, Competitive Strategies, and Industry Risks |
Research Analyst Overview
- The market continues to evolve, driven by advancements in environmental control systems and CO2 enrichment. Substrate irrigation methods, such as nutrient film technique and precision fertigation, optimize crop yield and improve water-use efficiency. Greenhouse gas emissions are mitigated through the use of plant growth regulators, microbial inoculant application, and integrated pest management. Industry growth is expected to reach double-digit percentages, fueled by the adoption of vertical farming techniques and growth chamber technology. Seed germination optimization and plant hormone modulation enhance crop stress tolerance, while climate data logging and yield prediction modeling provide valuable insights for farmers.
- For instance, a leading greenhouse grower implemented an automated climate control system, resulting in a 15% increase in crop yield and a 20% reduction in energy consumption. This demonstrates the potential for energy efficiency in greenhouses, as well as the importance of crop yield optimization. Moreover, the use of soilless growing media, such as humic acid fertilizers, and plant nutrient solutions, along with root zone monitoring and light spectrum optimization, contribute to improved nutrient uptake efficiency and photosynthetic efficiency. Disease resistance breeding and crop quality assessment are also crucial components of the market, ensuring high-quality produce for consumers.
- Innovations in protected cultivation structures, including energy efficiency greenhouses and hydroponic systems design, further drive market growth and sustainability. Soil nutrient cycling and plant tissue culture are essential practices that promote the overall health and productivity of greenhouse crops.
What are the Key Data Covered in this Greenhouse Horticulture Market Research and Growth Report?
-
What is the expected growth of the Greenhouse Horticulture Market between 2025 and 2029?
-
USD 12.95 billion, at a CAGR of 7.9%
-
-
What segmentation does the market report cover?
-
The report is segmented by Product (Plastic and Glass), Crop Type (Fruits and vegetables, Nursery crops, Flowers and ornamentals, and Others), Technology (Hydroponics, Aeroponics, Aquaponics, Vertical farming, and Others), and Geography (Europe, North America, APAC, Middle East and Africa, and South America)
-
-
Which regions are analyzed in the report?
-
Europe, North America, APAC, Middle East and Africa, and South America
-
-
What are the key growth drivers and market challenges?
-
Increased urban demand driving horticultural production, High costs associated with greenhouses
-
-
Who are the major players in the Greenhouse Horticulture Market?
-
Asian Perlite Industries Sdn Bhd, Batenburg Techniek NV, Beijing Kingpeng International Hi-tech Corp., Ceres Greenhouse Solutions, Certhon Build B.V., CMF Groupe, Dalsem Greenhouse Projects BV, Europrogress Srl, Industries Harnois Inc., IsraelAgri, Netafim Ltd., Novavert GmbH and Co. KG., Prasada Xiamen Agricultural Engineering Co. Ltd., Priva Holding BV, Prospiant Inc., Richel Group SAS, Ridder Drive Systems BV, Top Greenhouses Ltd., and Van der Hoeven Horticultural Projects BV
-
Market Research Insights
- The market is a dynamic and ever-evolving industry that incorporates advanced technologies to optimize crop production and improve sustainability. Two significant trends include the integration of machine learning algorithms and climate monitoring sensors for data-driven horticulture. For instance, these technologies have led to a 15% increase in yield for one large-scale greenhouse operation. Furthermore, industry experts anticipate a 10% annual growth rate for the greenhouse horticulture sector over the next five years, driven by the adoption of precision agriculture tools and automation.
- Organic growing practices, soil health improvement, and nutrient management strategies also remain crucial aspects of this market. Remote sensing technology and water recycling methods contribute to resource optimization, while automated harvesting and pest control strategies ensure efficient and effective crop management. The integration of artificial intelligence and climate monitoring sensors allows for real-time plant health diagnostics and growth analysis, ultimately leading to higher-quality produce and reduced waste.
We can help! Our analysts can customize this greenhouse horticulture market research report to meet your requirements.
 RIA -
RIA - 
