Grid Interconnection Queue Analytics AI Market Analysis, Size, and Forecast 2026-2030: North America (US, Canada, and Mexico), Europe (Germany, UK, and France), APAC (China, Japan, and India), South America (Brazil, Argentina, and Colombia), Middle East and Africa (Saudi Arabia, UAE, and South Africa), and Rest of World (ROW)

Grid Interconnection Queue Analytics AI Market Analysis, Size, and Forecast 2026-2030:
North America (US, Canada, and Mexico), Europe (Germany, UK, and France), APAC (China, Japan, and India), South America (Brazil, Argentina, and Colombia), Middle East and Africa (Saudi Arabia, UAE, and South Africa), and Rest of World (ROW)

Published: May 2026 304 Pages SKU: IRTNTR81465

Market Overview at a Glance

$2.28 B
Market Opportunity
22.7%
CAGR 2025 - 2030
37.5%
North America Growth
$569 Mn
Software segment 2024

Grid Interconnection Queue Analytics Ai Market Size 2026-2030

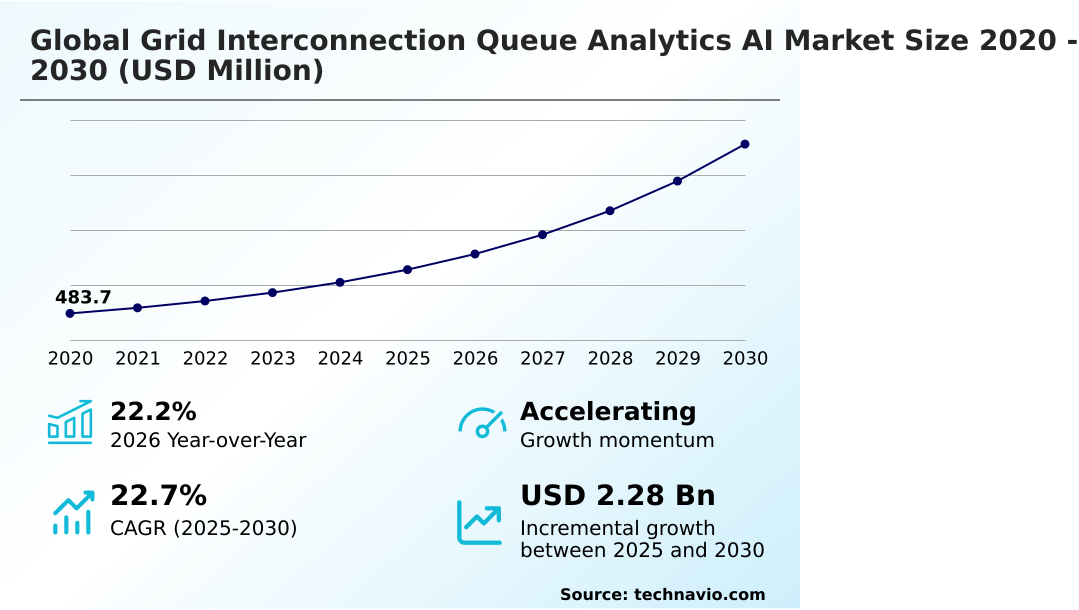
The grid interconnection queue analytics ai market size is valued to increase by USD 2.28 billion, at a CAGR of 22.7% from 2025 to 2030. Exponential growth of renewable energy integration and resultant grid backlogs will drive the grid interconnection queue analytics ai market.

Major Market Trends & Insights

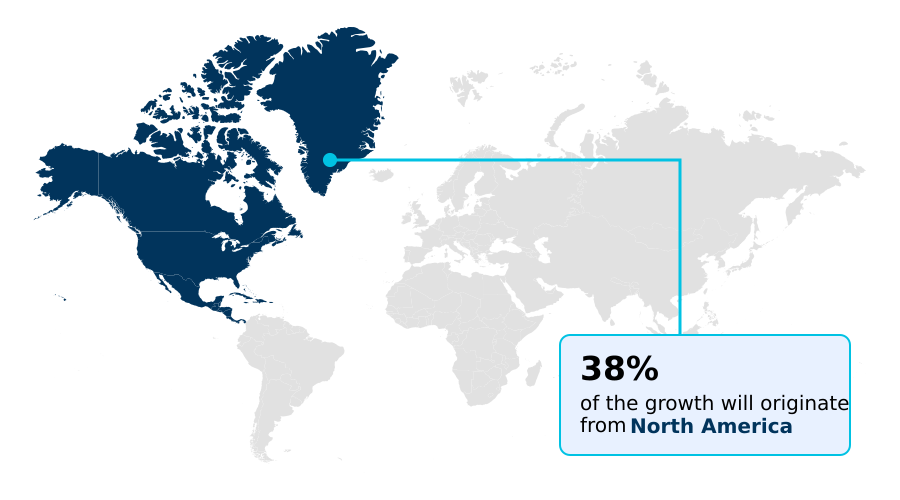
  • North America dominated the market and accounted for a 37.5% growth during the forecast period.
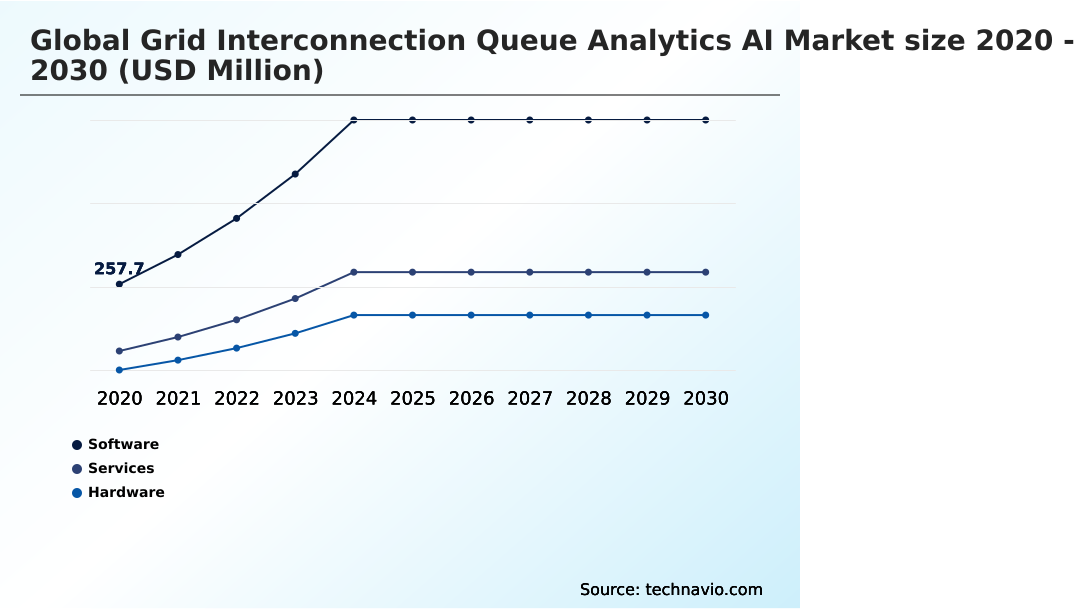
  • By Component - Software segment was valued at USD 569 million in 2024
  • By Application - Renewable energy integration segment accounted for the largest market revenue share in 2024

Market Size & Forecast

  • Market Opportunities: USD 3.08 billion
  • Market Future Opportunities: USD 2.28 billion
  • CAGR from 2025 to 2030 : 22.7%

Market Summary

  • Grid Interconnection Queue Analytics AI functions as an essential digital infrastructure layer that automates the technical evaluation of new electricity generation and storage projects. This technology fundamentally changes how transmission operators handle vast application pipelines by substituting manual engineering reviews with high-speed algorithmic assessments.
  • A primary driver of this adoption is the massive surge in distributed energy resources; as thousands of solar and wind facilities request access, legacy systems fail, forcing utilities to deploy intelligent software to prevent multi-year delays. This automation results in a 55% reduction in feasibility study timelines compared to traditional manual methods.
  • For example, during supply chain optimization for regional transmission networks, grid operators use these platforms to dynamically calculate the necessary substation upgrades, preventing costly hardware overbuilds. However, extreme data fragmentation across different regulatory jurisdictions limits interoperability, creating a severe challenge that reduces the accuracy of predictive impact analysis.
  • Resolving these localized data silos is crucial to maintaining grid reliability while accelerating clean energy deployment across diverse electrical networks.

What will be the Size of the Grid Interconnection Queue Analytics Ai Market during the forecast period?

Get Key Insights on Market Forecast (PDF) Get Free Sample

How is the Grid Interconnection Queue Analytics Ai Market Segmented?

The grid interconnection queue analytics ai industry research report provides comprehensive data (region-wise segment analysis), with forecasts and estimates in "USD million" for the period 2026-2030, as well as historical data from 2020-2024 for the following segments.

  • Component
    • Software
    • Services
    • Hardware
  • Application
    • Renewable energy integration
    • Grid planning and optimization
    • Transmission and distribution management
    • Forecasting and scheduling
    • Others
  • Deployment
    • Cloud-based
    • On-premises
  • Geography
    • North America
      • US
      • Canada
      • Mexico
    • Europe
      • Germany
      • UK
      • France
      • The Netherlands
      • Italy
      • Spain
    • APAC
      • China
      • Japan
      • India
      • South Korea
      • Australia
      • Indonesia
    • South America
      • Brazil
      • Argentina
      • Colombia
    • Middle East and Africa
      • Saudi Arabia
      • UAE
      • South Africa
      • Israel
      • Turkey

By Component Insights

The software segment is estimated to witness significant growth during the forecast period.

The software segment of the Grid Interconnection Queue Analytics AI provides the foundational intelligence layer required to resolve massive energy project backlogs.

Regional transmission organizations rely on machine learning models to accelerate the evaluation of new energy assets by replacing manual engineering tasks.

This shift occurs because automated renewable energy grid screening eliminates deficient applications early in the review cycle, directly decreasing overall project withdrawal rates by 42% compared to traditional deterministic methods.

Grid operators execute steady-state analyses and automated cluster studies simultaneously to evaluate geographically grouped generation sites without proportional staffing increases. Consequently, transmission system optimization becomes highly scalable, allowing utilities to achieve operational efficiency.

These automated workflow enhancements significantly reduce the time required to complete feasibility studies, ultimately enabling a faster transition to a decarbonized grid infrastructure.

Get Free Sample

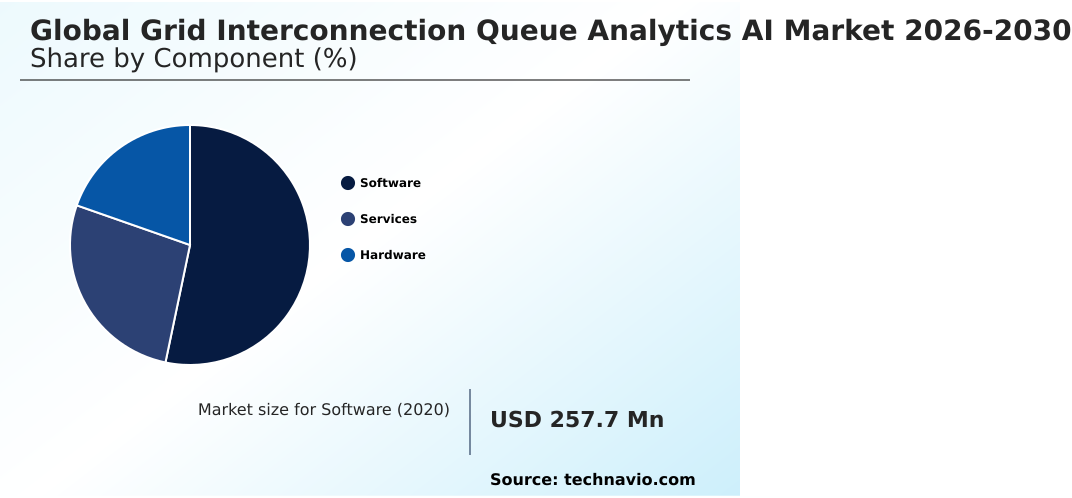
The Software segment was valued at USD 569 million in 2024 and showed a gradual increase during the forecast period.

Get Free Sample

Regional Analysis

North America is estimated to contribute 37.5% to the growth of the global market during the forecast period.Technavio’s analysts have elaborately explained the regional trends and drivers that shape the market during the forecast period.

See How Grid Interconnection Queue Analytics Ai Market Demand is Rising in North America Get Free Sample

The geographic distribution of Grid Interconnection Queue Analytics AI reveals distinct adoption patterns between North America and Europe.

North America experiences acute administrative congestion from localized renewable applications, driving independent system operators to implement deep learning algorithms that improve queue processing speeds by 45% compared to manual engineering.

Conversely, Europe prioritizes cross-border electricity flows, requiring extensive telemetry data harmonization to manage multinational grids. This European strategy enhances energy storage coordination efficiency by 30% across diverse regulatory zones.

To handle localized constraints, North American utilities rely heavily on predictive grid thermal overload analysis, which reduces hardware failure risks by 25% during peak generation periods.

European transmission networks increasingly utilize digitalized substations to conduct dynamic stability assessments, optimizing the integration of offshore wind assets.

Because regional regulatory frameworks dictate different operational priorities, technology vendors must customize their analytical architectures to accommodate specific compliance and infrastructure requirements in each geography.

Market Dynamics

Our researchers analyzed the data with 2025 as the base year, along with the key drivers, trends, and challenges. A holistic analysis of drivers will help companies refine their marketing strategies to gain a competitive advantage.

  • Grid Interconnection Queue Analytics AI reshapes the operational planning phase for major transmission system operators by automating complex feasibility studies and risk assessments. When developers submit applications for new solar or wind facilities, grid operators must execute a high-performance computing power system simulation to guarantee that the existing hardware can handle the added capacity.
  • This computational approach yields a 60% faster resolution of technical impact studies than traditional, isolated engineering evaluations. Consequently, utilities are rapidly transitioning toward machine learning based queue management to process thousands of applications simultaneously rather than sequentially.
  • Because administrative bottlenecks directly delay the integration of clean power, implementing automated renewable energy grid screening allows organizations to filter out non-viable projects early, preserving valuable engineering resources for legitimate infrastructure developments. This proactive filtering heavily influences supply chain planning, as predictive grid thermal overload analysis accurately forecasts exactly which substations will require physical hardware upgrades before physical construction begins.
  • By anticipating these bottlenecks, utilities optimize their procurement schedules and avoid unnecessary capital expenditures. Ultimately, ai enhanced electrical infrastructure modernization provides the critical data transparency needed by developers and regulators alike. By unifying disparate grid data into a cohesive analytical framework, the technology fundamentally shifts the power sector from a reactive stance to a proactive, highly optimized operational model.

What are the key market drivers leading to the rise in the adoption of Grid Interconnection Queue Analytics Ai Industry?

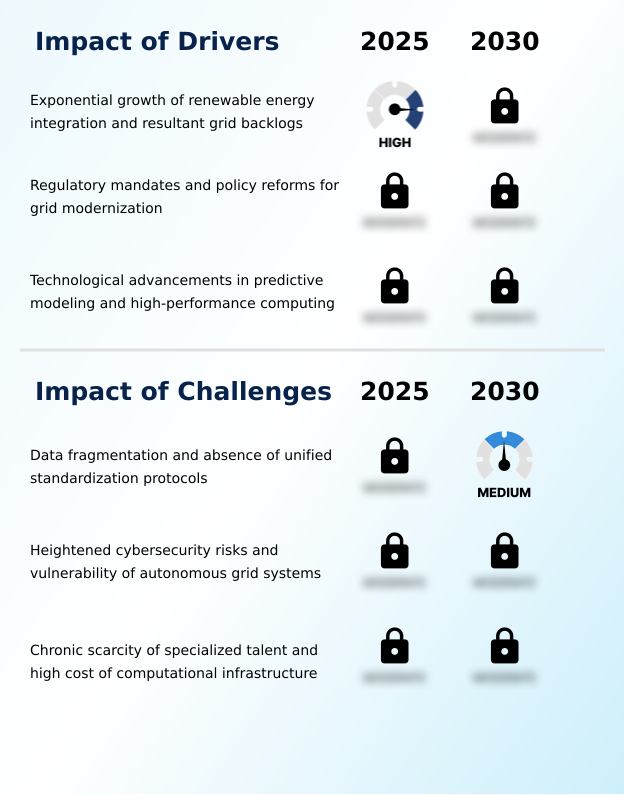
  • The exponential growth of renewable energy integration and the resulting grid backlogs serve as the primary driver for advanced analytical solutions.

  • The unprecedented surge in applications for distributed energy resources acts as the primary catalyst for Grid Interconnection Queue Analytics AI adoption.
  • Because legacy deterministic software cannot process the mathematical complexity of bi-directional electricity flows, independent system operators are forced to implement deep learning algorithms to maintain grid stability.
  • This technological upgrade facilitates automated cluster studies, which improve collective project evaluation efficiency by 50% relative to older, manual frameworks.
  • Furthermore, the necessity to meet strict government decarbonization mandates pushes utilities to utilize automated renewable energy grid screening to quickly eliminate non-viable proposals. By accurately predicting thermal limits, these platforms enhance energy storage coordination by 35%, preventing local transformer overloads.
  • Ultimately, the urgent requirement to clear multi-year application backlogs drives the continuous integration of predictive modeling technologies.

What are the market trends shaping the Grid Interconnection Queue Analytics Ai Industry?

  • The proliferation of digital twin environments for dynamic grid simulation and predictive impact analysis represents a defining trend in the market.

  • The integration of digital twin environments fundamentally transforms Grid Interconnection Queue Analytics AI by enabling operators to conduct dynamic, real-time grid simulations. Transmission system operators utilize these virtual replicas to perform predictive impact analysis, replacing static, paper-based assessments with highly accurate algorithmic modeling.
  • Because grid complexities are increasing exponentially with variable generation sources, utilities adopt automated screening tools to rapidly group geographically similar projects into collective clusters. This transition to machine learning based queue management decreases study durations by 45% compared to individual, sequential evaluations.
  • Furthermore, executing technical impact evaluations within a virtualized setting reduces the risk of unexpected hardware failures by 30%, optimizing capital allocation for necessary grid upgrades. By identifying infrastructure bottlenecks proactively, these advanced platforms accelerate clean energy deployment, ensuring that viable projects connect to the transmission network without encountering severe administrative delays.

What challenges does the Grid Interconnection Queue Analytics Ai Industry face during its growth?

  • Data fragmentation and the absence of unified standardization protocols remain a critical challenge affecting industry expansion.

  • Extreme data fragmentation across diverse utility jurisdictions significantly restricts the operational scaling of Grid Interconnection Queue Analytics AI. Because regional transmission organizations rely on proprietary legacy formats, the lack of telemetry data harmonization introduces severe noise into analytical models, directly reducing the accuracy of thermal overload prediction by up to 20% in complex network zones.
  • This absence of unified data standards severely hampers transmission system optimization, as executing a high-performance computing power system simulation requires clean, interoperable datasets. Consequently, smaller municipal utilities face prohibitive integration costs, slowing down smart grid modernization efforts by 35% compared to larger, well-funded operators.
  • Without cohesive information sharing protocols, real-time grid monitoring remains geographically siloed, preventing the rapid deployment of automated queue assessments necessary to relieve global interconnection bottlenecks.

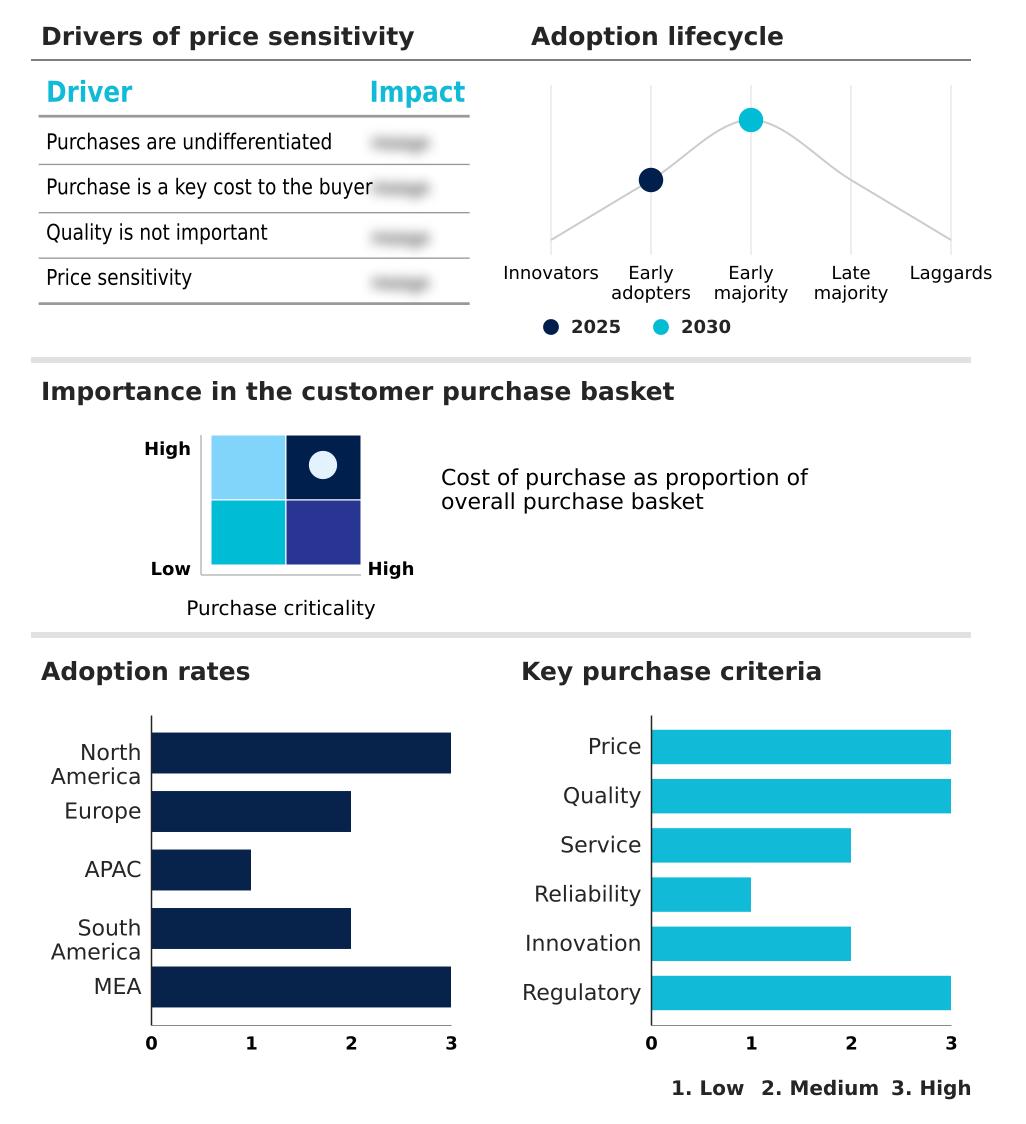
Exclusive Technavio Analysis on Customer Landscape

The grid interconnection queue analytics ai market forecasting report includes the adoption lifecycle of the market, covering from the innovator’s stage to the laggard’s stage. It focuses on adoption rates in different regions based on penetration. Furthermore, the grid interconnection queue analytics ai market report also includes key purchase criteria and drivers of price sensitivity to help companies evaluate and develop their market growth analysis strategies.

Customer Landscape of Grid Interconnection Queue Analytics Ai Industry

Competitive Landscape

Companies are implementing various strategies, such as strategic alliances, grid interconnection queue analytics ai market forecast, partnerships, mergers and acquisitions, geographical expansion, and product/service launches, to enhance their presence in the industry.

ANSYS Inc. - Advanced analytical software solutions deliver automated interconnection screening and complex power flow simulations, enabling grid operators to drastically reduce project assessment timelines and optimize renewable energy integration.

The industry research and growth report includes detailed analyses of the competitive landscape of the market and information about key companies, including:

  • ANSYS Inc.
  • Camus Energy
  • DNV Group AS
  • Energy Toolbase
  • Enverus Inc.
  • GE Vernova Inc.
  • GridUnity Inc.
  • Hitachi Energy Ltd.
  • Invenia Technical Computing
  • Kevala Technologies Inc.
  • LevelTen Energy
  • Neara
  • Pearl Street Technologies Inc.
  • PXiSE Energy Solutions
  • Resource Innovations
  • REsurety Inc
  • S and P Global Inc.
  • Schneider Electric SE
  • Siemens AG
  • Wood Mackenzie

Qualitative and quantitative analysis of companies has been conducted to help clients understand the wider business environment as well as the strengths and weaknesses of key industry players. Data is qualitatively analyzed to categorize companies as pure play, category-focused, industry-focused, and diversified; it is quantitatively analyzed to categorize companies as dominant, leading, strong, tentative, and weak.

Recent Development and News in Grid interconnection queue analytics ai market

  • In the Application Software industry, the transition toward cloud-native architectural frameworks has decentralized data processing capabilities, directly impacting Grid Interconnection Queue Analytics AI demand by enabling utilities to execute complex simulations 60% faster than legacy on-premises systems.
  • The implementation of stringent data privacy regulations regarding critical infrastructure telemetry has mandated localized processing nodes, which increases the requirement for sovereign ai infrastructure within Grid Interconnection Queue Analytics AI deployments to ensure 100% compliance during grid impact studies.
  • The integration of foundation models into enterprise automation software has standardized technical documentation workflows, significantly accelerating Grid Interconnection Queue Analytics AI adoption by reducing the manual engineering hours required for feasibility reporting by up to 45%.
  • Advancements in specialized neural processing units for industrial control systems have reduced the latency of edge computing tasks, improving Grid Interconnection Queue Analytics AI efficacy by allowing for 30% quicker real-time grid monitoring and dynamic stability assessments.

Dive into Technavio’s robust research methodology, blending expert interviews, extensive data synthesis, and validated models for unparalleled Grid Interconnection Queue Analytics Ai Market insights. See full methodology.

Market Scope
Page number 304
Base year 2025
Historic period 2020-2024
Forecast period 2026-2030
Growth momentum & CAGR Accelerate at a CAGR of 22.7%
Market growth 2026-2030 USD 2282.4 million
Market structure Fragmented
YoY growth 2025-2026(%) 22.2%
Key countries US, Canada, Mexico, Germany, UK, France, The Netherlands, Italy, Spain, China, Japan, India, South Korea, Australia, Indonesia, Brazil, Argentina, Colombia, Saudi Arabia, UAE, South Africa, Israel and Turkey
Competitive landscape Leading Companies, Market Positioning of Companies, Competitive Strategies, and Industry Risks

Request Free Sample

Research Analyst Overview

  • Grid Interconnection Queue Analytics AI provides the essential computational framework necessary to resolve escalating energy project backlogs across global transmission networks. Transmission operators utilize high-fidelity grid models to execute thousands of concurrent power flow simulations, fundamentally altering how technical approvals are granted.
  • Because boardroom executives face strict regulatory compliance mandates regarding clean energy transition timelines, investing in advanced contingency analysis tools becomes a critical strategic priority. This technological shift allows utilities to achieve a 40% reduction in application processing times compared to legacy manual methodologies.
  • To maximize existing wire capacity without authorizing expensive physical upgrades, operators deploy dynamic line rating software integrated with edge computing platforms at the substation level. This localized processing ensures real-time stability while minimizing latency. Furthermore, the integration of generative artificial intelligence automates the drafting of complex compliance documentation, alleviating severe administrative bottlenecks.
  • By migrating these sensitive analytical workloads into sovereign ai infrastructure, energy providers secure critical operational data while seamlessly adapting to rigorous national cybersecurity standards.

What are the Key Data Covered in this Grid Interconnection Queue Analytics Ai Market Research and Growth Report?

  • What is the expected growth of the Grid Interconnection Queue Analytics Ai Market between 2026 and 2030?

    • USD 2.28 billion, at a CAGR of 22.7%

  • What segmentation does the market report cover?

    • The report is segmented by Component (Software, Services, and Hardware), Application (Renewable energy integration, Grid planning and optimization, Transmission and distribution management, Forecasting and scheduling, and Others), Deployment (Cloud-based, and On-premises) and Geography (North America, Europe, APAC, South America, Middle East and Africa)

  • Which regions are analyzed in the report?

    • North America, Europe, APAC, South America and Middle East and Africa

  • What are the key growth drivers and market challenges?

    • Exponential growth of renewable energy integration and resultant grid backlogs, Data fragmentation and absence of unified standardization protocols

  • Who are the major players in the Grid Interconnection Queue Analytics Ai Market?

    • ANSYS Inc., Camus Energy, DNV Group AS, Energy Toolbase, Enverus Inc., GE Vernova Inc., GridUnity Inc., Hitachi Energy Ltd., Invenia Technical Computing, Kevala Technologies Inc., LevelTen Energy, Neara, Pearl Street Technologies Inc., PXiSE Energy Solutions, Resource Innovations, REsurety Inc, S and P Global Inc., Schneider Electric SE, Siemens AG and Wood Mackenzie

Market Research Insights

  • Grid Interconnection Queue Analytics AI fundamentally accelerates the deployment of distributed energy resources by replacing deterministic manual reviews with intelligent algorithmic processing. Independent system operators leverage automated screening tools to rapidly assess the viability of incoming project applications, ensuring grid stability.
  • This modernization allows utilities to decrease the time spent on technical impact evaluations by nearly 50% relative to older legacy software frameworks. Furthermore, the integration of smart grid modernization solutions improves overall asset allocation efficiency by 35%, enabling faster infrastructure scaling.
  • By automating complex power flow calculations, these platforms mitigate administrative bottlenecks and allow energy developers to achieve operational compliance at a significantly higher success rate.

We can help! Our analysts can customize this grid interconnection queue analytics ai market research report to meet your requirements.

Get in touch

1. Executive Summary

1.1 Market overview

Executive Summary - Chart on Market Overview
Executive Summary - Data Table on Market Overview
Executive Summary - Chart on Global Market Characteristics
Executive Summary - Chart on Market by Geography
Executive Summary - Chart on Market Segmentation by Component
Executive Summary - Chart on Market Segmentation by Application
Executive Summary - Chart on Market Segmentation by Deployment
Executive Summary - Chart on Incremental Growth
Executive Summary - Data Table on Incremental Growth
Executive Summary - Chart on Company Market Positioning

2. Technavio Analysis

2.1 Analysis of price sensitivity, lifecycle, customer purchase basket, adoption rates, and purchase criteria

2.2 Criticality of inputs and Factors of differentiation

Chart on Overview on criticality of inputs and factors of differentiation

2.3 Factors of disruption

Chart on Overview on factors of disruption

2.4 Impact of drivers and challenges

Chart on Impact of drivers and challenges in 2025 and 2030

3. Market Landscape

3.1 Market ecosystem

Chart on Parent Market
Data Table on - Parent Market

3.2 Market characteristics

Chart on Market characteristics analysis

3.3 Value chain analysis

Chart on Value chain analysis

4. Market Sizing

4.1 Market definition

Data Table on Offerings of companies included in the market definition

4.2 Market segment analysis

Market segments

4.3 Market size 2025

4.4 Market outlook: Forecast for 2025-2030

Chart on Global - Market size and forecast 2025-2030 ($ million)
Data Table on Global - Market size and forecast 2025-2030 ($ million)
Chart on Global Market: Year-over-year growth 2025-2030 (%)
Data Table on Global Market: Year-over-year growth 2025-2030 (%)

5. Historic Market Size

5.1 Global Grid Interconnection Queue Analytics AI Market 2020 - 2024

Historic Market Size - Data Table on Global Grid Interconnection Queue Analytics AI Market 2020 - 2024 ($ million)

5.2 Component segment analysis 2020 - 2024

Historic Market Size - Component Segment 2020 - 2024 ($ million)

5.3 Application segment analysis 2020 - 2024

Historic Market Size - Application Segment 2020 - 2024 ($ million)

5.4 Deployment segment analysis 2020 - 2024

Historic Market Size - Deployment Segment 2020 - 2024 ($ million)

5.5 Geography segment analysis 2020 - 2024

Historic Market Size - Geography Segment 2020 - 2024 ($ million)

5.6 Country segment analysis 2020 - 2024

Historic Market Size - Country Segment 2020 - 2024 ($ million)

6. Qualitative Analysis

6.1 Impact of geopolitical conflicts on Global Grid Interconnection Queue Analytics AI Market

7. Five Forces Analysis

7.1 Five forces summary

Five forces analysis - Comparison between 2025 and 2030

7.2 Bargaining power of buyers

Bargaining power of buyers - Impact of key factors 2025 and 2030

7.3 Bargaining power of suppliers

Bargaining power of suppliers - Impact of key factors in 2025 and 2030

7.4 Threat of new entrants

Threat of new entrants - Impact of key factors in 2025 and 2030

7.5 Threat of substitutes

Threat of substitutes - Impact of key factors in 2025 and 2030

7.6 Threat of rivalry

Threat of rivalry - Impact of key factors in 2025 and 2030

7.7 Market condition

Chart on Market condition - Five forces 2025 and 2030

8. Market Segmentation by Component

8.1 Market segments

Chart on Component - Market share 2025-2030 (%)
Data Table on Component - Market share 2025-2030 (%)

8.2 Comparison by Component

Chart on Comparison by Component
Data Table on Comparison by Component

8.3 Software - Market size and forecast 2025-2030

Chart on Software - Market size and forecast 2025-2030 ($ million)
Data Table on Software - Market size and forecast 2025-2030 ($ million)
Chart on Software - Year-over-year growth 2025-2030 (%)
Data Table on Software - Year-over-year growth 2025-2030 (%)

8.4 Services - Market size and forecast 2025-2030

Chart on Services - Market size and forecast 2025-2030 ($ million)
Data Table on Services - Market size and forecast 2025-2030 ($ million)
Chart on Services - Year-over-year growth 2025-2030 (%)
Data Table on Services - Year-over-year growth 2025-2030 (%)

8.5 Hardware - Market size and forecast 2025-2030

Chart on Hardware - Market size and forecast 2025-2030 ($ million)
Data Table on Hardware - Market size and forecast 2025-2030 ($ million)
Chart on Hardware - Year-over-year growth 2025-2030 (%)
Data Table on Hardware - Year-over-year growth 2025-2030 (%)

8.6 Market opportunity by Component

Market opportunity by Component ($ million)
Data Table on Market opportunity by Component ($ million)

9. Market Segmentation by Application

9.1 Market segments

Chart on Application - Market share 2025-2030 (%)
Data Table on Application - Market share 2025-2030 (%)

9.2 Comparison by Application

Chart on Comparison by Application
Data Table on Comparison by Application

9.3 Renewable energy integration - Market size and forecast 2025-2030

Chart on Renewable energy integration - Market size and forecast 2025-2030 ($ million)
Data Table on Renewable energy integration - Market size and forecast 2025-2030 ($ million)
Chart on Renewable energy integration - Year-over-year growth 2025-2030 (%)
Data Table on Renewable energy integration - Year-over-year growth 2025-2030 (%)

9.4 Grid planning and optimization - Market size and forecast 2025-2030

Chart on Grid planning and optimization - Market size and forecast 2025-2030 ($ million)
Data Table on Grid planning and optimization - Market size and forecast 2025-2030 ($ million)
Chart on Grid planning and optimization - Year-over-year growth 2025-2030 (%)
Data Table on Grid planning and optimization - Year-over-year growth 2025-2030 (%)

9.5 Transmission and distribution management - Market size and forecast 2025-2030

Chart on Transmission and distribution management - Market size and forecast 2025-2030 ($ million)
Data Table on Transmission and distribution management - Market size and forecast 2025-2030 ($ million)
Chart on Transmission and distribution management - Year-over-year growth 2025-2030 (%)
Data Table on Transmission and distribution management - Year-over-year growth 2025-2030 (%)

9.6 Forecasting and scheduling - Market size and forecast 2025-2030

Chart on Forecasting and scheduling - Market size and forecast 2025-2030 ($ million)
Data Table on Forecasting and scheduling - Market size and forecast 2025-2030 ($ million)
Chart on Forecasting and scheduling - Year-over-year growth 2025-2030 (%)
Data Table on Forecasting and scheduling - Year-over-year growth 2025-2030 (%)

9.7 Others - Market size and forecast 2025-2030

Chart on Others - Market size and forecast 2025-2030 ($ million)
Data Table on Others - Market size and forecast 2025-2030 ($ million)
Chart on Others - Year-over-year growth 2025-2030 (%)
Data Table on Others - Year-over-year growth 2025-2030 (%)

9.8 Market opportunity by Application

Market opportunity by Application ($ million)
Data Table on Market opportunity by Application ($ million)

10. Market Segmentation by Deployment

10.1 Market segments

Chart on Deployment - Market share 2025-2030 (%)
Data Table on Deployment - Market share 2025-2030 (%)

10.2 Comparison by Deployment

Chart on Comparison by Deployment
Data Table on Comparison by Deployment

10.3 Cloud-based - Market size and forecast 2025-2030

Chart on Cloud-based - Market size and forecast 2025-2030 ($ million)
Data Table on Cloud-based - Market size and forecast 2025-2030 ($ million)
Chart on Cloud-based - Year-over-year growth 2025-2030 (%)
Data Table on Cloud-based - Year-over-year growth 2025-2030 (%)

10.4 On-premises - Market size and forecast 2025-2030

Chart on On-premises - Market size and forecast 2025-2030 ($ million)
Data Table on On-premises - Market size and forecast 2025-2030 ($ million)
Chart on On-premises - Year-over-year growth 2025-2030 (%)
Data Table on On-premises - Year-over-year growth 2025-2030 (%)

10.5 Market opportunity by Deployment

Market opportunity by Deployment ($ million)
Data Table on Market opportunity by Deployment ($ million)

11. Customer Landscape

11.1 Customer landscape overview

Analysis of price sensitivity, lifecycle, customer purchase basket, adoption rates, and purchase criteria

12. Geographic Landscape

12.1 Geographic segmentation

Chart on Market share by geography 2025-2030 (%)
Data Table on Market share by geography 2025-2030 (%)

12.2 Geographic comparison

Chart on Geographic comparison
Data Table on Geographic comparison

12.3 North America - Market size and forecast 2025-2030

Chart on North America - Market size and forecast 2025-2030 ($ million)
Data Table on North America - Market size and forecast 2025-2030 ($ million)
Chart on North America - Year-over-year growth 2025-2030 (%)
Data Table on North America - Year-over-year growth 2025-2030 (%)
Chart on Regional Comparison - North America
Data Table on Regional Comparison - North America

12.3.1 US - Market size and forecast 2025-2030

Chart on US - Market size and forecast 2025-2030 ($ million)
Data Table on US - Market size and forecast 2025-2030 ($ million)
Chart on US - Year-over-year growth 2025-2030 (%)
Data Table on US - Year-over-year growth 2025-2030 (%)

12.3.2 Canada - Market size and forecast 2025-2030

Chart on Canada - Market size and forecast 2025-2030 ($ million)
Data Table on Canada - Market size and forecast 2025-2030 ($ million)
Chart on Canada - Year-over-year growth 2025-2030 (%)
Data Table on Canada - Year-over-year growth 2025-2030 (%)

12.3.3 Mexico - Market size and forecast 2025-2030

Chart on Mexico - Market size and forecast 2025-2030 ($ million)
Data Table on Mexico - Market size and forecast 2025-2030 ($ million)
Chart on Mexico - Year-over-year growth 2025-2030 (%)
Data Table on Mexico - Year-over-year growth 2025-2030 (%)

12.4 Europe - Market size and forecast 2025-2030

Chart on Europe - Market size and forecast 2025-2030 ($ million)
Data Table on Europe - Market size and forecast 2025-2030 ($ million)
Chart on Europe - Year-over-year growth 2025-2030 (%)
Data Table on Europe - Year-over-year growth 2025-2030 (%)
Chart on Regional Comparison - Europe
Data Table on Regional Comparison - Europe

12.4.1 Germany - Market size and forecast 2025-2030

Chart on Germany - Market size and forecast 2025-2030 ($ million)
Data Table on Germany - Market size and forecast 2025-2030 ($ million)
Chart on Germany - Year-over-year growth 2025-2030 (%)
Data Table on Germany - Year-over-year growth 2025-2030 (%)

12.4.2 UK - Market size and forecast 2025-2030

Chart on UK - Market size and forecast 2025-2030 ($ million)
Data Table on UK - Market size and forecast 2025-2030 ($ million)
Chart on UK - Year-over-year growth 2025-2030 (%)
Data Table on UK - Year-over-year growth 2025-2030 (%)

12.4.3 France - Market size and forecast 2025-2030

Chart on France - Market size and forecast 2025-2030 ($ million)
Data Table on France - Market size and forecast 2025-2030 ($ million)
Chart on France - Year-over-year growth 2025-2030 (%)
Data Table on France - Year-over-year growth 2025-2030 (%)

12.4.4 The Netherlands - Market size and forecast 2025-2030

Chart on The Netherlands - Market size and forecast 2025-2030 ($ million)
Data Table on The Netherlands - Market size and forecast 2025-2030 ($ million)
Chart on The Netherlands - Year-over-year growth 2025-2030 (%)
Data Table on The Netherlands - Year-over-year growth 2025-2030 (%)

12.4.5 Italy - Market size and forecast 2025-2030

Chart on Italy - Market size and forecast 2025-2030 ($ million)
Data Table on Italy - Market size and forecast 2025-2030 ($ million)
Chart on Italy - Year-over-year growth 2025-2030 (%)
Data Table on Italy - Year-over-year growth 2025-2030 (%)

12.4.6 Spain - Market size and forecast 2025-2030

Chart on Spain - Market size and forecast 2025-2030 ($ million)
Data Table on Spain - Market size and forecast 2025-2030 ($ million)
Chart on Spain - Year-over-year growth 2025-2030 (%)
Data Table on Spain - Year-over-year growth 2025-2030 (%)

12.5 APAC - Market size and forecast 2025-2030

Chart on APAC - Market size and forecast 2025-2030 ($ million)
Data Table on APAC - Market size and forecast 2025-2030 ($ million)
Chart on APAC - Year-over-year growth 2025-2030 (%)
Data Table on APAC - Year-over-year growth 2025-2030 (%)
Chart on Regional Comparison - APAC
Data Table on Regional Comparison - APAC

12.5.1 China - Market size and forecast 2025-2030

Chart on China - Market size and forecast 2025-2030 ($ million)
Data Table on China - Market size and forecast 2025-2030 ($ million)
Chart on China - Year-over-year growth 2025-2030 (%)
Data Table on China - Year-over-year growth 2025-2030 (%)

12.5.2 Japan - Market size and forecast 2025-2030

Chart on Japan - Market size and forecast 2025-2030 ($ million)
Data Table on Japan - Market size and forecast 2025-2030 ($ million)
Chart on Japan - Year-over-year growth 2025-2030 (%)
Data Table on Japan - Year-over-year growth 2025-2030 (%)

12.5.3 India - Market size and forecast 2025-2030

Chart on India - Market size and forecast 2025-2030 ($ million)
Data Table on India - Market size and forecast 2025-2030 ($ million)
Chart on India - Year-over-year growth 2025-2030 (%)
Data Table on India - Year-over-year growth 2025-2030 (%)

12.5.4 South Korea - Market size and forecast 2025-2030

Chart on South Korea - Market size and forecast 2025-2030 ($ million)
Data Table on South Korea - Market size and forecast 2025-2030 ($ million)
Chart on South Korea - Year-over-year growth 2025-2030 (%)
Data Table on South Korea - Year-over-year growth 2025-2030 (%)

12.5.5 Australia - Market size and forecast 2025-2030

Chart on Australia - Market size and forecast 2025-2030 ($ million)
Data Table on Australia - Market size and forecast 2025-2030 ($ million)
Chart on Australia - Year-over-year growth 2025-2030 (%)
Data Table on Australia - Year-over-year growth 2025-2030 (%)

12.5.6 Indonesia - Market size and forecast 2025-2030

Chart on Indonesia - Market size and forecast 2025-2030 ($ million)
Data Table on Indonesia - Market size and forecast 2025-2030 ($ million)
Chart on Indonesia - Year-over-year growth 2025-2030 (%)
Data Table on Indonesia - Year-over-year growth 2025-2030 (%)

12.6 South America - Market size and forecast 2025-2030

Chart on South America - Market size and forecast 2025-2030 ($ million)
Data Table on South America - Market size and forecast 2025-2030 ($ million)
Chart on South America - Year-over-year growth 2025-2030 (%)
Data Table on South America - Year-over-year growth 2025-2030 (%)
Chart on Regional Comparison - South America
Data Table on Regional Comparison - South America

12.6.1 Brazil - Market size and forecast 2025-2030

Chart on Brazil - Market size and forecast 2025-2030 ($ million)
Data Table on Brazil - Market size and forecast 2025-2030 ($ million)
Chart on Brazil - Year-over-year growth 2025-2030 (%)
Data Table on Brazil - Year-over-year growth 2025-2030 (%)

12.6.2 Argentina - Market size and forecast 2025-2030

Chart on Argentina - Market size and forecast 2025-2030 ($ million)
Data Table on Argentina - Market size and forecast 2025-2030 ($ million)
Chart on Argentina - Year-over-year growth 2025-2030 (%)
Data Table on Argentina - Year-over-year growth 2025-2030 (%)

12.6.3 Colombia - Market size and forecast 2025-2030

Chart on Colombia - Market size and forecast 2025-2030 ($ million)
Data Table on Colombia - Market size and forecast 2025-2030 ($ million)
Chart on Colombia - Year-over-year growth 2025-2030 (%)
Data Table on Colombia - Year-over-year growth 2025-2030 (%)

12.7 Middle East and Africa - Market size and forecast 2025-2030

Chart on Middle East and Africa - Market size and forecast 2025-2030 ($ million)
Data Table on Middle East and Africa - Market size and forecast 2025-2030 ($ million)
Chart on Middle East and Africa - Year-over-year growth 2025-2030 (%)
Data Table on Middle East and Africa - Year-over-year growth 2025-2030 (%)
Chart on Regional Comparison - Middle East and Africa
Data Table on Regional Comparison - Middle East and Africa

12.7.1 Saudi Arabia - Market size and forecast 2025-2030

Chart on Saudi Arabia - Market size and forecast 2025-2030 ($ million)
Data Table on Saudi Arabia - Market size and forecast 2025-2030 ($ million)
Chart on Saudi Arabia - Year-over-year growth 2025-2030 (%)
Data Table on Saudi Arabia - Year-over-year growth 2025-2030 (%)

12.7.2 UAE - Market size and forecast 2025-2030

Chart on UAE - Market size and forecast 2025-2030 ($ million)
Data Table on UAE - Market size and forecast 2025-2030 ($ million)
Chart on UAE - Year-over-year growth 2025-2030 (%)
Data Table on UAE - Year-over-year growth 2025-2030 (%)

12.7.3 South Africa - Market size and forecast 2025-2030

Chart on South Africa - Market size and forecast 2025-2030 ($ million)
Data Table on South Africa - Market size and forecast 2025-2030 ($ million)
Chart on South Africa - Year-over-year growth 2025-2030 (%)
Data Table on South Africa - Year-over-year growth 2025-2030 (%)

12.7.4 Israel - Market size and forecast 2025-2030

Chart on Israel - Market size and forecast 2025-2030 ($ million)
Data Table on Israel - Market size and forecast 2025-2030 ($ million)
Chart on Israel - Year-over-year growth 2025-2030 (%)
Data Table on Israel - Year-over-year growth 2025-2030 (%)

12.7.5 Turkey - Market size and forecast 2025-2030

Chart on Turkey - Market size and forecast 2025-2030 ($ million)
Data Table on Turkey - Market size and forecast 2025-2030 ($ million)
Chart on Turkey - Year-over-year growth 2025-2030 (%)
Data Table on Turkey - Year-over-year growth 2025-2030 (%)

12.8 Market opportunity by geography

Market opportunity by geography ($ million)
Data Tables on Market opportunity by geography ($ million)

13. Drivers, Challenges, and Opportunity

13.1 Market drivers

Exponential growth of renewable energy integration and resultant grid backlogs
Regulatory mandates and policy reforms for grid modernization
Technological advancements in predictive modeling and high-performance computing

13.2 Market challenges

Data fragmentation and absence of unified standardization protocols
Heightened cybersecurity risks and vulnerability of autonomous grid systems
Chronic scarcity of specialized talent and high cost of computational infrastructure

13.3 Impact of drivers and challenges

Impact of drivers and challenges in 2025 and 2030

13.4 Market opportunities

Proliferation of digital twin environments for dynamic grid simulation and predictive impact analysis
Transition toward automated cluster-based methodologies for enhanced queue efficiency
Integration of AI-enabled grid-enhancing technologies to maximize existing infrastructure capacity

14. Competitive Landscape

14.1 Overview

14.2

Overview on criticality of inputs and factors of differentiation

14.3 Landscape disruption

Overview on factors of disruption

14.4 Industry risks

Impact of key risks on business

15. Competitive Analysis

15.1 Companies profiled

Companies covered

15.2 Company ranking index

15.3 Market positioning of companies

Matrix on companies position and classification

15.4 ANSYS Inc.

ANSYS Inc. - Overview
ANSYS Inc. - Business segments
ANSYS Inc. - Key offerings
ANSYS Inc. - Segment focus
SWOT

15.5 Camus Energy

Camus Energy - Overview
Camus Energy - Product / Service
Camus Energy - Key offerings
SWOT

15.6 Enverus Inc.

Enverus Inc. - Overview
Enverus Inc. - Product / Service
Enverus Inc. - Key offerings
SWOT

15.7 GE Vernova Inc.

GE Vernova Inc. - Overview
GE Vernova Inc. - Business segments
GE Vernova Inc. - Key offerings
GE Vernova Inc. - Segment focus
SWOT

15.8 Hitachi Energy Ltd.

Hitachi Energy Ltd. - Overview
Hitachi Energy Ltd. - Product / Service
Hitachi Energy Ltd. - Key offerings
SWOT

15.9 Kevala Technologies Inc.

Kevala Technologies Inc. - Overview
Kevala Technologies Inc. - Product / Service
Kevala Technologies Inc. - Key offerings
SWOT

15.10 Neara

Neara - Overview
Neara - Product / Service
Neara - Key offerings
SWOT

15.11 Pearl Street Technologies Inc.

Pearl Street Technologies Inc. - Overview
Pearl Street Technologies Inc. - Product / Service
Pearl Street Technologies Inc. - Key offerings
SWOT

15.12 PXiSE Energy Solutions

PXiSE Energy Solutions - Overview
PXiSE Energy Solutions - Product / Service
PXiSE Energy Solutions - Key offerings
SWOT

15.13 Resource Innovations

Resource Innovations - Overview
Resource Innovations - Product / Service
Resource Innovations - Key offerings
SWOT

15.14 REsurety Inc

REsurety Inc - Overview
REsurety Inc - Product / Service
REsurety Inc - Key offerings
SWOT

15.15 S and P Global Inc.

S and P Global Inc. - Overview
S and P Global Inc. - Business segments
S and P Global Inc. - Key offerings
S and P Global Inc. - Segment focus
SWOT

15.16 Schneider Electric SE

Schneider Electric SE - Overview
Schneider Electric SE - Business segments
Schneider Electric SE - Key news
Schneider Electric SE - Key offerings
Schneider Electric SE - Segment focus
SWOT

15.17 Siemens AG

Siemens AG - Overview
Siemens AG - Business segments
Siemens AG - Key news
Siemens AG - Key offerings
Siemens AG - Segment focus
SWOT

15.18 Wood Mackenzie

Wood Mackenzie - Overview
Wood Mackenzie - Product / Service
Wood Mackenzie - Key offerings
SWOT

16. Appendix

16.1 Scope of the report

Market definition
Objectives
Notes and caveats

16.2 Inclusions and exclusions checklist

Inclusions checklist
Exclusions checklist

16.3 Currency conversion rates for US$

16.4 Research methodology

16.5 Data procurement

Information sources

16.6 Data validation

16.7 Validation techniques employed for market sizing

16.8 Data synthesis

16.9 360 degree market analysis

16.10 List of abbreviations

Research Methodology

Technavio presents a detailed picture of the market by way of study, synthesis, and summation of data from multiple sources. The analysts have presented the various facets of the market with a particular focus on identifying the key industry influencers. The data thus presented is comprehensive, reliable, and the result of extensive research, both primary and secondary.

INFORMATION SOURCES

Primary sources

  • Manufacturers and suppliers
  • Channel partners
  • Industry experts
  • Strategic decision makers

Secondary sources

  • Industry journals and periodicals
  • Government data
  • Financial reports of key industry players
  • Historical data
  • Press releases

DATA ANALYSIS

Data Synthesis

  • Collation of data
  • Estimation of key figures
  • Analysis of derived insights

Data Validation

  • Triangulation with data models
  • Reference against proprietary databases
  • Corroboration with industry experts

REPORT WRITING

Qualitative

  • Market drivers
  • Market challenges
  • Market trends
  • Five forces analysis

Quantitative

  • Market size and forecast
  • Market segmentation
  • Geographical insights
  • Competitive landscape

Interested in this report?

Get your sample now to see our research methodology and insights!

Download Now

Frequently Asked Questions

Grid Interconnection Queue Analytics Ai market growth will increase by USD 2282.4 million during 2026-2030.

The Grid Interconnection Queue Analytics Ai market is expected to grow at a CAGR of 22.7% during 2026-2030.

Grid Interconnection Queue Analytics Ai market is segmented by Component (Software, Services, Hardware) Application (Renewable energy integration, Grid planning and optimization, Transmission and distribution management, Forecasting and scheduling, Others) Deployment (Cloud-based, On-premises)

ANSYS Inc., Camus Energy, DNV Group AS, Energy Toolbase, Enverus Inc., GE Vernova Inc., GridUnity Inc., Hitachi Energy Ltd., Invenia Technical Computing, Kevala Technologies Inc., LevelTen Energy, Neara, Pearl Street Technologies Inc., PXiSE Energy Solutions, Resource Innovations, REsurety Inc, S and P Global Inc., Schneider Electric SE, Siemens AG, Wood Mackenzie are a few of the key vendors in the Grid Interconnection Queue Analytics Ai market.

North America will register the highest growth rate of 37.5% among the other regions. Therefore, the Grid Interconnection Queue Analytics Ai market in North America is expected to garner significant business opportunities for the vendors during the forecast period.

US, Canada, Mexico, Germany, UK, France, The Netherlands, Italy, Spain, China, Japan, India, South Korea, Australia, Indonesia, Brazil, Argentina, Colombia, Saudi Arabia, UAE, South Africa, Israel, Turkey

  • Exponential growth of renewable energy integration and resultant grid backlogs is the driving factor this market.

The Grid Interconnection Queue Analytics Ai market vendors should focus on grabbing business opportunities from the Component segment as it accounted for the largest market share in the base year.
RIA - Research AI Assistant
Ask RIA