
Group Purchasing Organization Service Market Size 2024-2028
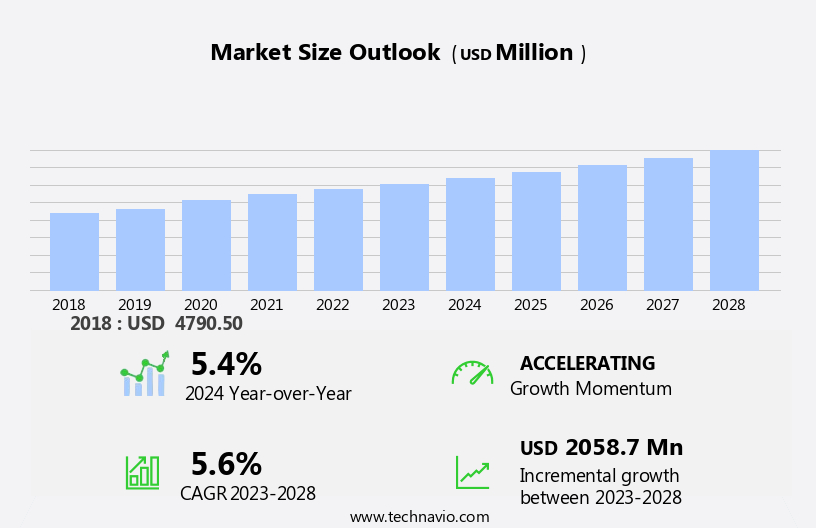
The group purchasing organization service market size is forecast to increase by USD 2.06 billion at a CAGR of 5.6% between 2023 and 2028.
- The market is experiencing significant growth due to several key drivers. One major factor is the ability to achieve cost savings and operational efficiency through bulk purchasing of office supplies, IT and technology, and facilities management services. Another trend is the digital transformation in GPO services, which includes the use of advanced technologies such as artificial intelligence, machine learning, and data analytics to enhance operational efficiency and member experience.
- Managing diverse member needs is also a significant challenge for GPOs, requiring them to offer customized solutions and adapt to various industries and sectors. These trends and challenges are shaping the future of the GPO service market and driving innovation and growth in the industry.
What will be the Size of the Market During the Forecast Period?
- Group Purchasing Organizations (GPOs) have emerged as essential players in the healthcare sector, enabling strategic sourcing and cost management through collective buying power. By leveraging digital platforms and data analytics, these organizations facilitate the procurement of healthcare supplies, office supplies, and software, among other essential items. GPOs provide access to a wide range of products, including advanced medical equipment like endoscopes and bronchoscopes, ensuring healthcare providers have access to the latest technology while minimizing costs. GPO services play a pivotal role in the healthcare sector by offering cost management solutions, budget optimization, and strategic sourcing through digital platforms and data analytics. These organizations help healthcare providers navigate the intricacies of the supply chain, fostering strong supplier relationships and ensuring access to essential supplies while maximizing efficiency and ROI.
- Furthermore, digital technologies have revolutionized the way GPOs operate. Digital tools and automation have simplified the procurement process, making it more efficient and effective. This, in turn, helps healthcare organizations focus on their core mission â delivering high-quality care. The complexity of the healthcare supply chain necessitates strong supplier relationships. GPOs foster these relationships, ensuring a steady supply of critical items such as endoscopes and bronchoscopes. By consolidating demand, GPOs can negotiate favorable contracts and pass on the savings to their members. The ROI of GPO membership is significant. By pooling resources and expertise, these organizations enable their members to achieve cost savings, improve operational efficiency, and enhance the quality of care delivery models.
Market Segmentation
The market research report provides comprehensive data (region-wise segment analysis), with forecasts and estimates in "USD billion" for the period 2024-2028, as well as historical data from 2018-2022 for the following segments.
- Type
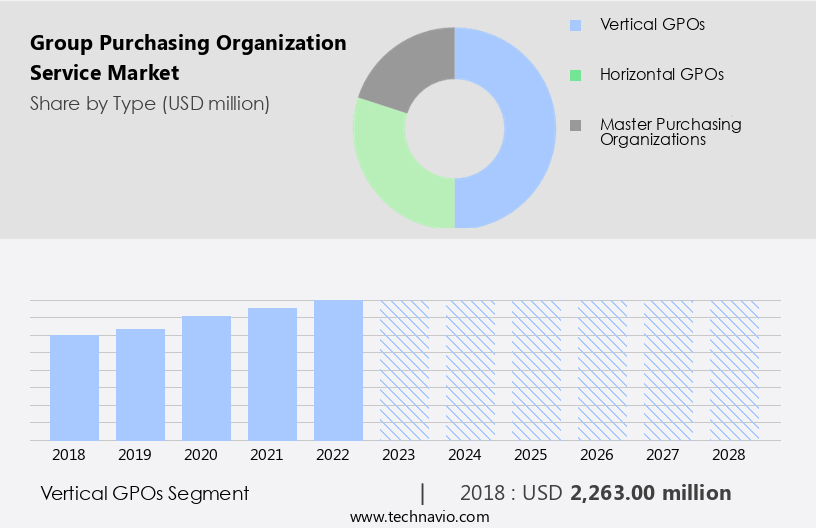
- Vertical GPOs
- Horizontal GPOs
- Master purchasing organizations
- End-user
- Healthcare
- Hospitality
- Food and beverages
- Industrial
- Others
- Geography
- North America
- Canada
- US
- Europe
- Germany
- UK
- APAC
- China
- Japan
- Middle East and Africa
- South America
- North America
By Type Insights
The vertical GPOS segment is estimated to witness significant growth during the forecast period. Group Purchasing Organizations (GPOs) cater to various industries by harnessing the power of collective buying to secure favorable contracts. In the healthcare sector, GPOs help hospitals and clinics manage high costs and regulatory requirements by procuring medical supplies and pharmaceuticals. The hospitality industry benefits from GPOs through bulk purchases of food, beverages, and operational supplies, enabling cost control and ensuring quality. Retail businesses turn to GPOs for competitive pricing on inventory, technology, and supplies, while optimizing their supply chain management. Digital technologies and platforms play a pivotal role in GPOs' operations. Data analytics helps in identifying trends, forecasting demand, and optimizing inventory levels.
Furthermore, GPOs offer additional services such as Training and Support and Advisory Services to enhance member value. Software solutions, including Automation, are integral to GPO operations, streamlining supply chain processes and improving Return on Investment (ROI). In the healthcare industry, this translates to better management of endoscopes and bronchoscopes, ensuring patient safety and regulatory compliance. Direct procurement and consulting services further enhance their value proposition. Overall, GPOs contribute significantly to the healthcare sector by streamlining procurement processes, reducing costs, and improving operational efficiency.
Get a glance at the share of various segments. Request Free Sample
The vertical GPOs segment accounted for USD 2.26 billion in 2018 and showed a gradual increase during the forecast period.
Regional Insights
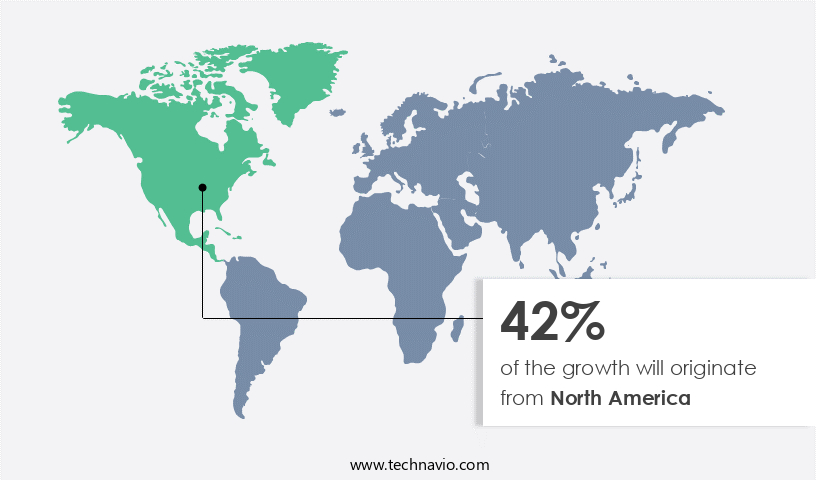
North America is estimated to contribute 42% to the growth of the global market during the forecast period. Technavio's analysts have elaborately explained the regional trends and drivers that shape the market during the forecast period.
For more insights on the market share of various regions Request Free Sample
In North America, the market is witnessing significant growth due to the increasing demand for cost savings and efficient procurement strategies across various industries. The healthcare sector in the US and Canada is a major driver of this market expansion, as hospitals, clinics, and healthcare providers heavily rely on GPOs to secure competitive pricing for medical supplies, pharmaceuticals, and services. This is particularly important given the rising healthcare costs in these countries. Beyond healthcare, the manufacturing and food service industries in the US and Canada are also significant contributors to the GPO market. These industries are leveraging GPOs to simplify complex supply chain processes, decrease procurement expenses, and boost operational productivity.
Moreover, GPOs cater to diverse industries, including healthcare, where they provide supply chain solutions for medical equipment like endoscopes, bronchoscopes, and rhinolaryngoscopes. Organizational strategy is a crucial aspect of GPO services, with offerings in supplier management, strategic alliances, and recruitment of skilled personnel. Procurement-to-Pay (P2P) solutions are also popular, enabling small, medium, and large enterprises in industries such as industrial and agricultural sectors to streamline their procurement processes.
Market Dynamics
Our researchers analyzed the data with 2023 as the base year, along with the key drivers, trends, and challenges. A holistic analysis of drivers will help companies refine their marketing strategies to gain a competitive advantage.
Market Driver
Advantage in cost savings and efficiency is the key driver of the market. Group Purchasing Organizations (GPOs) offer significant cost savings and operational efficiencies for businesses in various industries. Horizontal GPOs, which serve multiple industries, and Vertical GPOs, which focus on specific sectors like medical equipment or food procurement, provide a platform for organizations to pool their purchasing power. This collective strength enables members to negotiate more favorable contracts with suppliers, securing discounts and improved terms. GPO services automate and centralize procurement activities, minimizing manual errors, administrative burdens, and time-consuming negotiations. The benefits of using GPO services include cost savings of 10% to 25% on procurement expenses, depending on the industry and scale of operations.
Furthermore, these savings stem from the ability to negotiate bulk discounts, optimize supplier relationships, and access real-time market data. Additionally, companies report substantial efficiency gains, with improvements of up to 30% in procurement cycle times and operational workflows. In the fragmented healthcare industry, for instance, GPOs have proven particularly valuable in streamlining medical services procurement, enabling cost savings and improving patient care.
Market Trends
Digital transformation in GPO services is the upcoming trend in the market. Group purchasing organizations (GPOs) are undergoing digital transformation, revolutionizing their operations and enhancing member value. This evolution incorporates technology into GPO processes to boost efficiency, inform decision-making, and offer superior services. A prime illustration of this digital shift in GPO services is Premier Inc.'s offerings. In September 2023, they unveiled Premier SmartPO, an innovative digital purchasing platform. This tool streamlines tasks like purchase order processing and delivers real-time data and analytics. The objective is to optimize procurement costs and operational efficiency for various healthcare settings. By embracing technology, GPOs are able to provide more value-added services and remain competitive in today's market. In addition, this digital transformation encompasses areas such as office supplies, IT and technology, facilities management, direct procurement, consulting services, data security, and more.
Market Challenge
Managing diverse member needs is a key challenge affecting the market growth. In the intricate landscape of the Group Purchasing Organization (GPO) service market, catering to the distinct procurement demands of diverse member organizations is a pivotal challenge. Comprised of entities from various sectors, each member organization brings unique procurement specifications, regulatory obligations, and operational priorities to the table. Consequently, optimally addressing these varying needs while preserving overall efficiency and cost savings is a complex endeavor. One of the primary considerations is the tailoring of procurement processes to accommodate individual member organizations. For instance, healthcare providers necessitate adherence to stringent regulatory standards, whereas manufacturing companies place greater emphasis on supply chain efficiency and cost reduction.
Furthermore, to effectively meet these disparate needs, GPO services must maintain a balance between customization and standardization. Digital tools play a crucial role in this endeavor. They enable GPOs to streamline procurement processes, manage supplier relationships, and optimize budgets. By leveraging advanced technologies, GPOs can provide members with real-time visibility into their supply chain, facilitate seamless communication with suppliers, and ensure regulatory compliance. Moreover, these tools help in managing the complexity of the supply chain, allowing GPOs to offer cost savings and value-added services to their members. In summary, the GPO service market demands a flexible and adaptable approach to cater to the diverse needs of member organizations while maintaining overall efficiency and cost savings. Digital tools serve as essential enablers, providing the necessary capabilities to manage supplier relationships, optimize budgets, and ensure regulatory compliance.
Exclusive Customer Landscape
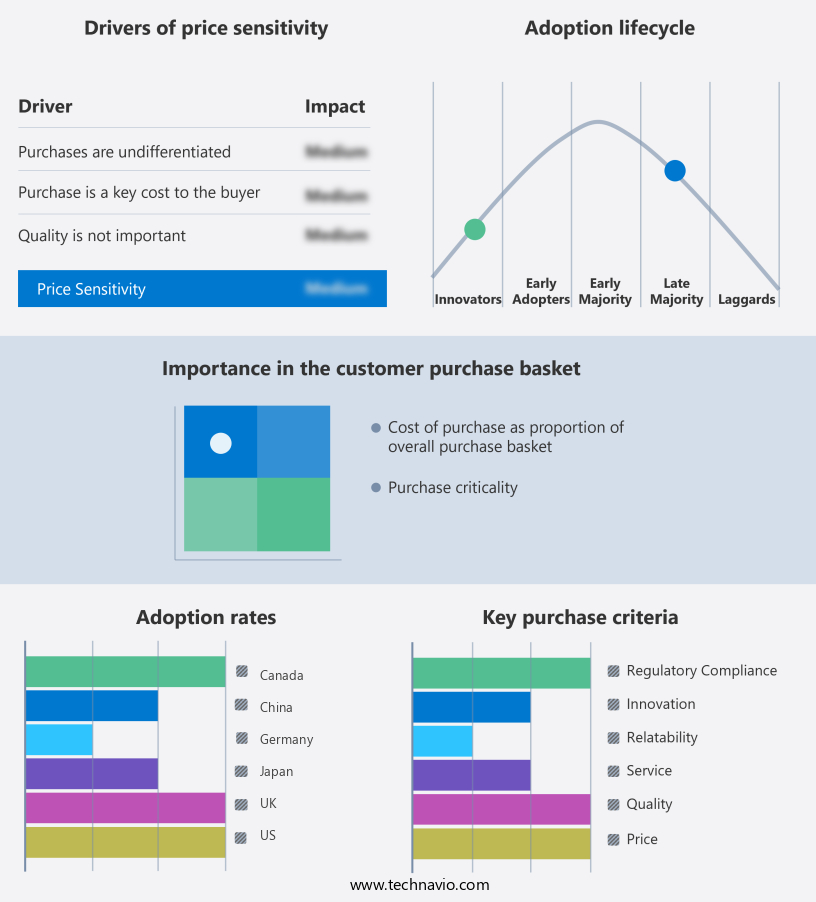
The market forecasting report includes the adoption lifecycle of the market, covering from the innovator's stage to the laggard's stage. It focuses on adoption rates in different regions based on penetration. Furthermore, the report also includes key purchase criteria and drivers of price sensitivity to help companies evaluate and develop their market growth analysis strategies.
Customer Landscape
Key Companies & Market Insights
Companies are implementing various strategies, such as strategic alliances, partnerships, mergers and acquisitions, geographical expansion, and product/service launches, to enhance their presence in the market.
Centerpoint Group LLC - The company offers group purchasing organization services for different categories such as office supplies, MRO and industrial supplies, wireless telecom, recycling and waste management and others.
The market research and growth report includes detailed analyses of the competitive landscape of the market and information about key companies, including:
- Clarity Ventures Inc.
- CNECT Inc.
- Compass Group Plc
- Corcentric Inc.
- CPG
- DSSI
- The Health Collaborative
- HPS LLC
- LBMC
- McKesson Corp.
- OMNIA Partners
- Pandion Optimization Alliance
- Planergy
- Premier Inc.
- Procure Analytics
- The Health Collaborative
- Treya Partners.
- UNA
- Vizient Inc.
Qualitative and quantitative analysis of companies has been conducted to help clients understand the wider business environment as well as the strengths and weaknesses of key market players. Data is qualitatively analyzed to categorize companies as pure play, category-focused, industry-focused, and diversified; it is quantitatively analyzed to categorize companies as dominant, leading, strong, tentative, and weak.
Research Analyst Overview
In the dynamic and complex healthcare sector, Group Purchasing Organizations (GPOs) have emerged as valuable partners for healthcare providers in optimizing their procurement strategies. By leveraging the collective buying power of its members, a GPO can negotiate favorable contracts for medical equipment, food procurement, medical services, office supplies, IT and technology, facilities management, and more. The use of digital platforms and data analytics enables data-driven optimization and predictive purchasing strategies, enhancing operational efficiency and cost reduction. GPOs cater to both horizontal and vertical markets, offering solutions for IT and technology, facilities management, consulting services, and more. Horizontal GPOs cater to various industries, while vertical GPOs focus on specific sectors, such as healthcare. GPOs provide strategic sourcing, contract management, training and support, advisory services, and purchasing power, allowing healthcare providers to focus on their core competencies.
Furthermore, the fragmented healthcare sector benefits from the cost management and budget optimization offered by GPOs, enabling them to maintain operational efficiency and improve ROI through automation and software solutions. GPOs facilitate supplier relationships, ensuring cost-effective contracts and bulk purchases, while offering consulting services, data security, and operational excellence. Small, medium, and large enterprises across industrial, agricultural, and service sectors can benefit from the expertise and strategic alliances of GPOs, enabling them to recruit skilled personnel and manage their procurement-to-pay processes effectively.
|
Market Scope |
|
|
Report Coverage |
Details |
|
Page number |
200 |
|
Base year |
2023 |
|
Historic period |
2018-2022 |
|
Forecast period |
2024-2028 |
|
Growth momentum & CAGR |
Accelerate at a CAGR of 5.6% |
|
Market growth 2024-2028 |
USD 2.06 billion |
|
Market structure |
Fragmented |
|
YoY growth 2023-2024(%) |
5.4 |
|
Regional analysis |
North America, Europe, APAC, Middle East and Africa, and South America |
|
Performing market contribution |
North America at 42% |
|
Key countries |
US, China, Germany, UK, Canada, and Japan |
|
Competitive landscape |
Leading Companies, Market Positioning of Companies, Competitive Strategies, and Industry Risks |
|
Key companies profiled |
Centerpoint Group LLC, Clarity Ventures Inc., CNECT Inc., Compass Group Plc, Corcentric Inc., CPG, DSSI, The Health Collaborative, HPS LLC, LBMC, McKesson Corp., OMNIA Partners, Pandion Optimization Alliance, Planergy, Premier Inc., Procure Analytics, The Health Collaborative, Treya Partners., UNA, and Vizient Inc. |
|
Market dynamics |
Parent market analysis, market growth inducers and obstacles, market forecast, fast-growing and slow-growing segment analysis, COVID-19 impact and recovery analysis and future consumer dynamics, market condition analysis for the forecast period |
|
Customization purview |
If our market report has not included the data that you are looking for, you can reach out to our analysts and get segments customized. |
What are the Key Data Covered in this Market Research and Growth Report?
- CAGR of the market during the forecast period
- Detailed information on factors that will drive the market growth and forecasting between 2024 and 2028
- Precise estimation of the size of the market and its contribution of the market in focus to the parent market
- Accurate predictions about upcoming market growth and trends and changes in consumer behaviour
- Growth of the market across North America, Europe, APAC, Middle East and Africa, and South America
- Thorough analysis of the market's competitive landscape and detailed information about companies
- Comprehensive analysis of factors that will challenge the growth of market companies
We can help! Our analysts can customize this market research report to meet your requirements. Get in touch
 RIA -
RIA - 
