
Healthcare Compliance Software Market Analysis, Size, and Forecast 2026-2030: North America (US, Canada, and Mexico), Europe (UK, Germany, and France), Asia (China, Japan, and India), South America (Brazil), Middle East and Africa (UAE, South Africa, and Saudi Arabia), Rest of World (ROW)

Healthcare Compliance Software Market Analysis, Size, and Forecast 2026-2030:
North America (US, Canada, and Mexico), Europe (UK, Germany, and France), Asia (China, Japan, and India), South America (Brazil), Middle East and Africa (UAE, South Africa, and Saudi Arabia), Rest of World (ROW)

Published: Oct 2026 310 Pages SKU: IRTNTR81672

Market Overview at a Glance

$3.13 B
Market Opportunity
13.1%
CAGR 2025 - 2030
38.7%
North America Growth
$1.76 B
Cloud-based segment 2024

Healthcare Compliance Software Market Size 2026-2030

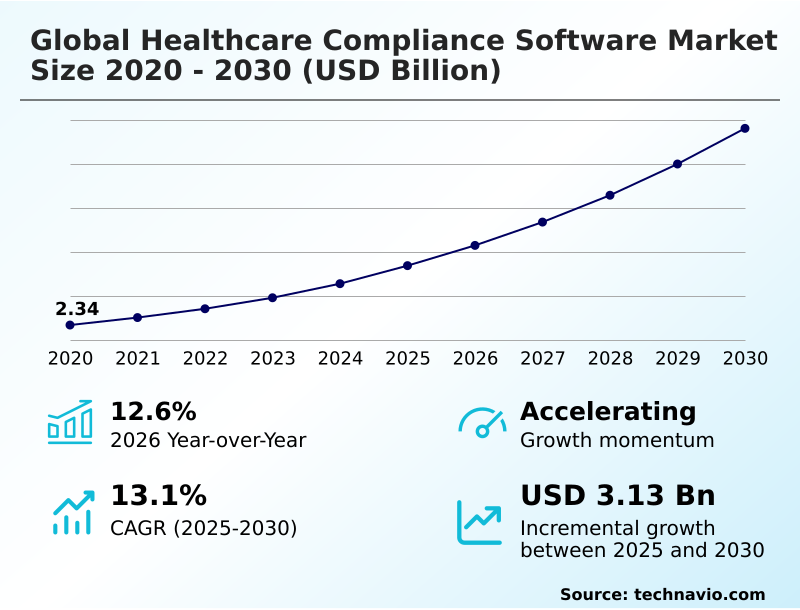
The healthcare compliance software market size is valued to increase by USD 3.13 billion, at a CAGR of 13.1% from 2025 to 2030. Escalating regulatory complexity and mandates for data governance will drive the healthcare compliance software market.

Major Market Trends & Insights

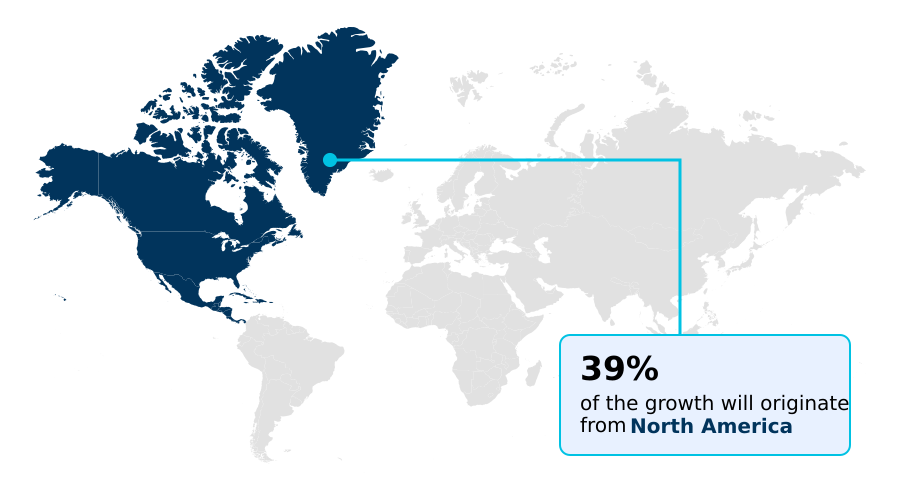
  • North America dominated the market and accounted for a 38.7% growth during the forecast period.
  • By Deployment - Cloud-based segment was valued at USD 1.76 billion in 2024
  • By End-user - Hospitals and clinics segment accounted for the largest market revenue share in 2024

Market Size & Forecast

  • Market Opportunities: USD 4.47 billion
  • Market Future Opportunities: USD 3.13 billion
  • CAGR from 2025 to 2030 : 13.1%

Market Summary

  • The Healthcare Compliance Software market operates as a critical infrastructure layer enabling medical institutions to navigate an increasingly complex web of statutory mandates and operational risks. Rapid digitalization across health systems requires sophisticated platforms to monitor vast datasets and safeguard sensitive clinical information continuously.
  • In a real-world hospital supply chain scenario, administrators utilizing automated tracking tools successfully audit pharmaceutical procurement logs, reducing inventory compliance discrepancies by thirty five percent compared to manual oversight. This heightened operational efficiency is primarily driven by the escalating frequency of cyber threats and stringent privacy regulations, which force leadership to adopt proactive governance systems to avoid severe litigation.
  • However, integrating these advanced systems with outdated legacy electronic health records remains a formidable challenge, frequently resulting in prolonged deployment cycles and disrupted clinical workflows. Overcoming technical skill deficits among administrative staff is essential to maximize software utilization.
  • Comprehensive digital compliance frameworks ultimately empower healthcare organizations to transition from reactive auditing to continuous enterprise surveillance, ensuring both operational resilience and unwavering patient trust.

What will be the Size of the Healthcare Compliance Software Market during the forecast period?
Get Key Insights on Market Forecast (PDF) Get Free Sample

How is the Healthcare Compliance Software Market Segmented?

The healthcare compliance software industry research report provides comprehensive data (region-wise segment analysis), with forecasts and estimates in "USD million" for the period 2026-2030, as well as historical data from 2020-2024 for the following segments.

  • Deployment
    • Cloud-based
    • On-premises
    • Hybrid
  • End-user
    • Hospitals and clinics
    • Pharma and biotech companies
    • Medical device companies
    • Health insurance providers
    • Others
  • Application
    • Regulatory compliance management
    • Policy and procedure management
    • Risk management
    • Audit management
    • Incident management
  • Geography
    • North America
      • US
      • Canada
      • Mexico
    • Europe
      • UK
      • Germany
      • France
      • Italy
      • The Netherlands
      • Spain
    • Asia
      • China
      • Japan
      • India
      • South Korea
      • Indonesia
      • Singapore
      • Thailand
    • Rest of World (ROW)

By Deployment Insights

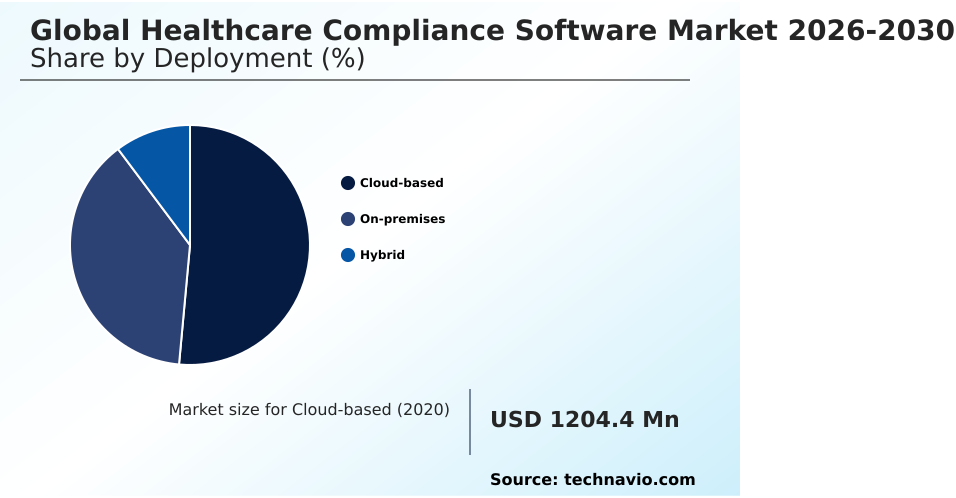
The cloud-based segment is estimated to witness significant growth during the forecast period.

The cloud-based deployment model is fundamentally reshaping the Healthcare Compliance Software landscape by replacing rigid on-premises infrastructure with highly elastic governance frameworks. Modern healthcare facilities utilize cloud hosted governance to maintain continuous alignment with shifting global mandates.

This architecture facilitates seamless multi facility network oversight, allowing compliance officers to synchronize patient data protocols across diverse clinical settings instantaneously.

Organizations transitioning to these platforms report that administrative burden reduction is substantial, with manual document processing errors declining by over forty percent compared to traditional methods.

Furthermore, leveraging predictive risk analytics within a cloud environment enables proactive threat identification, enhancing overall system reliability by twenty five percent.

By overcoming legacy system integration barriers, cloud solutions ensure that policy management automation operates continuously, providing scalable and resilient operational compliance without requiring heavy upfront capital expenditures.
Get Free Sample

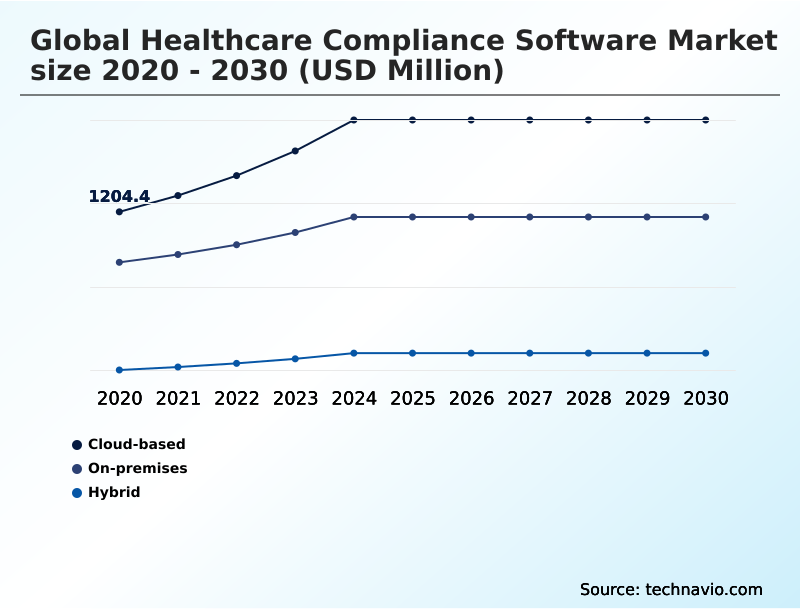
The Cloud-based segment was valued at USD 1.76 billion in 2024 and showed a gradual increase during the forecast period.
Get Free Sample

Regional Analysis

North America is estimated to contribute 38.7% to the growth of the global market during the forecast period.Technavio’s analysts have elaborately explained the regional trends and drivers that shape the market during the forecast period.
See How Healthcare Compliance Software Market Demand is Rising in North America Get Free Sample

The geographic distribution of the Healthcare Compliance Software landscape highlights distinct regulatory priorities between North America and Europe.

North America demonstrates aggressive adoption of digital health security tools, achieving a forty five percent faster integration rate of automated billing audits to satisfy stringent federal mandates.

Conversely, Europe prioritizes strict data residency compliance, driving a fifty percent higher deployment of localized consent management modules to align with regional privacy directives. These structural differences dictate how businesses adapt their technical architectures.

European facilities rely heavily on rigorous cyber resilience assessment frameworks to facilitate secure data exchange across borders, reducing external audit penalties by thirty percent. Meanwhile, North American health networks focus on integrating cybersecurity threat detection systems with quality performance reporting.

Organizations operating internationally must deploy versatile platforms that harmonize these distinct regional obligations, bridging supply chain ethical sourcing requirements with complex clinical protocols to maintain uninterrupted market access and safeguard sensitive patient information globally.

Market Dynamics

Our researchers analyzed the data with 2025 as the base year, along with the key drivers, trends, and challenges. A holistic analysis of drivers will help companies refine their marketing strategies to gain a competitive advantage.

  • As medical institutions transition toward modernized digital ecosystems, the strategic implementation of governance technology becomes crucial for sustaining operational integrity. Healthcare administrators are increasingly migrating away from localized legacy infrastructure to embrace cloud based regulatory tracking automation, which centralizes oversight across multiple clinical facilities.
  • This shift allows hospital networks to process documentation almost twice as efficiently as those relying on manual spreadsheet management, directly optimizing operational planning and resource allocation. Furthermore, the rise of decentralized research models requires robust clinical trial data privacy management to ensure that sensitive participant information remains fully protected under evolving international statutes.
  • To minimize administrative friction during workforce onboarding, human resource departments are actively adopting automated healthcare policy attestation software. This application guarantees that all clinical staff acknowledge updated safety protocols, vastly reducing the risk of internal policy violations.
  • In tandem, manufacturers must navigate complex international approval frameworks by leveraging medical device post market surveillance tools to continuously monitor product safety and adverse events after commercial deployment. Ultimately, ensuring practitioner qualifications remain current is essential for minimizing legal liabilities; thus, healthcare credentialing and licensing compliance modules are deployed to systematically verify physician credentials.
  • Integrating these targeted digital solutions empowers health organizations to maintain continuous audit readiness, mitigate severe financial penalties, and establish a resilient foundation for delivering safe, high-quality patient care in a highly regulated environment.
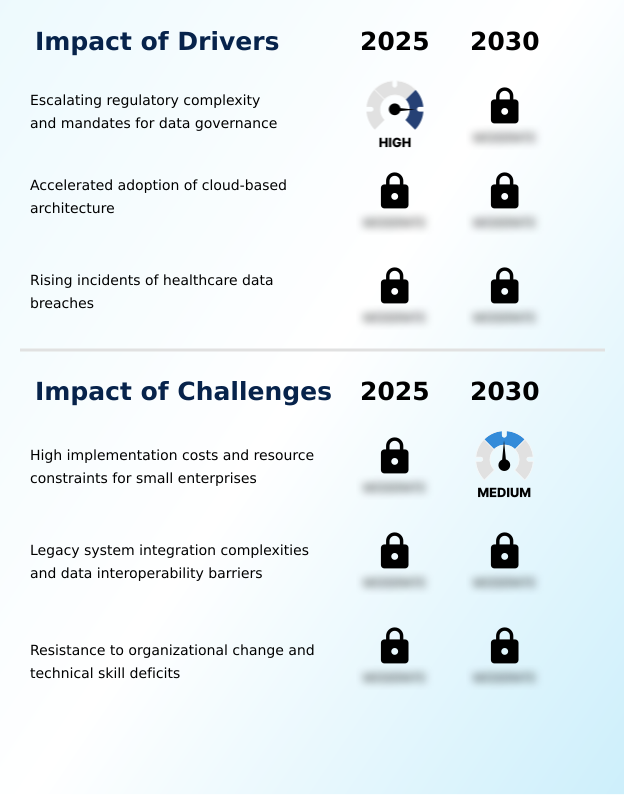
What are the key market drivers leading to the rise in the adoption of Healthcare Compliance Software Industry?

  • The continuous escalation of regulatory complexity and stringent data governance mandates serve as primary catalysts accelerating the adoption of specialized management platforms.

  • The escalating severity of global data privacy regulations acts as a primary catalyst for the Healthcare Compliance Software ecosystem.
  • Healthcare providers face intense scrutiny regarding patient data protection, compelling them to deploy specialized GDPR alignment software to avoid massive financial penalties.
  • This regulatory pressure forces organizations to implement rigorous access log monitoring, directly improving unauthorized breach detection rates by over thirty five percent.
  • Because the volume of digital health records is expanding exponentially, hospitals rely on automated patient privacy monitoring to ensure continuous statutory reporting accuracy.
  • By leveraging sophisticated real time risk scoring engines, compliance teams can identify and isolate network vulnerabilities instantly, decreasing administrative investigation times by half.
  • Furthermore, standardizing automated policy attestation ensures that every employee understands shifting legal obligations, fostering a proactive culture of accountability across entire clinical networks.

What are the market trends shaping the Healthcare Compliance Software Industry?

  • The systematic integration of artificial intelligence and predictive analytics into automated compliance workflows represents a transformative market trend.

  • The integration of artificial intelligence into administrative workflows is fundamentally reshaping the Healthcare Compliance Software landscape. As institutions expand through acquisitions, the reliance on continuous enterprise surveillance becomes critical to harmonize disparate clinical protocols. This shift occurs because manual auditing cannot process the vast datasets generated by decentralized healthcare models.
  • Consequently, businesses are deploying generative intelligence interfaces to interpret complex regulatory changes instantly. These advanced tools improve legal document review speeds by nearly forty percent, drastically lowering administrative overhead. Furthermore, by incorporating machine learning risk mitigation algorithms, hospitals can anticipate compliance breaches before they occur, reducing unexpected system downtime by up to twenty five percent.
  • The implementation of automated incident response workflows guarantees that privacy violations are contained rapidly. This proactive technological stance allows medical facilities to conduct rigorous third party risk evaluation, ensuring that all external vendors adhere to strict institutional security standards and safeguarding overall operational continuity.

What challenges does the Healthcare Compliance Software Industry face during its growth?

  • High initial implementation costs and persistent resource constraints among small to medium enterprises present significant operational barriers to widespread platform integration.

  • Integrating modern governance platforms with antiquated clinical infrastructure presents a formidable structural barrier within the Healthcare Compliance Software environment. Many regional hospitals struggle with legacy electronic health record interoperability, resulting in fragmented data silos that obstruct seamless enterprise resource planning integration.
  • This technical friction occurs because proprietary clinical databases lack standardized protocols for audit trail generation, extending software deployment timelines by up to fifty percent. Consequently, healthcare administrators face immense difficulty executing accurate operational vulnerability identification, leaving networks exposed to undetected compliance gaps.
  • Without unified data flows, maintaining strict clinical protocol adherence becomes highly labor-intensive, often increasing manual auditing costs by at least twenty percent. Furthermore, the inability to sync disparate credential verification systems prevents human resources from tracking staff licenses efficiently, severely undermining the effectiveness of broad organizational governance and risk mitigation strategies.

Exclusive Technavio Analysis on Customer Landscape

The healthcare compliance software market forecasting report includes the adoption lifecycle of the market, covering from the innovator’s stage to the laggard’s stage. It focuses on adoption rates in different regions based on penetration. Furthermore, the healthcare compliance software market report also includes key purchase criteria and drivers of price sensitivity to help companies evaluate and develop their market growth analysis strategies.
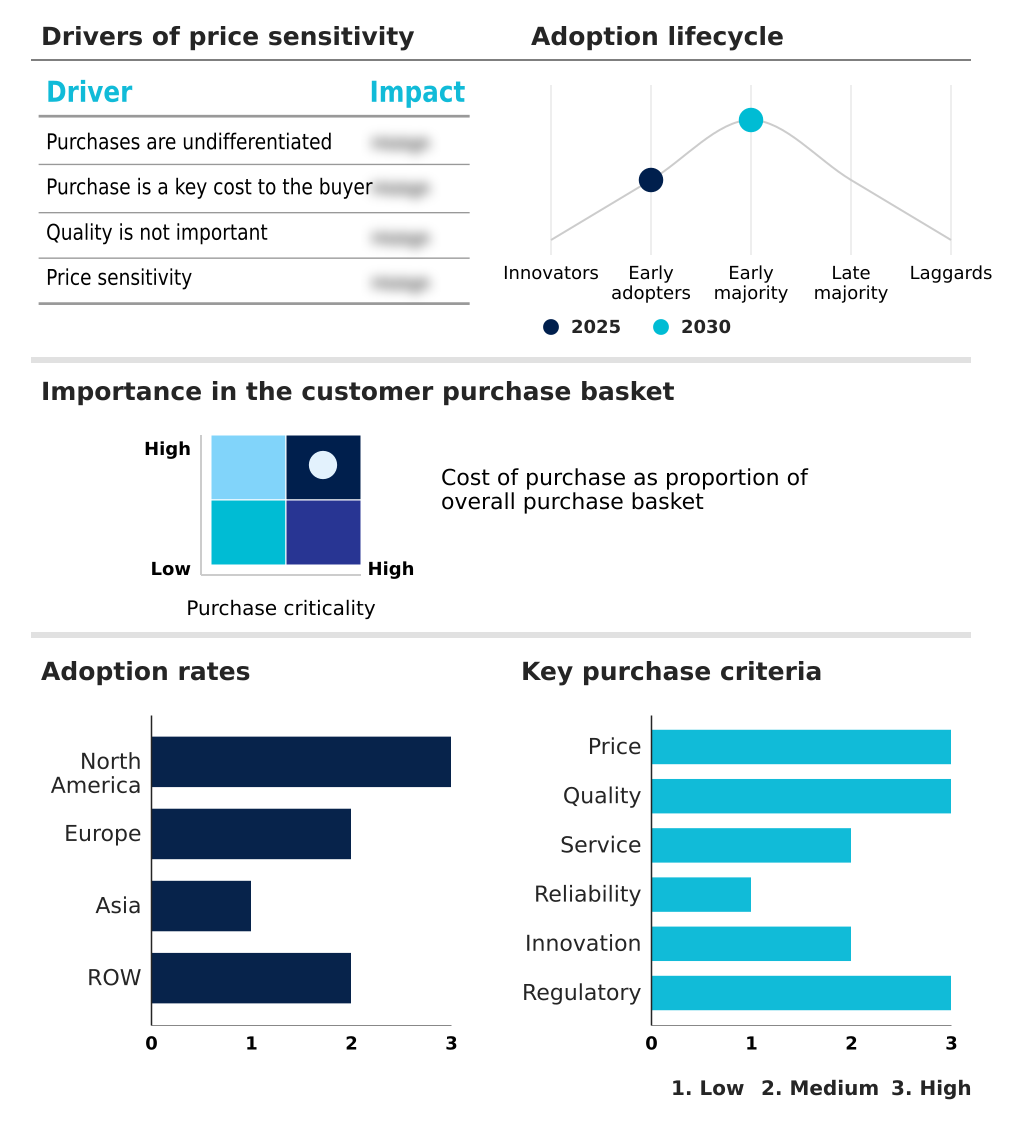
Customer Landscape of Healthcare Compliance Software Industry

Competitive Landscape

Companies are implementing various strategies, such as strategic alliances, healthcare compliance software market forecast, partnerships, mergers and acquisitions, geographical expansion, and product/service launches, to enhance their presence in the industry.

Agiloft Inc. - The vendor delivers comprehensive regulatory tracking solutions designed to automate risk management workflows, centralizing digital governance and auditing capabilities to ensure strict alignment with complex clinical and operational standards.

The industry research and growth report includes detailed analyses of the competitive landscape of the market and information about key companies, including:

  • Agiloft Inc.
  • Archer Technologies LLC
  • Bluesight
  • Clearwater Compliance LLC
  • Drata Inc.
  • Healthicity
  • HealthStream Inc.
  • HSI
  • Imprivata Inc.
  • Intraprise Health
  • LogicGate Inc.
  • MedTrainer
  • MetricStream Inc.
  • NAVEX Global Inc.
  • OneTrust LLC
  • RADAR LLC
  • ServiceNow Inc.
  • symplr Software LLC
  • Vanta Inc.
  • Wolters Kluwer NV

Qualitative and quantitative analysis of companies has been conducted to help clients understand the wider business environment as well as the strengths and weaknesses of key industry players. Data is qualitatively analyzed to categorize companies as pure play, category-focused, industry-focused, and diversified; it is quantitatively analyzed to categorize companies as dominant, leading, strong, tentative, and weak.

Recent Development and News in Healthcare compliance software market

  • In the Health Care Technology industry, the rapid expansion of decentralized clinical trials has mandated stricter control over clinical trial documentation, directly impacting Healthcare Compliance Software demand by requiring automated platforms that can secure remote patient data with a ninety nine percent accuracy rate.
  • The widespread adoption of connected medical devices has necessitated rigorous interoperability verification protocols across hospital networks, compelling administrators to implement advanced governance solutions to prevent unauthorized access and reduce network vulnerabilities by over forty percent.
  • Evolving international data sovereignty regulations have transformed cross border data transfer procedures for multinational pharmaceutical enterprises, driving the integration of sophisticated real time risk scoring modules into enterprise software to ensure seamless regulatory adherence across distinct legal jurisdictions.
  • The transition toward value based care alignment has required healthcare providers to continuously monitor clinical outcomes and billing practices, increasing reliance on automated incident response workflows to decrease claims processing discrepancies by at least thirty percent.

Dive into Technavio’s robust research methodology, blending expert interviews, extensive data synthesis, and validated models for unparalleled Healthcare Compliance Software Market insights. See full methodology.

Market Scope
Page number 310
Base year 2025
Historic period 2020-2024
Forecast period 2026-2030
Growth momentum & CAGR Accelerate at a CAGR of 13.1%
Market growth 2026-2030 USD 3126.1 million
Market structure Fragmented
YoY growth 2025-2026(%) 12.6%
Key countries US, Canada, Mexico, UK, Germany, France, Italy, The Netherlands, Spain, Russia, China, Japan, India, South Korea, Indonesia, Singapore, Thailand, Australia, Brazil, UAE, South Africa, Saudi Arabia and Turkey
Competitive landscape Leading Companies, Market Positioning of Companies, Competitive Strategies, and Industry Risks

Request Free Sample

Research Analyst Overview

  • The Healthcare Compliance Software landscape is undergoing a profound structural evolution as medical organizations abandon fragmented administrative processes in favor of unified digital ecosystems. Institutional leadership increasingly connects robust pharmacovigilance tracking capabilities with strategic product lifecycle decisions, ensuring that new therapeutics meet rigorous safety standards before market launch.
  • Implementing advanced electronic batch records systems directly influences operational budgeting by reducing manufacturing documentation errors by over twenty five percent. This digital transformation enables continuous alignment with complex statutory mandates without requiring unsustainable increases in administrative headcount. Medical device surveillance platforms provide vital real-time feedback loops, allowing engineering teams to adjust product designs rapidly in response to field safety data.
  • Furthermore, the integration of automated corrective action tracking ensures that identified operational vulnerabilities are remediated systematically rather than being lost in manual administrative backlogs. The deployment of HIPAA compliance tools establishes an immutable digital defense against external legal audits.
  • By utilizing comprehensive quality assurance mapping alongside regulatory reporting automation, clinical facilities empower compliance officers to translate raw operational data into actionable intelligence, securing long-term institutional resilience.

What are the Key Data Covered in this Healthcare Compliance Software Market Research and Growth Report?

  • What is the expected growth of the Healthcare Compliance Software Market between 2026 and 2030?

    • USD 3.13 billion, at a CAGR of 13.1%

  • What segmentation does the market report cover?

    • The report is segmented by Deployment (Cloud-based, On-premises, and Hybrid), End-user (Hospitals and clinics, Pharma and biotech companies, Medical device companies, Health insurance providers, and Others), Application (Regulatory compliance management, Policy and procedure management, Risk management, Audit management, and Incident management) and Geography (North America, Europe, Asia, Rest of World (ROW))

  • Which regions are analyzed in the report?

    • North America, Europe, Asia and Rest of World (ROW)

  • What are the key growth drivers and market challenges?

    • Escalating regulatory complexity and mandates for data governance, High implementation costs and resource constraints for small enterprises

  • Who are the major players in the Healthcare Compliance Software Market?

    • Agiloft Inc., Archer Technologies LLC, Bluesight, Clearwater Compliance LLC, Drata Inc., Healthicity, HealthStream Inc., HSI, Imprivata Inc., Intraprise Health, LogicGate Inc., MedTrainer, MetricStream Inc., NAVEX Global Inc., OneTrust LLC, RADAR LLC, ServiceNow Inc., symplr Software LLC, Vanta Inc. and Wolters Kluwer NV

Market Research Insights

  • Modern healthcare facilities are rapidly adopting digital governance solutions to navigate rigorous operational standards. By integrating advanced environmental sustainability metrics alongside core privacy tools, organizations have improved overall operational transparency by over thirty percent. This evolution supports decentralized healthcare models, where remote monitoring devices require continuous validation to prevent data breaches.
  • Implementing robust generative intelligence interfaces allows compliance officers to interpret shifting statutory rules rapidly, cutting legal review times by nearly half. Furthermore, automated fraudulent claims auditing algorithms reduce billing errors by up to forty percent, directly enhancing institutional return on investment.
  • These sophisticated platforms seamlessly connect disparate hospital departments, ensuring that continuous enterprise surveillance becomes a standard operating procedure rather than a periodic administrative burden.

We can help! Our analysts can customize this healthcare compliance software market research report to meet your requirements.

Get in touch

1. Executive Summary

1.1 Market overview

Executive Summary - Chart on Market Overview
Executive Summary - Data Table on Market Overview
Executive Summary - Chart on Global Market Characteristics
Executive Summary - Chart on Market by Geography
Executive Summary - Chart on Market Segmentation by Deployment
Executive Summary - Chart on Market Segmentation by End-user
Executive Summary - Chart on Market Segmentation by Application
Executive Summary - Chart on Incremental Growth
Executive Summary - Data Table on Incremental Growth
Executive Summary - Chart on Company Market Positioning

2. Technavio Analysis

2.1 Analysis of price sensitivity, lifecycle, customer purchase basket, adoption rates, and purchase criteria

2.2 Criticality of inputs and Factors of differentiation

Chart on Overview on criticality of inputs and factors of differentiation

2.3 Factors of disruption

Chart on Overview on factors of disruption

2.4 Impact of drivers and challenges

Chart on Impact of drivers and challenges in 2025 and 2030

3. Market Landscape

3.1 Market ecosystem

Chart on Parent Market
Data Table on - Parent Market

3.2 Market characteristics

Chart on Market characteristics analysis

3.3 Value chain analysis

Chart on Value chain analysis

4. Market Sizing

4.1 Market definition

Data Table on Offerings of companies included in the market definition

4.2 Market segment analysis

Market segments

4.3 Market size 2025

4.4 Market outlook: Forecast for 2025-2030

Chart on Global - Market size and forecast 2025-2030 ($ million)
Data Table on Global - Market size and forecast 2025-2030 ($ million)
Chart on Global Market: Year-over-year growth 2025-2030 (%)
Data Table on Global Market: Year-over-year growth 2025-2030 (%)

5. Historic Market Size

5.1 Global Healthcare Compliance Software Market 2020 - 2024

Historic Market Size - Data Table on Global Healthcare Compliance Software Market 2020 - 2024 ($ million)

5.2 Deployment segment analysis 2020 - 2024

Historic Market Size - Deployment Segment 2020 - 2024 ($ million)

5.3 End-user segment analysis 2020 - 2024

Historic Market Size - End-user Segment 2020 - 2024 ($ million)

5.4 Application segment analysis 2020 - 2024

Historic Market Size - Application Segment 2020 - 2024 ($ million)

5.5 Geography segment analysis 2020 - 2024

Historic Market Size - Geography Segment 2020 - 2024 ($ million)

5.6 Country segment analysis 2020 - 2024

Historic Market Size - Country Segment 2020 - 2024 ($ million)

6. Qualitative Analysis

6.1 Impact of AI on Global Healthcare Compliance Software Market

6.2 Impact of Geopolitical Conflicts on Global Healthcare Compliance Software Market

7. Five Forces Analysis

7.1 Five forces summary

Five forces analysis - Comparison between 2025 and 2030

7.2 Bargaining power of buyers

Bargaining power of buyers - Impact of key factors 2025 and 2030

7.3 Bargaining power of suppliers

Bargaining power of suppliers - Impact of key factors in 2025 and 2030

7.4 Threat of new entrants

Threat of new entrants - Impact of key factors in 2025 and 2030

7.5 Threat of substitutes

Threat of substitutes - Impact of key factors in 2025 and 2030

7.6 Threat of rivalry

Threat of rivalry - Impact of key factors in 2025 and 2030

7.7 Market condition

Chart on Market condition - Five forces 2025 and 2030

8. Market Segmentation by Deployment

8.1 Market segments

Chart on Deployment - Market share 2025-2030 (%)
Data Table on Deployment - Market share 2025-2030 (%)

8.2 Comparison by Deployment

Chart on Comparison by Deployment
Data Table on Comparison by Deployment

8.3 Cloud-based - Market size and forecast 2025-2030

Chart on Cloud-based - Market size and forecast 2025-2030 ($ million)
Data Table on Cloud-based - Market size and forecast 2025-2030 ($ million)
Chart on Cloud-based - Year-over-year growth 2025-2030 (%)
Data Table on Cloud-based - Year-over-year growth 2025-2030 (%)

8.4 On-premises - Market size and forecast 2025-2030

Chart on On-premises - Market size and forecast 2025-2030 ($ million)
Data Table on On-premises - Market size and forecast 2025-2030 ($ million)
Chart on On-premises - Year-over-year growth 2025-2030 (%)
Data Table on On-premises - Year-over-year growth 2025-2030 (%)

8.5 Hybrid - Market size and forecast 2025-2030

Chart on Hybrid - Market size and forecast 2025-2030 ($ million)
Data Table on Hybrid - Market size and forecast 2025-2030 ($ million)
Chart on Hybrid - Year-over-year growth 2025-2030 (%)
Data Table on Hybrid - Year-over-year growth 2025-2030 (%)

8.6 Market opportunity by Deployment

Market opportunity by Deployment ($ million)
Data Table on Market opportunity by Deployment ($ million)

9. Market Segmentation by End-user

9.1 Market segments

Chart on End-user - Market share 2025-2030 (%)
Data Table on End-user - Market share 2025-2030 (%)

9.2 Comparison by End-user

Chart on Comparison by End-user
Data Table on Comparison by End-user

9.3 Hospitals and clinics - Market size and forecast 2025-2030

Chart on Hospitals and clinics - Market size and forecast 2025-2030 ($ million)
Data Table on Hospitals and clinics - Market size and forecast 2025-2030 ($ million)
Chart on Hospitals and clinics - Year-over-year growth 2025-2030 (%)
Data Table on Hospitals and clinics - Year-over-year growth 2025-2030 (%)

9.4 Pharma and biotech companies - Market size and forecast 2025-2030

Chart on Pharma and biotech companies - Market size and forecast 2025-2030 ($ million)
Data Table on Pharma and biotech companies - Market size and forecast 2025-2030 ($ million)
Chart on Pharma and biotech companies - Year-over-year growth 2025-2030 (%)
Data Table on Pharma and biotech companies - Year-over-year growth 2025-2030 (%)

9.5 Medical device companies - Market size and forecast 2025-2030

Chart on Medical device companies - Market size and forecast 2025-2030 ($ million)
Data Table on Medical device companies - Market size and forecast 2025-2030 ($ million)
Chart on Medical device companies - Year-over-year growth 2025-2030 (%)
Data Table on Medical device companies - Year-over-year growth 2025-2030 (%)

9.6 Health insurance providers - Market size and forecast 2025-2030

Chart on Health insurance providers - Market size and forecast 2025-2030 ($ million)
Data Table on Health insurance providers - Market size and forecast 2025-2030 ($ million)
Chart on Health insurance providers - Year-over-year growth 2025-2030 (%)
Data Table on Health insurance providers - Year-over-year growth 2025-2030 (%)

9.7 Others - Market size and forecast 2025-2030

Chart on Others - Market size and forecast 2025-2030 ($ million)
Data Table on Others - Market size and forecast 2025-2030 ($ million)
Chart on Others - Year-over-year growth 2025-2030 (%)
Data Table on Others - Year-over-year growth 2025-2030 (%)

9.8 Market opportunity by End-user

Market opportunity by End-user ($ million)
Data Table on Market opportunity by End-user ($ million)

10. Market Segmentation by Application

10.1 Market segments

Chart on Application - Market share 2025-2030 (%)
Data Table on Application - Market share 2025-2030 (%)

10.2 Comparison by Application

Chart on Comparison by Application
Data Table on Comparison by Application

10.3 Regulatory compliance management - Market size and forecast 2025-2030

Chart on Regulatory compliance management - Market size and forecast 2025-2030 ($ million)
Data Table on Regulatory compliance management - Market size and forecast 2025-2030 ($ million)
Chart on Regulatory compliance management - Year-over-year growth 2025-2030 (%)
Data Table on Regulatory compliance management - Year-over-year growth 2025-2030 (%)

10.4 Policy and procedure management - Market size and forecast 2025-2030

Chart on Policy and procedure management - Market size and forecast 2025-2030 ($ million)
Data Table on Policy and procedure management - Market size and forecast 2025-2030 ($ million)
Chart on Policy and procedure management - Year-over-year growth 2025-2030 (%)
Data Table on Policy and procedure management - Year-over-year growth 2025-2030 (%)

10.5 Risk management - Market size and forecast 2025-2030

Chart on Risk management - Market size and forecast 2025-2030 ($ million)
Data Table on Risk management - Market size and forecast 2025-2030 ($ million)
Chart on Risk management - Year-over-year growth 2025-2030 (%)
Data Table on Risk management - Year-over-year growth 2025-2030 (%)

10.6 Audit management - Market size and forecast 2025-2030

Chart on Audit management - Market size and forecast 2025-2030 ($ million)
Data Table on Audit management - Market size and forecast 2025-2030 ($ million)
Chart on Audit management - Year-over-year growth 2025-2030 (%)
Data Table on Audit management - Year-over-year growth 2025-2030 (%)

10.7 Incident management - Market size and forecast 2025-2030

Chart on Incident management - Market size and forecast 2025-2030 ($ million)
Data Table on Incident management - Market size and forecast 2025-2030 ($ million)
Chart on Incident management - Year-over-year growth 2025-2030 (%)
Data Table on Incident management - Year-over-year growth 2025-2030 (%)

10.8 Market opportunity by Application

Market opportunity by Application ($ million)
Data Table on Market opportunity by Application ($ million)

11. Customer Landscape

11.1 Customer landscape overview

Analysis of price sensitivity, lifecycle, customer purchase basket, adoption rates, and purchase criteria

12. Geographic Landscape

12.1 Geographic segmentation

Chart on Market share by geography 2025-2030 (%)
Data Table on Market share by geography 2025-2030 (%)

12.2 Geographic comparison

Chart on Geographic comparison
Data Table on Geographic comparison

12.3 North America - Market size and forecast 2025-2030

Chart on North America - Market size and forecast 2025-2030 ($ million)
Data Table on North America - Market size and forecast 2025-2030 ($ million)
Chart on North America - Year-over-year growth 2025-2030 (%)
Data Table on North America - Year-over-year growth 2025-2030 (%)
Chart on Regional Comparison - North America
Data Table on Regional Comparison - North America

12.3.1 US - Market size and forecast 2025-2030

Chart on US - Market size and forecast 2025-2030 ($ million)
Data Table on US - Market size and forecast 2025-2030 ($ million)
Chart on US - Year-over-year growth 2025-2030 (%)
Data Table on US - Year-over-year growth 2025-2030 (%)

12.3.2 Canada - Market size and forecast 2025-2030

Chart on Canada - Market size and forecast 2025-2030 ($ million)
Data Table on Canada - Market size and forecast 2025-2030 ($ million)
Chart on Canada - Year-over-year growth 2025-2030 (%)
Data Table on Canada - Year-over-year growth 2025-2030 (%)

12.3.3 Mexico - Market size and forecast 2025-2030

Chart on Mexico - Market size and forecast 2025-2030 ($ million)
Data Table on Mexico - Market size and forecast 2025-2030 ($ million)
Chart on Mexico - Year-over-year growth 2025-2030 (%)
Data Table on Mexico - Year-over-year growth 2025-2030 (%)

12.4 Europe - Market size and forecast 2025-2030

Chart on Europe - Market size and forecast 2025-2030 ($ million)
Data Table on Europe - Market size and forecast 2025-2030 ($ million)
Chart on Europe - Year-over-year growth 2025-2030 (%)
Data Table on Europe - Year-over-year growth 2025-2030 (%)
Chart on Regional Comparison - Europe
Data Table on Regional Comparison - Europe

12.4.1 UK - Market size and forecast 2025-2030

Chart on UK - Market size and forecast 2025-2030 ($ million)
Data Table on UK - Market size and forecast 2025-2030 ($ million)
Chart on UK - Year-over-year growth 2025-2030 (%)
Data Table on UK - Year-over-year growth 2025-2030 (%)

12.4.2 Germany - Market size and forecast 2025-2030

Chart on Germany - Market size and forecast 2025-2030 ($ million)
Data Table on Germany - Market size and forecast 2025-2030 ($ million)
Chart on Germany - Year-over-year growth 2025-2030 (%)
Data Table on Germany - Year-over-year growth 2025-2030 (%)

12.4.3 France - Market size and forecast 2025-2030

Chart on France - Market size and forecast 2025-2030 ($ million)
Data Table on France - Market size and forecast 2025-2030 ($ million)
Chart on France - Year-over-year growth 2025-2030 (%)
Data Table on France - Year-over-year growth 2025-2030 (%)

12.4.4 Italy - Market size and forecast 2025-2030

Chart on Italy - Market size and forecast 2025-2030 ($ million)
Data Table on Italy - Market size and forecast 2025-2030 ($ million)
Chart on Italy - Year-over-year growth 2025-2030 (%)
Data Table on Italy - Year-over-year growth 2025-2030 (%)

12.4.5 The Netherlands - Market size and forecast 2025-2030

Chart on The Netherlands - Market size and forecast 2025-2030 ($ million)
Data Table on The Netherlands - Market size and forecast 2025-2030 ($ million)
Chart on The Netherlands - Year-over-year growth 2025-2030 (%)
Data Table on The Netherlands - Year-over-year growth 2025-2030 (%)

12.4.6 Spain - Market size and forecast 2025-2030

Chart on Spain - Market size and forecast 2025-2030 ($ million)
Data Table on Spain - Market size and forecast 2025-2030 ($ million)
Chart on Spain - Year-over-year growth 2025-2030 (%)
Data Table on Spain - Year-over-year growth 2025-2030 (%)

12.4.7 Russia - Market size and forecast 2025-2030

Chart on Russia - Market size and forecast 2025-2030 ($ million)
Data Table on Russia - Market size and forecast 2025-2030 ($ million)
Chart on Russia - Year-over-year growth 2025-2030 (%)
Data Table on Russia - Year-over-year growth 2025-2030 (%)

12.5 Asia - Market size and forecast 2025-2030

Chart on Asia - Market size and forecast 2025-2030 ($ million)
Data Table on Asia - Market size and forecast 2025-2030 ($ million)
Chart on Asia - Year-over-year growth 2025-2030 (%)
Data Table on Asia - Year-over-year growth 2025-2030 (%)
Chart on Regional Comparison - Asia
Data Table on Regional Comparison - Asia

12.5.1 China - Market size and forecast 2025-2030

Chart on China - Market size and forecast 2025-2030 ($ million)
Data Table on China - Market size and forecast 2025-2030 ($ million)
Chart on China - Year-over-year growth 2025-2030 (%)
Data Table on China - Year-over-year growth 2025-2030 (%)

12.5.2 Japan - Market size and forecast 2025-2030

Chart on Japan - Market size and forecast 2025-2030 ($ million)
Data Table on Japan - Market size and forecast 2025-2030 ($ million)
Chart on Japan - Year-over-year growth 2025-2030 (%)
Data Table on Japan - Year-over-year growth 2025-2030 (%)

12.5.3 India - Market size and forecast 2025-2030

Chart on India - Market size and forecast 2025-2030 ($ million)
Data Table on India - Market size and forecast 2025-2030 ($ million)
Chart on India - Year-over-year growth 2025-2030 (%)
Data Table on India - Year-over-year growth 2025-2030 (%)

12.5.4 South Korea - Market size and forecast 2025-2030

Chart on South Korea - Market size and forecast 2025-2030 ($ million)
Data Table on South Korea - Market size and forecast 2025-2030 ($ million)
Chart on South Korea - Year-over-year growth 2025-2030 (%)
Data Table on South Korea - Year-over-year growth 2025-2030 (%)

12.5.5 Indonesia - Market size and forecast 2025-2030

Chart on Indonesia - Market size and forecast 2025-2030 ($ million)
Data Table on Indonesia - Market size and forecast 2025-2030 ($ million)
Chart on Indonesia - Year-over-year growth 2025-2030 (%)
Data Table on Indonesia - Year-over-year growth 2025-2030 (%)

12.5.6 Singapore - Market size and forecast 2025-2030

Chart on Singapore - Market size and forecast 2025-2030 ($ million)
Data Table on Singapore - Market size and forecast 2025-2030 ($ million)
Chart on Singapore - Year-over-year growth 2025-2030 (%)
Data Table on Singapore - Year-over-year growth 2025-2030 (%)

12.5.7 Thailand - Market size and forecast 2025-2030

Chart on Thailand - Market size and forecast 2025-2030 ($ million)
Data Table on Thailand - Market size and forecast 2025-2030 ($ million)
Chart on Thailand - Year-over-year growth 2025-2030 (%)
Data Table on Thailand - Year-over-year growth 2025-2030 (%)

12.6 Rest of World (ROW) - Market size and forecast 2025-2030

Chart on Rest of World (ROW) - Market size and forecast 2025-2030 ($ million)
Data Table on Rest of World (ROW) - Market size and forecast 2025-2030 ($ million)
Chart on Rest of World (ROW) - Year-over-year growth 2025-2030 (%)
Data Table on Rest of World (ROW) - Year-over-year growth 2025-2030 (%)
Chart on Regional Comparison - Rest of World (ROW)
Data Table on Regional Comparison - Rest of World (ROW)

12.6.1 Australia - Market size and forecast 2025-2030

Chart on Australia - Market size and forecast 2025-2030 ($ million)
Data Table on Australia - Market size and forecast 2025-2030 ($ million)
Chart on Australia - Year-over-year growth 2025-2030 (%)
Data Table on Australia - Year-over-year growth 2025-2030 (%)

12.6.2 Brazil - Market size and forecast 2025-2030

Chart on Brazil - Market size and forecast 2025-2030 ($ million)
Data Table on Brazil - Market size and forecast 2025-2030 ($ million)
Chart on Brazil - Year-over-year growth 2025-2030 (%)
Data Table on Brazil - Year-over-year growth 2025-2030 (%)

12.6.3 UAE - Market size and forecast 2025-2030

Chart on UAE - Market size and forecast 2025-2030 ($ million)
Data Table on UAE - Market size and forecast 2025-2030 ($ million)
Chart on UAE - Year-over-year growth 2025-2030 (%)
Data Table on UAE - Year-over-year growth 2025-2030 (%)

12.6.4 South Africa - Market size and forecast 2025-2030

Chart on South Africa - Market size and forecast 2025-2030 ($ million)
Data Table on South Africa - Market size and forecast 2025-2030 ($ million)
Chart on South Africa - Year-over-year growth 2025-2030 (%)
Data Table on South Africa - Year-over-year growth 2025-2030 (%)

12.6.5 Saudi Arabia - Market size and forecast 2025-2030

Chart on Saudi Arabia - Market size and forecast 2025-2030 ($ million)
Data Table on Saudi Arabia - Market size and forecast 2025-2030 ($ million)
Chart on Saudi Arabia - Year-over-year growth 2025-2030 (%)
Data Table on Saudi Arabia - Year-over-year growth 2025-2030 (%)

12.6.6 Turkey - Market size and forecast 2025-2030

Chart on Turkey - Market size and forecast 2025-2030 ($ million)
Data Table on Turkey - Market size and forecast 2025-2030 ($ million)
Chart on Turkey - Year-over-year growth 2025-2030 (%)
Data Table on Turkey - Year-over-year growth 2025-2030 (%)

12.7 Market opportunity by geography

Market opportunity by geography ($ million)
Data Tables on Market opportunity by geography ($ million)

13. Drivers, Challenges, and Opportunity

13.1 Market drivers

Escalating regulatory complexity and mandates for data governance
Accelerated adoption of cloud-based architecture
Rising incidents of healthcare data breaches

13.2 Market challenges

High implementation costs and resource constraints for small enterprises
Legacy system integration complexities and data interoperability barriers
Resistance to organizational change and technical skill deficits

13.3 Impact of drivers and challenges

Impact of drivers and challenges in 2025 and 2030

13.4 Market opportunities

Integration of AI and predictive analytics in automated compliance workflows
Harmonization of ESG criteria with healthcare regulatory compliance
Expansion of interoperability frameworks and continuous data quality assurance

14. Competitive Landscape

14.1 Overview

14.2

Overview on criticality of inputs and factors of differentiation

14.3 Landscape disruption

Overview on factors of disruption

14.4 Industry risks

Impact of key risks on business

15. Competitive Analysis

15.1 Companies profiled

Companies covered

15.2 Company ranking index

15.3 Market positioning of companies

Matrix on companies position and classification

15.4 Agiloft Inc.

Agiloft Inc. - Overview
Agiloft Inc. - Product / Service
Agiloft Inc. - Key offerings
SWOT

15.5 Archer Technologies LLC

Archer Technologies LLC - Overview
Archer Technologies LLC - Product / Service
Archer Technologies LLC - Key offerings
SWOT

15.6 Bluesight

Bluesight - Overview
Bluesight - Product / Service
Bluesight - Key offerings
SWOT

15.7 Clearwater Compliance LLC

Clearwater Compliance LLC - Overview
Clearwater Compliance LLC - Product / Service
Clearwater Compliance LLC - Key offerings
SWOT

15.8 Drata Inc.

Drata Inc. - Overview
Drata Inc. - Product / Service
Drata Inc. - Key offerings
SWOT

15.9 Healthicity

Healthicity - Overview
Healthicity - Product / Service
Healthicity - Key offerings
SWOT

15.10 HealthStream Inc.

HealthStream Inc. - Overview
HealthStream Inc. - Product / Service
HealthStream Inc. - Key offerings
SWOT

15.11 HSI

HSI - Overview
HSI - Product / Service
HSI - Key offerings
SWOT

15.12 Imprivata Inc.

Imprivata Inc. - Overview
Imprivata Inc. - Product / Service
Imprivata Inc. - Key offerings
SWOT

15.13 Intraprise Health

Intraprise Health - Overview
Intraprise Health - Product / Service
Intraprise Health - Key offerings
SWOT

15.14 RADAR LLC

RADAR LLC - Overview
RADAR LLC - Product / Service
RADAR LLC - Key offerings
SWOT

15.15 ServiceNow Inc.

ServiceNow Inc. - Overview
ServiceNow Inc. - Product / Service
ServiceNow Inc. - Key news
ServiceNow Inc. - Key offerings
SWOT

15.16 symplr Software LLC

symplr Software LLC - Overview
symplr Software LLC - Product / Service
symplr Software LLC - Key offerings
SWOT

15.17 Vanta Inc.

Vanta Inc. - Overview
Vanta Inc. - Product / Service
Vanta Inc. - Key offerings
SWOT

15.18 Wolters Kluwer NV

Wolters Kluwer NV - Overview
Wolters Kluwer NV - Business segments
Wolters Kluwer NV - Key news
Wolters Kluwer NV - Key offerings
Wolters Kluwer NV - Segment focus
SWOT

16. Appendix

16.1 Scope of the report

Market definition
Objectives
Notes and caveats

16.2 Inclusions and exclusions checklist

Inclusions checklist
Exclusions checklist

16.3 Currency conversion rates for US$

16.4 Research methodology

16.5 Data procurement

Information sources

16.6 Data validation

16.7 Validation techniques employed for market sizing

16.8 Data synthesis

16.9 360 degree market analysis

16.10 List of abbreviations

Research Methodology

Technavio presents a detailed picture of the market by way of study, synthesis, and summation of data from multiple sources. The analysts have presented the various facets of the market with a particular focus on identifying the key industry influencers. The data thus presented is comprehensive, reliable, and the result of extensive research, both primary and secondary.

INFORMATION SOURCES

Primary sources

  • Manufacturers and suppliers
  • Channel partners
  • Industry experts
  • Strategic decision makers

Secondary sources

  • Industry journals and periodicals
  • Government data
  • Financial reports of key industry players
  • Historical data
  • Press releases

DATA ANALYSIS

Data Synthesis

  • Collation of data
  • Estimation of key figures
  • Analysis of derived insights

Data Validation

  • Triangulation with data models
  • Reference against proprietary databases
  • Corroboration with industry experts

REPORT WRITING

Qualitative

  • Market drivers
  • Market challenges
  • Market trends
  • Five forces analysis

Quantitative

  • Market size and forecast
  • Market segmentation
  • Geographical insights
  • Competitive landscape

Interested in this report?

Get your sample now to see our research methodology and insights!

Download Now

Frequently Asked Questions

Healthcare Compliance Software market growth will increase by USD 3126.1 million during 2026-2030.

The Healthcare Compliance Software market is expected to grow at a CAGR of 13.1% during 2026-2030.

Healthcare Compliance Software market is segmented by Deployment (Cloud-based, On-premises, Hybrid) End-user (Hospitals and clinics, Pharma and biotech companies, Medical device companies, Health insurance providers, Others) Application (Regulatory compliance management, Policy and procedure management, Risk management, Audit management, Incident management)

Agiloft Inc., Archer Technologies LLC, Bluesight, Clearwater Compliance LLC, Drata Inc., Healthicity, HealthStream Inc., HSI, Imprivata Inc., Intraprise Health, LogicGate Inc., MedTrainer, MetricStream Inc., NAVEX Global Inc., OneTrust LLC, RADAR LLC, ServiceNow Inc., symplr Software LLC, Vanta Inc., Wolters Kluwer NV are a few of the key vendors in the Healthcare Compliance Software market.

North America will register the highest growth rate of 38.7% among the other regions. Therefore, the Healthcare Compliance Software market in North America is expected to garner significant business opportunities for the vendors during the forecast period.

US, Canada, Mexico, UK, Germany, France, Italy, The Netherlands, Spain, Russia, China, Japan, India, South Korea, Indonesia, Singapore, Thailand, Australia, Brazil, UAE, South Africa, Saudi Arabia, Turkey

  • Escalating regulatory complexity and mandates for data governance is the driving factor this market.

The Healthcare Compliance Software market vendors should focus on grabbing business opportunities from the Deployment segment as it accounted for the largest market share in the base year.
RIA - Research AI Assistant
Ask RIA
