Healthcare Payer Network Management Market Analysis, Size, and Forecast 2026-2030: North America (US, Canada, and Mexico), Europe (Germany, UK, and France), APAC (China, Japan, and India), South America (Brazil), Middle East and Africa (UAE, Saudi Arabia, and South Africa), Asia, Rest of World (ROW)

Healthcare Payer Network Management Market Analysis, Size, and Forecast 2026-2030:
North America (US, Canada, and Mexico), Europe (Germany, UK, and France), APAC (China, Japan, and India), South America (Brazil), Middle East and Africa (UAE, Saudi Arabia, and South Africa), Asia, Rest of World (ROW)

Published: Jan 2026 281 Pages SKU: IRTNTR81239

Market Overview at a Glance

$5.38 B
Market Opportunity
15.1%
CAGR 2025 - 2030
41.6%
North America Growth
$2.89 B
Platform and software segment 2024

Healthcare Payer Network Management Market Size 2026-2030

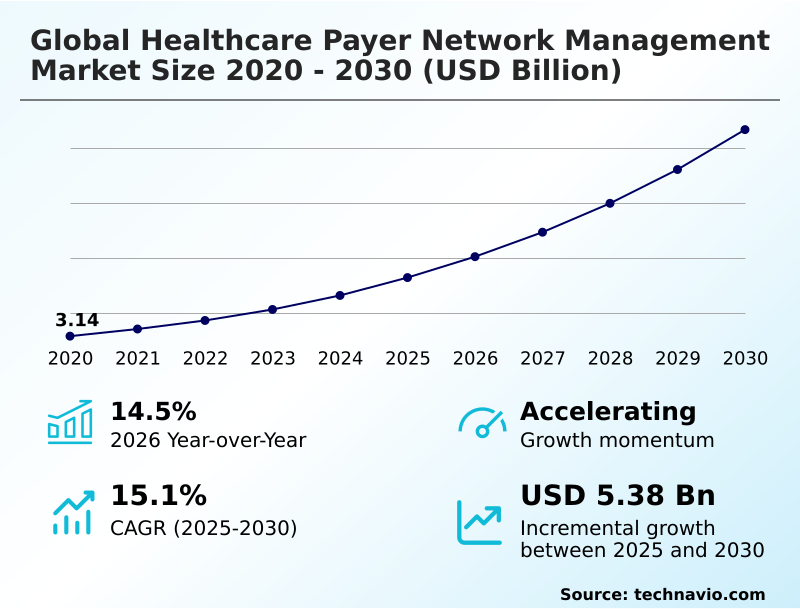
The healthcare payer network management market size is valued to increase by USD 5.38 billion, at a CAGR of 15.1% from 2025 to 2030. Adoption of AI for cost containment and fraud prevention will drive the healthcare payer network management market.

Major Market Trends & Insights

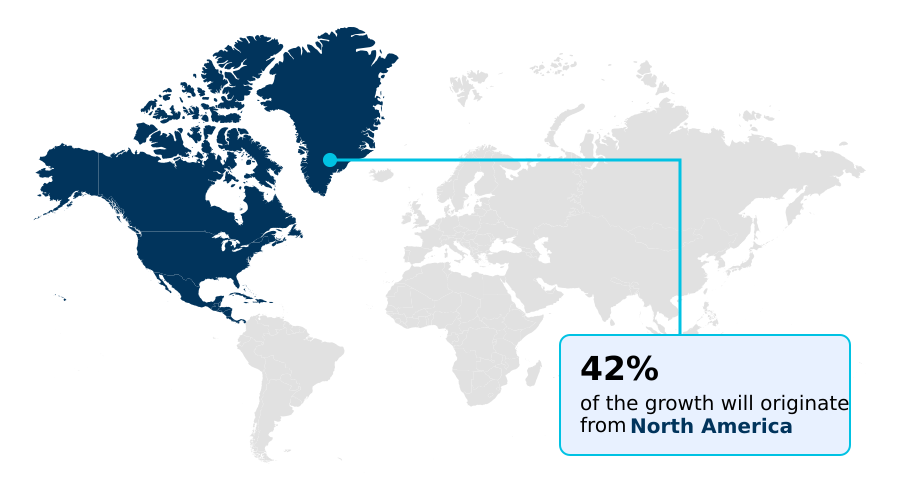
  • North America dominated the market and accounted for a 41.6% growth during the forecast period.
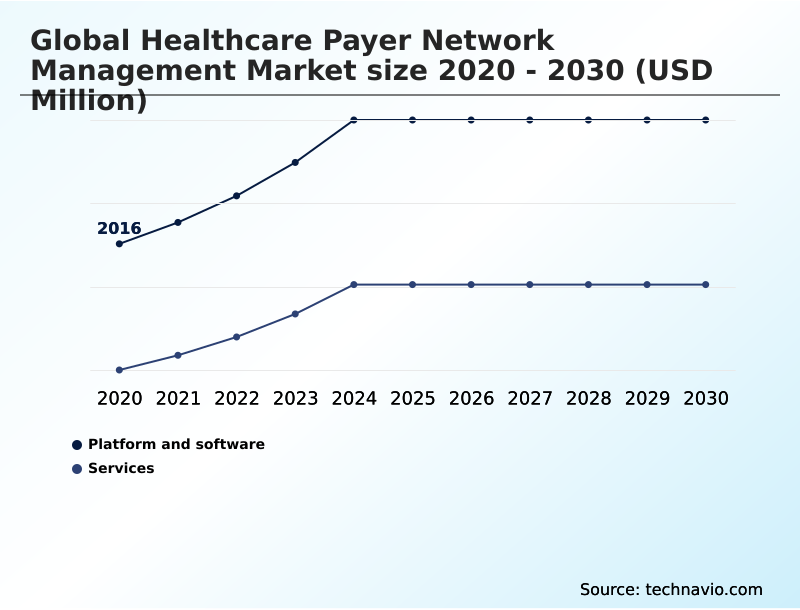
  • By Component - Platform and software segment was valued at USD 2.89 billion in 2024
  • By Delivery Mode - Cloud segment accounted for the largest market revenue share in 2024

Market Size & Forecast

  • Market Opportunities: USD 7.51 billion
  • Market Future Opportunities: USD 5.38 billion
  • CAGR from 2025 to 2030 : 15.1%

Market Summary

  • The healthcare payer network management market is undergoing a significant transformation, driven by the dual pressures of cost containment and the industry-wide shift to value-based care models. Payers are increasingly adopting advanced software and platforms to automate historically manual processes, such as provider data management and claims adjudication, to enhance operational efficiency.
  • This technological shift is critical for managing complex provider relationships and ensuring regulatory adherence. For instance, a private insurer can leverage a unified platform for provider onboarding, integrating data from various sources to accelerate credentialing and contracting, which directly improves network adequacy and member satisfaction.
  • Key trends include the integration of AI for predictive analytics, the development of consumer-facing transparency tools, and the expansion of virtual care networks. However, challenges persist, including the integration of modern solutions with legacy IT systems, the constant threat of cybersecurity breaches, and the complexities of maintaining accurate provider directories to comply with regulations like the No Surprises Act.
  • This dynamic environment necessitates continuous investment in technology to balance cost, quality, and member access.

What will be the Size of the Healthcare Payer Network Management Market during the forecast period?

Get Key Insights on Market Forecast (PDF) Request Free Sample

How is the Healthcare Payer Network Management Market Segmented?

The healthcare payer network management industry research report provides comprehensive data (region-wise segment analysis), with forecasts and estimates in "USD million" for the period 2026-2030, as well as historical data from 2020-2024 for the following segments.

  • Component
    • Platform and software
    • Services
  • Delivery mode
    • Cloud
    • On-premises
  • End-user
    • Public health insurance
    • Private health insurance
  • Geography
    • North America
      • US
      • Canada
      • Mexico
    • Europe
      • Germany
      • UK
      • France
    • Asia
    • Rest of World (ROW)

By Component Insights

The platform and software segment is estimated to witness significant growth during the forecast period.

The platform and software segment is central to healthcare payer operations, enabling efficient network administration through advanced technological solutions. Payers are deploying sophisticated software to move beyond manual workflows, adopting tools for provider credentialing automation and detailed network adequacy analysis.

These systems are essential for managing the complexities of value-based care reimbursement and ensuring regulatory compliance reporting. Core administrative systems are being upgraded with modules for real-time claims processing and contract lifecycle management, which includes fee schedule management.

A key business driver is operational efficiency, with some payers achieving a 40% reduction in provider onboarding time by implementing AI-driven digital credentialing workflows. This focus on automation helps ensure provider directory accuracy and strengthens payer-provider collaboration tools.

Request Free Sample

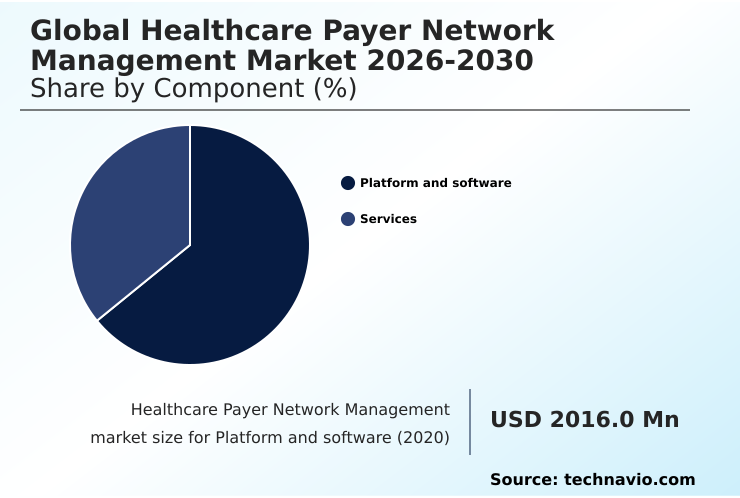
The Platform and software segment was valued at USD 2.89 billion in 2024 and showed a gradual increase during the forecast period.

Request Free Sample

Regional Analysis

North America is estimated to contribute 41.6% to the growth of the global market during the forecast period.Technavio’s analysts have elaborately explained the regional trends and drivers that shape the market during the forecast period.

See How Healthcare Payer Network Management Market Demand is Rising in North America Request Free Sample

The healthcare payer network management market exhibits distinct regional dynamics, with North America accounting for over 41% of the incremental growth, driven by stringent regulations and the transition to value-based care.

In this region, payers focus on provider network optimization and predictive network analytics. Europe emphasizes cross-border health data exchange and compliance with data privacy laws, using payment integrity solutions to manage costs.

The market in Asia is characterized by rapid technology adoption, particularly mobile health application support and telehealth provider integration to bridge access gaps. Payers in this region are implementing provider performance scorecards and population health management analytics to improve outcomes.

This global divergence in priorities highlights the need for adaptable solutions that can handle both mature, regulation-heavy markets and high-growth regions focused on digital-first strategies.

Market Dynamics

Our researchers analyzed the data with 2025 as the base year, along with the key drivers, trends, and challenges. A holistic analysis of drivers will help companies refine their marketing strategies to gain a competitive advantage.

  • The global healthcare payer network management market is evolving to address highly specific operational and strategic challenges. Insurers are increasingly focused on improving provider directory accuracy to meet regulatory demands and enhance member experience. For government-sponsored programs, managing provider networks for medicaid requires specialized platforms that can handle complex compliance and reporting needs.
  • The adoption of AI for provider credentialing verification is becoming standard, significantly reducing manual effort. Similarly, advanced analytics for high-performance network design allow payers to construct networks that balance cost and quality effectively. As the industry moves toward more complex reimbursement structures, software for value-based contract modeling and technology for value-based reimbursement are critical.
  • Integrating telehealth provider networks into existing frameworks is another key focus, demanding new approaches to credentialing and quality monitoring. Payers are also deploying sophisticated tools for no surprises act compliance and solutions for provider data synchronization to prevent surprise billing with accurate data.
  • These targeted solutions, such as those for managing risk-sharing agreements with providers and technology for cross-border health insurance, are delivering measurable returns, with some platforms reducing claims processing errors by a greater margin than legacy systems. This specialization extends to automating provider contract lifecycle management, using platforms for real-time claims adjudication, and building a consumer-centric provider directory.
  • Furthermore, payers are exploring how to integrate social determinants into networks and are using specialized fraud detection in payer provider networks to protect revenue.

What are the key market drivers leading to the rise in the adoption of Healthcare Payer Network Management Industry?

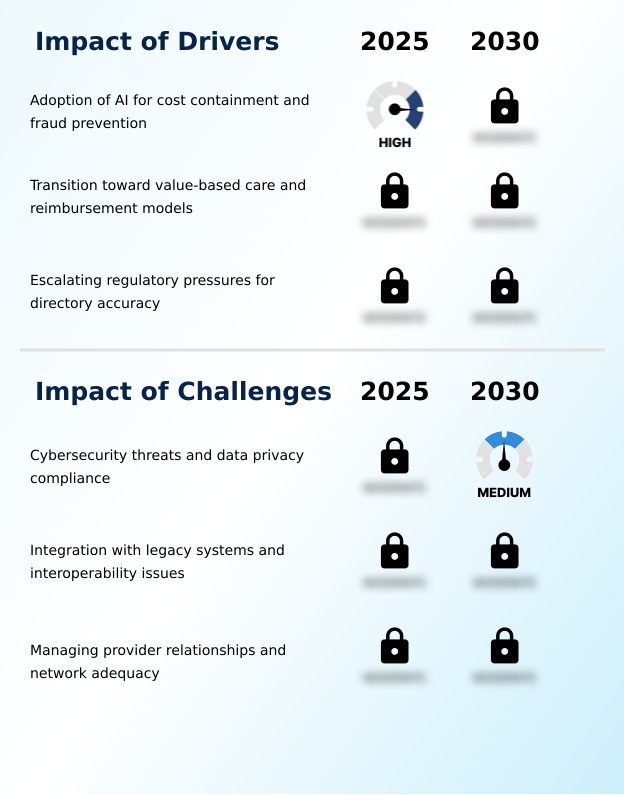
  • The adoption of AI for cost containment and fraud prevention serves as a key driver, enabling payers to reduce administrative overhead and protect revenue integrity.

  • Market growth is primarily fueled by the need for operational efficiency and regulatory adherence. The adoption of value-based care models necessitates robust solutions for managing reimbursement incentive calculation and supporting care management program integration.
  • These platforms enable payers to execute complex risk-sharing agreement management, which can improve cost predictability by 15%. Escalating regulatory pressures for directory accuracy are driving investment in automated provider directory synchronization and ghost network identification technologies.
  • The use of provider data verification tools and automated provider onboarding systems streamlines administrative tasks, reducing manual errors by over 40% in some cases.
  • This focus on automation not only ensures compliance but also enhances the ability to manage intricate managed care contract negotiation and supports a broader population health management support strategy.

What are the market trends shaping the Healthcare Payer Network Management Industry?

  • The integration of machine learning is a transformative trend, enabling advanced network optimization and predictive analytics for payers. This shift allows for more dynamic and data-driven management of provider networks to improve efficiency and care quality.

  • Key trends are reshaping the healthcare payer network management landscape, driven by technology and consumer demands. The adoption of virtual-first care models and hybrid provider networks is accelerating, requiring sophisticated specialist referral management and remote monitoring reimbursement frameworks. This shift is supported by consumer-centric digital platforms that incorporate price transparency tools and automated outreach tools, improving member experience.
  • These platforms can increase user satisfaction by up to 25%. Internally, payers are leveraging machine learning for network performance monitoring and claims repricing engine optimization. The focus on claims dispute resolution portals and quality metric reconciliation supports a more collaborative clinical governance framework, where data-driven insights enhance partnerships between payers and providers.
  • This evolution toward a digital, transparent, and integrated ecosystem is now a market standard.

What challenges does the Healthcare Payer Network Management Industry face during its growth?

  • Significant challenges related to cybersecurity threats and data privacy compliance affect industry growth, requiring substantial investment in security protocols and adherence to complex regulations.

  • The market faces significant challenges that can impede progress and increase operational costs. Cybersecurity and compliance with data privacy regulations are paramount, demanding secure platforms for credentialing lifecycle management and patient referral tracking. The integration of modern software with legacy systems creates interoperability bottlenecks, hindering efforts to achieve seamless data exchange and real-time updates.
  • This technical debt makes it difficult to implement functionalities like provider performance scorecards or to incorporate social determinants of health data effectively. Managing provider relationships is also complex, with payers needing to balance network gap analysis with contract negotiations. Failure to maintain adequate networks can lead to regulatory penalties that are 20% higher than in previous years.
  • These hurdles require strategic investments in both technology modernization and partnership management to ensure sustainable growth.

Exclusive Technavio Analysis on Customer Landscape

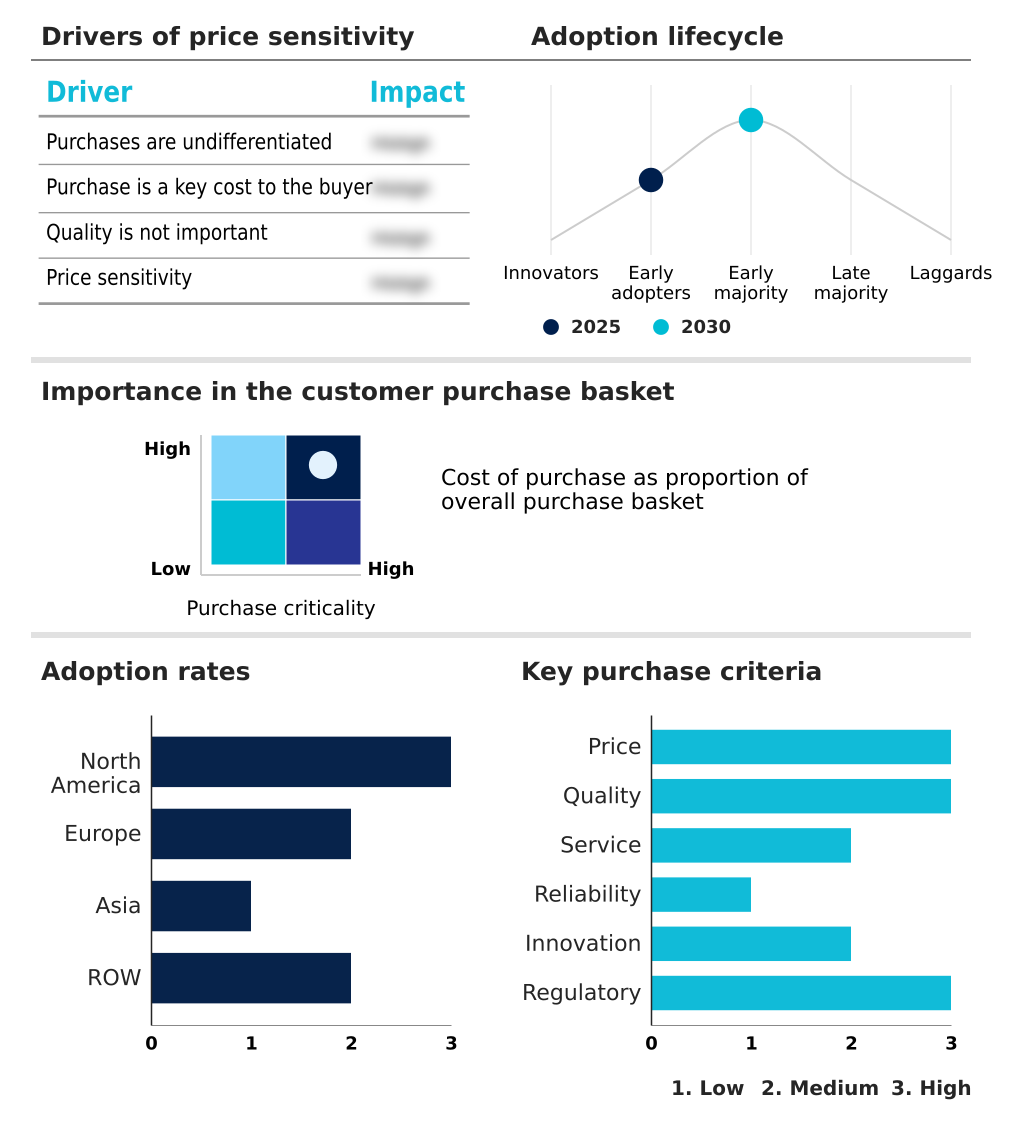
The healthcare payer network management market forecasting report includes the adoption lifecycle of the market, covering from the innovator’s stage to the laggard’s stage. It focuses on adoption rates in different regions based on penetration. Furthermore, the healthcare payer network management market report also includes key purchase criteria and drivers of price sensitivity to help companies evaluate and develop their market growth analysis strategies.

Customer Landscape of Healthcare Payer Network Management Industry

Competitive Landscape

Companies are implementing various strategies, such as strategic alliances, healthcare payer network management market forecast, partnerships, mergers and acquisitions, geographical expansion, and product/service launches, to enhance their presence in the industry.

Availity - Provider data management platforms streamline credentialing, directory maintenance, and information exchange, optimizing the connection between payers and providers for enhanced network integrity.

The industry research and growth report includes detailed analyses of the competitive landscape of the market and information about key companies, including:

  • Availity
  • Cedar Gate Technologies
  • Cognizant Technology Solution
  • Cotiviti Inc.
  • Gainwell Technologies LLC
  • HealthEdge Software Inc.
  • Infosys Ltd.
  • Innovaccer Inc.
  • LexisNexis Risk Solutions.
  • Mphasis Ltd.
  • Optum Inc.
  • Oracle Corp.
  • Quest Analytics LLC
  • Salesforce Inc.
  • SS and C Technologies Inc.
  • Symplr
  • Verisys
  • Zelis

Qualitative and quantitative analysis of companies has been conducted to help clients understand the wider business environment as well as the strengths and weaknesses of key industry players. Data is qualitatively analyzed to categorize companies as pure play, category-focused, industry-focused, and diversified; it is quantitatively analyzed to categorize companies as dominant, leading, strong, tentative, and weak.

Recent Development and News in Healthcare payer network management market

  • In February 2025, Centene Corporation integrated a proprietary generative AI module into its provider network operations, designed to automate the verification of provider credentials and reduce onboarding time.
  • In March 2025, UnitedHealth Group announced a strategic expansion of its outcome-based contract framework, utilizing a new proprietary analytics engine to manage risk-sharing agreements with major hospital systems.
  • In April 2025, the Centers for Medicare and Medicaid Services released updated interoperability mandates requiring Medicare Advantage plans to use digital interfaces for real-time exchange of quality performance data.
  • In February 2025, Humana Inc. announced a major restructuring of its specialist network contracts to prioritize value-based outcomes over volume, leading to renegotiations with several large provider groups.

Dive into Technavio’s robust research methodology, blending expert interviews, extensive data synthesis, and validated models for unparalleled Healthcare Payer Network Management Market insights. See full methodology.

Market Scope
Page number 281
Base year 2025
Historic period 2020-2024
Forecast period 2026-2030
Growth momentum & CAGR Accelerate at a CAGR of 15.1%
Market growth 2026-2030 USD 5378.3 million
Market structure Fragmented
YoY growth 2025-2026(%) 14.5%
Key countries US, Canada, Mexico, Germany, UK, France, The Netherlands, Italy, Spain, Russia, China, Japan, India, South Korea, Indonesia, Thailand, Singapore, Australia, Brazil, UAE, Saudi Arabia, South Africa and Turkey
Competitive landscape Leading Companies, Market Positioning of Companies, Competitive Strategies, and Industry Risks

Request Free Sample

Research Analyst Overview

  • The healthcare payer network management market is defined by a strategic imperative to modernize core administrative systems and embrace data-driven decision-making. Payers are actively implementing provider data management solutions for provider onboarding platforms and claims adjudication software to streamline operations.
  • The integration of a provider relationship management crm and a robust data activation platform is critical for achieving a holistic view of network performance. Technologies for provider credentialing automation and automated provider verification are no longer optional but essential for maintaining regulatory compliance reporting and provider directory accuracy.
  • Boardroom decisions are increasingly focused on investing in high-performance network design and predictive network analytics to manage costs associated with bundled payment administration and capitation payment models. This involves leveraging payment integrity solutions and fraud, waste, and abuse detection tools.
  • Payers are using platforms with real-time claims processing capabilities and quality performance tracking, with some achieving a 30% reduction in provider data errors. The adoption of healthcare interoperability standards and api-driven data exchange is pivotal for enabling effective payer-provider collaboration tools.

What are the Key Data Covered in this Healthcare Payer Network Management Market Research and Growth Report?

  • What is the expected growth of the Healthcare Payer Network Management Market between 2026 and 2030?

    • USD 5.38 billion, at a CAGR of 15.1%

  • What segmentation does the market report cover?

    • The report is segmented by Component (Platform and software, and Services), Delivery Mode (Cloud, and On-premises), End-user (Public health insurance, and Private health insurance) and Geography (North America, Europe, Asia, Rest of World (ROW))

  • Which regions are analyzed in the report?

    • North America, Europe, Asia and Rest of World (ROW)

  • What are the key growth drivers and market challenges?

    • Adoption of AI for cost containment and fraud prevention, Cybersecurity threats and data privacy compliance

  • Who are the major players in the Healthcare Payer Network Management Market?

    • Availity, Cedar Gate Technologies, Cognizant Technology Solution, Cotiviti Inc., Gainwell Technologies LLC, HealthEdge Software Inc., Infosys Ltd., Innovaccer Inc., LexisNexis Risk Solutions., Mphasis Ltd., Optum Inc., Oracle Corp., Quest Analytics LLC, Salesforce Inc., SS and C Technologies Inc., Symplr, Verisys and Zelis

Market Research Insights

  • The market is shaped by the push for greater efficiency and transparency, compelling payers to adopt modern solutions for provider network configuration and value-based contract modeling. The use of consumer-centric digital platforms is rising, with implementations showing a 30% improvement in member engagement by providing better healthcare price transparency.
  • Effective out-of-network claims management and real-time eligibility verification are now standard expectations, reducing administrative friction. Adherence to interoperability standards and automated prior authorization can reduce claims denial rates by over 15%.
  • This focus on technology-driven processes helps payers achieve cost of care reduction while improving both member access to care and the overall provider relationship, creating a more streamlined healthcare ecosystem.

We can help! Our analysts can customize this healthcare payer network management market research report to meet your requirements.

Get in touch

1. Executive Summary

1.1 Market overview

Executive Summary - Chart on Market Overview
Executive Summary - Data Table on Market Overview
Executive Summary - Chart on Global Market Characteristics
Executive Summary - Chart on Market by Geography
Executive Summary - Chart on Market Segmentation by Component
Executive Summary - Chart on Market Segmentation by Delivery Mode
Executive Summary - Chart on Market Segmentation by End-user
Executive Summary - Chart on Incremental Growth
Executive Summary - Data Table on Incremental Growth
Executive Summary - Chart on Company Market Positioning

2. Technavio Analysis

2.1 Analysis of price sensitivity, lifecycle, customer purchase basket, adoption rates, and purchase criteria

2.2 Criticality of inputs and Factors of differentiation

Chart on Overview on criticality of inputs and factors of differentiation

2.3 Factors of disruption

Chart on Overview on factors of disruption

2.4 Impact of drivers and challenges

Chart on Impact of drivers and challenges in 2025 and 2030

3. Market Landscape

3.1 Market ecosystem

Chart on Parent Market
Data Table on - Parent Market

3.2 Market characteristics

Chart on Market characteristics analysis

3.3 Value chain analysis

Chart on Value chain analysis

4. Market Sizing

4.1 Market definition

Data Table on Offerings of companies included in the market definition

4.2 Market segment analysis

Market segments

4.3 Market size 2025

4.4 Market outlook: Forecast for 2025-2030

Chart on Global - Market size and forecast 2025-2030 ($ million)
Data Table on Global - Market size and forecast 2025-2030 ($ million)
Chart on Global Market: Year-over-year growth 2025-2030 (%)
Data Table on Global Market: Year-over-year growth 2025-2030 (%)

5. Historic Market Size

5.1 Global Healthcare Payer Network Management Market 2020 - 2024

Historic Market Size - Data Table on Global Healthcare Payer Network Management Market 2020 - 2024 ($ million)

5.2 Component segment analysis 2020 - 2024

Historic Market Size - Component Segment 2020 - 2024 ($ million)

5.3 Delivery Mode segment analysis 2020 - 2024

Historic Market Size - Delivery Mode Segment 2020 - 2024 ($ million)

5.4 End-user segment analysis 2020 - 2024

Historic Market Size - End-user Segment 2020 - 2024 ($ million)

5.5 Geography segment analysis 2020 - 2024

Historic Market Size - Geography Segment 2020 - 2024 ($ million)

5.6 Country segment analysis 2020 - 2024

Historic Market Size - Country Segment 2020 - 2024 ($ million)

6. Qualitative Analysis

6.1 Impact of AI on the Global Healthcare Payer Network Management Market

7. Five Forces Analysis

7.1 Five forces summary

Five forces analysis - Comparison between 2025 and 2030

7.2 Bargaining power of buyers

Bargaining power of buyers - Impact of key factors 2025 and 2030

7.3 Bargaining power of suppliers

Bargaining power of suppliers - Impact of key factors in 2025 and 2030

7.4 Threat of new entrants

Threat of new entrants - Impact of key factors in 2025 and 2030

7.5 Threat of substitutes

Threat of substitutes - Impact of key factors in 2025 and 2030

7.6 Threat of rivalry

Threat of rivalry - Impact of key factors in 2025 and 2030

7.7 Market condition

Chart on Market condition - Five forces 2025 and 2030

8. Market Segmentation by Component

8.1 Market segments

Chart on Component - Market share 2025-2030 (%)
Data Table on Component - Market share 2025-2030 (%)

8.2 Comparison by Component

Chart on Comparison by Component
Data Table on Comparison by Component

8.3 Platform and software - Market size and forecast 2025-2030

Chart on Platform and software - Market size and forecast 2025-2030 ($ million)
Data Table on Platform and software - Market size and forecast 2025-2030 ($ million)
Chart on Platform and software - Year-over-year growth 2025-2030 (%)
Data Table on Platform and software - Year-over-year growth 2025-2030 (%)

8.4 Services - Market size and forecast 2025-2030

Chart on Services - Market size and forecast 2025-2030 ($ million)
Data Table on Services - Market size and forecast 2025-2030 ($ million)
Chart on Services - Year-over-year growth 2025-2030 (%)
Data Table on Services - Year-over-year growth 2025-2030 (%)

8.5 Market opportunity by Component

Market opportunity by Component ($ million)
Data Table on Market opportunity by Component ($ million)

9. Market Segmentation by Delivery Mode

9.1 Market segments

Chart on Delivery Mode - Market share 2025-2030 (%)
Data Table on Delivery Mode - Market share 2025-2030 (%)

9.2 Comparison by Delivery Mode

Chart on Comparison by Delivery Mode
Data Table on Comparison by Delivery Mode

9.3 Cloud - Market size and forecast 2025-2030

Chart on Cloud - Market size and forecast 2025-2030 ($ million)
Data Table on Cloud - Market size and forecast 2025-2030 ($ million)
Chart on Cloud - Year-over-year growth 2025-2030 (%)
Data Table on Cloud - Year-over-year growth 2025-2030 (%)

9.4 On-premises - Market size and forecast 2025-2030

Chart on On-premises - Market size and forecast 2025-2030 ($ million)
Data Table on On-premises - Market size and forecast 2025-2030 ($ million)
Chart on On-premises - Year-over-year growth 2025-2030 (%)
Data Table on On-premises - Year-over-year growth 2025-2030 (%)

9.5 Market opportunity by Delivery Mode

Market opportunity by Delivery Mode ($ million)
Data Table on Market opportunity by Delivery Mode ($ million)

10. Market Segmentation by End-user

10.1 Market segments

Chart on End-user - Market share 2025-2030 (%)
Data Table on End-user - Market share 2025-2030 (%)

10.2 Comparison by End-user

Chart on Comparison by End-user
Data Table on Comparison by End-user

10.3 Public health insurance - Market size and forecast 2025-2030

Chart on Public health insurance - Market size and forecast 2025-2030 ($ million)
Data Table on Public health insurance - Market size and forecast 2025-2030 ($ million)
Chart on Public health insurance - Year-over-year growth 2025-2030 (%)
Data Table on Public health insurance - Year-over-year growth 2025-2030 (%)

10.4 Private health insurance - Market size and forecast 2025-2030

Chart on Private health insurance - Market size and forecast 2025-2030 ($ million)
Data Table on Private health insurance - Market size and forecast 2025-2030 ($ million)
Chart on Private health insurance - Year-over-year growth 2025-2030 (%)
Data Table on Private health insurance - Year-over-year growth 2025-2030 (%)

10.5 Market opportunity by End-user

Market opportunity by End-user ($ million)
Data Table on Market opportunity by End-user ($ million)

11. Customer Landscape

11.1 Customer landscape overview

Analysis of price sensitivity, lifecycle, customer purchase basket, adoption rates, and purchase criteria

12. Geographic Landscape

12.1 Geographic segmentation

Chart on Market share by geography 2025-2030 (%)
Data Table on Market share by geography 2025-2030 (%)

12.2 Geographic comparison

Chart on Geographic comparison
Data Table on Geographic comparison

12.3 North America - Market size and forecast 2025-2030

Chart on North America - Market size and forecast 2025-2030 ($ million)
Data Table on North America - Market size and forecast 2025-2030 ($ million)
Chart on North America - Year-over-year growth 2025-2030 (%)
Data Table on North America - Year-over-year growth 2025-2030 (%)
Chart on Regional Comparison - North America
Data Table on Regional Comparison - North America

12.3.1 US - Market size and forecast 2025-2030

Chart on US - Market size and forecast 2025-2030 ($ million)
Data Table on US - Market size and forecast 2025-2030 ($ million)
Chart on US - Year-over-year growth 2025-2030 (%)
Data Table on US - Year-over-year growth 2025-2030 (%)

12.3.2 Canada - Market size and forecast 2025-2030

Chart on Canada - Market size and forecast 2025-2030 ($ million)
Data Table on Canada - Market size and forecast 2025-2030 ($ million)
Chart on Canada - Year-over-year growth 2025-2030 (%)
Data Table on Canada - Year-over-year growth 2025-2030 (%)

12.3.3 Mexico - Market size and forecast 2025-2030

Chart on Mexico - Market size and forecast 2025-2030 ($ million)
Data Table on Mexico - Market size and forecast 2025-2030 ($ million)
Chart on Mexico - Year-over-year growth 2025-2030 (%)
Data Table on Mexico - Year-over-year growth 2025-2030 (%)

12.4 Europe - Market size and forecast 2025-2030

Chart on Europe - Market size and forecast 2025-2030 ($ million)
Data Table on Europe - Market size and forecast 2025-2030 ($ million)
Chart on Europe - Year-over-year growth 2025-2030 (%)
Data Table on Europe - Year-over-year growth 2025-2030 (%)
Chart on Regional Comparison - Europe
Data Table on Regional Comparison - Europe

12.4.1 Germany - Market size and forecast 2025-2030

Chart on Germany - Market size and forecast 2025-2030 ($ million)
Data Table on Germany - Market size and forecast 2025-2030 ($ million)
Chart on Germany - Year-over-year growth 2025-2030 (%)
Data Table on Germany - Year-over-year growth 2025-2030 (%)

12.4.2 UK - Market size and forecast 2025-2030

Chart on UK - Market size and forecast 2025-2030 ($ million)
Data Table on UK - Market size and forecast 2025-2030 ($ million)
Chart on UK - Year-over-year growth 2025-2030 (%)
Data Table on UK - Year-over-year growth 2025-2030 (%)

12.4.3 France - Market size and forecast 2025-2030

Chart on France - Market size and forecast 2025-2030 ($ million)
Data Table on France - Market size and forecast 2025-2030 ($ million)
Chart on France - Year-over-year growth 2025-2030 (%)
Data Table on France - Year-over-year growth 2025-2030 (%)

12.4.4 The Netherlands - Market size and forecast 2025-2030

Chart on The Netherlands - Market size and forecast 2025-2030 ($ million)
Data Table on The Netherlands - Market size and forecast 2025-2030 ($ million)
Chart on The Netherlands - Year-over-year growth 2025-2030 (%)
Data Table on The Netherlands - Year-over-year growth 2025-2030 (%)

12.4.5 Italy - Market size and forecast 2025-2030

Chart on Italy - Market size and forecast 2025-2030 ($ million)
Data Table on Italy - Market size and forecast 2025-2030 ($ million)
Chart on Italy - Year-over-year growth 2025-2030 (%)
Data Table on Italy - Year-over-year growth 2025-2030 (%)

12.4.6 Spain - Market size and forecast 2025-2030

Chart on Spain - Market size and forecast 2025-2030 ($ million)
Data Table on Spain - Market size and forecast 2025-2030 ($ million)
Chart on Spain - Year-over-year growth 2025-2030 (%)
Data Table on Spain - Year-over-year growth 2025-2030 (%)

12.4.7 Russia - Market size and forecast 2025-2030

Chart on Russia - Market size and forecast 2025-2030 ($ million)
Data Table on Russia - Market size and forecast 2025-2030 ($ million)
Chart on Russia - Year-over-year growth 2025-2030 (%)
Data Table on Russia - Year-over-year growth 2025-2030 (%)

12.5 Asia - Market size and forecast 2025-2030

Chart on Asia - Market size and forecast 2025-2030 ($ million)
Data Table on Asia - Market size and forecast 2025-2030 ($ million)
Chart on Asia - Year-over-year growth 2025-2030 (%)
Data Table on Asia - Year-over-year growth 2025-2030 (%)
Chart on Regional Comparison - Asia
Data Table on Regional Comparison - Asia

12.5.1 China - Market size and forecast 2025-2030

Chart on China - Market size and forecast 2025-2030 ($ million)
Data Table on China - Market size and forecast 2025-2030 ($ million)
Chart on China - Year-over-year growth 2025-2030 (%)
Data Table on China - Year-over-year growth 2025-2030 (%)

12.5.2 Japan - Market size and forecast 2025-2030

Chart on Japan - Market size and forecast 2025-2030 ($ million)
Data Table on Japan - Market size and forecast 2025-2030 ($ million)
Chart on Japan - Year-over-year growth 2025-2030 (%)
Data Table on Japan - Year-over-year growth 2025-2030 (%)

12.5.3 India - Market size and forecast 2025-2030

Chart on India - Market size and forecast 2025-2030 ($ million)
Data Table on India - Market size and forecast 2025-2030 ($ million)
Chart on India - Year-over-year growth 2025-2030 (%)
Data Table on India - Year-over-year growth 2025-2030 (%)

12.5.4 South Korea - Market size and forecast 2025-2030

Chart on South Korea - Market size and forecast 2025-2030 ($ million)
Data Table on South Korea - Market size and forecast 2025-2030 ($ million)
Chart on South Korea - Year-over-year growth 2025-2030 (%)
Data Table on South Korea - Year-over-year growth 2025-2030 (%)

12.5.5 Indonesia - Market size and forecast 2025-2030

Chart on Indonesia - Market size and forecast 2025-2030 ($ million)
Data Table on Indonesia - Market size and forecast 2025-2030 ($ million)
Chart on Indonesia - Year-over-year growth 2025-2030 (%)
Data Table on Indonesia - Year-over-year growth 2025-2030 (%)

12.5.6 Thailand - Market size and forecast 2025-2030

Chart on Thailand - Market size and forecast 2025-2030 ($ million)
Data Table on Thailand - Market size and forecast 2025-2030 ($ million)
Chart on Thailand - Year-over-year growth 2025-2030 (%)
Data Table on Thailand - Year-over-year growth 2025-2030 (%)

12.5.7 Singapore - Market size and forecast 2025-2030

Chart on Singapore - Market size and forecast 2025-2030 ($ million)
Data Table on Singapore - Market size and forecast 2025-2030 ($ million)
Chart on Singapore - Year-over-year growth 2025-2030 (%)
Data Table on Singapore - Year-over-year growth 2025-2030 (%)

12.6 Rest of World (ROW) - Market size and forecast 2025-2030

Chart on Rest of World (ROW) - Market size and forecast 2025-2030 ($ million)
Data Table on Rest of World (ROW) - Market size and forecast 2025-2030 ($ million)
Chart on Rest of World (ROW) - Year-over-year growth 2025-2030 (%)
Data Table on Rest of World (ROW) - Year-over-year growth 2025-2030 (%)
Chart on Regional Comparison - Rest of World (ROW)
Data Table on Regional Comparison - Rest of World (ROW)

12.6.1 Australia - Market size and forecast 2025-2030

Chart on Australia - Market size and forecast 2025-2030 ($ million)
Data Table on Australia - Market size and forecast 2025-2030 ($ million)
Chart on Australia - Year-over-year growth 2025-2030 (%)
Data Table on Australia - Year-over-year growth 2025-2030 (%)

12.6.2 Brazil - Market size and forecast 2025-2030

Chart on Brazil - Market size and forecast 2025-2030 ($ million)
Data Table on Brazil - Market size and forecast 2025-2030 ($ million)
Chart on Brazil - Year-over-year growth 2025-2030 (%)
Data Table on Brazil - Year-over-year growth 2025-2030 (%)

12.6.3 UAE - Market size and forecast 2025-2030

Chart on UAE - Market size and forecast 2025-2030 ($ million)
Data Table on UAE - Market size and forecast 2025-2030 ($ million)
Chart on UAE - Year-over-year growth 2025-2030 (%)
Data Table on UAE - Year-over-year growth 2025-2030 (%)

12.6.4 Saudi Arabia - Market size and forecast 2025-2030

Chart on Saudi Arabia - Market size and forecast 2025-2030 ($ million)
Data Table on Saudi Arabia - Market size and forecast 2025-2030 ($ million)
Chart on Saudi Arabia - Year-over-year growth 2025-2030 (%)
Data Table on Saudi Arabia - Year-over-year growth 2025-2030 (%)

12.6.5 South Africa - Market size and forecast 2025-2030

Chart on South Africa - Market size and forecast 2025-2030 ($ million)
Data Table on South Africa - Market size and forecast 2025-2030 ($ million)
Chart on South Africa - Year-over-year growth 2025-2030 (%)
Data Table on South Africa - Year-over-year growth 2025-2030 (%)

12.6.6 Turkey - Market size and forecast 2025-2030

Chart on Turkey - Market size and forecast 2025-2030 ($ million)
Data Table on Turkey - Market size and forecast 2025-2030 ($ million)
Chart on Turkey - Year-over-year growth 2025-2030 (%)
Data Table on Turkey - Year-over-year growth 2025-2030 (%)

12.7 Market opportunity by geography

Market opportunity by geography ($ million)
Data Tables on Market opportunity by geography ($ million)

13. Drivers, Challenges, and Opportunity

13.1 Market drivers

Adoption of AI for cost containment and fraud prevention
Transition toward value-based care and reimbursement models
Escalating regulatory pressures for directory accuracy

13.2 Market challenges

Cybersecurity threats and data privacy compliance
Integration with legacy systems and interoperability issues
Managing provider relationships and network adequacy

13.3 Impact of drivers and challenges

Impact of drivers and challenges in 2025 and 2030

13.4 Market opportunities

Integration of machine learning for network optimization
Consumer-centric digital platforms for price transparency
Expansion of virtual-first and hybrid provider networks

14. Competitive Landscape

14.1 Overview

14.2

Overview on criticality of inputs and factors of differentiation

14.3 Landscape disruption

Overview on factors of disruption

14.4 Industry risks

Impact of key risks on business

15. Competitive Analysis

15.1 Companies profiled

Companies covered

15.2 Company ranking index

15.3 Market positioning of companies

Matrix on companies position and classification

15.4 Availity

Availity - Overview
Availity - Product / Service
Availity - Key offerings
SWOT

15.5 Cognizant Technology Solution

Cognizant Technology Solution - Overview
Cognizant Technology Solution - Business segments
Cognizant Technology Solution - Key news
Cognizant Technology Solution - Key offerings
Cognizant Technology Solution - Segment focus
SWOT

15.6 Cotiviti Inc.

Cotiviti Inc. - Overview
Cotiviti Inc. - Product / Service
Cotiviti Inc. - Key offerings
SWOT

15.7 Gainwell Technologies LLC

Gainwell Technologies LLC - Overview
Gainwell Technologies LLC - Product / Service
Gainwell Technologies LLC - Key offerings
SWOT

15.8 HealthEdge Software Inc.

HealthEdge Software Inc. - Overview
HealthEdge Software Inc. - Product / Service
HealthEdge Software Inc. - Key offerings
SWOT

15.9 Innovaccer Inc.

Innovaccer Inc. - Overview
Innovaccer Inc. - Product / Service
Innovaccer Inc. - Key offerings
SWOT

15.10 LexisNexis Risk Solutions.

LexisNexis Risk Solutions. - Overview
LexisNexis Risk Solutions. - Product / Service
LexisNexis Risk Solutions. - Key offerings
SWOT

15.11 Mphasis Ltd.

Mphasis Ltd. - Overview
Mphasis Ltd. - Product / Service
Mphasis Ltd. - Key news
Mphasis Ltd. - Key offerings
SWOT

15.12 Optum Inc.

Optum Inc. - Overview
Optum Inc. - Product / Service
Optum Inc. - Key offerings
SWOT

15.13 Oracle Corp.

Oracle Corp. - Overview
Oracle Corp. - Business segments
Oracle Corp. - Key news
Oracle Corp. - Key offerings
Oracle Corp. - Segment focus
SWOT

15.14 Quest Analytics LLC

Quest Analytics LLC - Overview
Quest Analytics LLC - Product / Service
Quest Analytics LLC - Key offerings
SWOT

15.15 Salesforce Inc.

Salesforce Inc. - Overview
Salesforce Inc. - Product / Service
Salesforce Inc. - Key news
Salesforce Inc. - Key offerings
SWOT

15.16 SS and C Technologies Inc.

SS and C Technologies Inc. - Overview
SS and C Technologies Inc. - Product / Service
SS and C Technologies Inc. - Key news
SS and C Technologies Inc. - Key offerings
SWOT

15.17 Symplr

Symplr - Overview
Symplr - Product / Service
Symplr - Key offerings
SWOT

15.18 Zelis

Zelis - Overview
Zelis - Product / Service
Zelis - Key offerings
SWOT

16. Appendix

16.1 Scope of the report

Market definition
Objectives
Notes and caveats

16.2 Inclusions and exclusions checklist

Inclusions checklist
Exclusions checklist

16.3 Currency conversion rates for US$

16.4 Research methodology

16.5 Data procurement

Information sources

16.6 Data validation

16.7 Validation techniques employed for market sizing

16.8 Data synthesis

16.9 360 degree market analysis

16.10 List of abbreviations

Research Methodology

Technavio presents a detailed picture of the market by way of study, synthesis, and summation of data from multiple sources. The analysts have presented the various facets of the market with a particular focus on identifying the key industry influencers. The data thus presented is comprehensive, reliable, and the result of extensive research, both primary and secondary.

INFORMATION SOURCES

Primary sources

  • Manufacturers and suppliers
  • Channel partners
  • Industry experts
  • Strategic decision makers

Secondary sources

  • Industry journals and periodicals
  • Government data
  • Financial reports of key industry players
  • Historical data
  • Press releases

DATA ANALYSIS

Data Synthesis

  • Collation of data
  • Estimation of key figures
  • Analysis of derived insights

Data Validation

  • Triangulation with data models
  • Reference against proprietary databases
  • Corroboration with industry experts

REPORT WRITING

Qualitative

  • Market drivers
  • Market challenges
  • Market trends
  • Five forces analysis

Quantitative

  • Market size and forecast
  • Market segmentation
  • Geographical insights
  • Competitive landscape

Interested in this report?

Get your sample now to see our research methodology and insights!

Download Now

Frequently Asked Questions

Healthcare Payer Network Management market growth will increase by USD 5378.3 million during 2026-2030 .

The Healthcare Payer Network Management market is expected to grow at a CAGR of 15.1% during 2026-2030 .

Healthcare Payer Network Management market is segmented by Component (Platform and software, Services) Delivery mode (Cloud, On-premises) End-user (Public health insurance, Private health insurance)

Availity, Cedar Gate Technologies, Cognizant Technology Solution, Cotiviti Inc., Gainwell Technologies LLC, HealthEdge Software Inc., Infosys Ltd., Innovaccer Inc., LexisNexis Risk Solutions., Mphasis Ltd., Optum Inc., Oracle Corp., Quest Analytics LLC, Salesforce Inc., SS and C Technologies Inc., Symplr, Verisys, Zelis are a few of the key vendors in the Healthcare Payer Network Management market.

North America will register the highest growth rate of 41.6% among the other regions. Therefore, the Healthcare Payer Network Management market in North America is expected to garner significant business opportunities for the vendors during the forecast period.

US, Canada, Mexico, Germany, UK, France, The Netherlands, Italy, Spain, Russia, China, Japan, India, South Korea, Indonesia, Thailand, Singapore, Australia, Brazil, UAE, Saudi Arabia, South Africa, Turkey

  • Adoption of AI for cost containment and fraud prevention is the driving factor this market.

The Healthcare Payer Network Management market vendors should focus on grabbing business opportunities from the Component segment as it accounted for the largest market share in the base year.