Healthcare Revenue Cycle Management (RCM) Software Market Analysis, Size, and Forecast 2026-2030: North America (US, Canada, and Mexico), Europe (Germany, UK, and France), APAC (China, India, and Japan), South America (Brazil and Argentina), Middle East and Africa (Saudi Arabia, UAE, and South Africa), and Rest of World (ROW)

Healthcare Revenue Cycle Management (RCM) Software Market Analysis, Size, and Forecast 2026-2030:
North America (US, Canada, and Mexico), Europe (Germany, UK, and France), APAC (China, India, and Japan), South America (Brazil and Argentina), Middle East and Africa (Saudi Arabia, UAE, and South Africa), and Rest of World (ROW)

Published: Mar 2026 293 Pages SKU: IRTNTR70319

Market Overview at a Glance

$55.13 B
Market Opportunity
12.6%
CAGR 2025 - 2030
60.1%
North America Growth
$37.58 B
Cloud-based segment 2024

Healthcare Revenue Cycle Management (RCM) Software Market Size 2026-2030

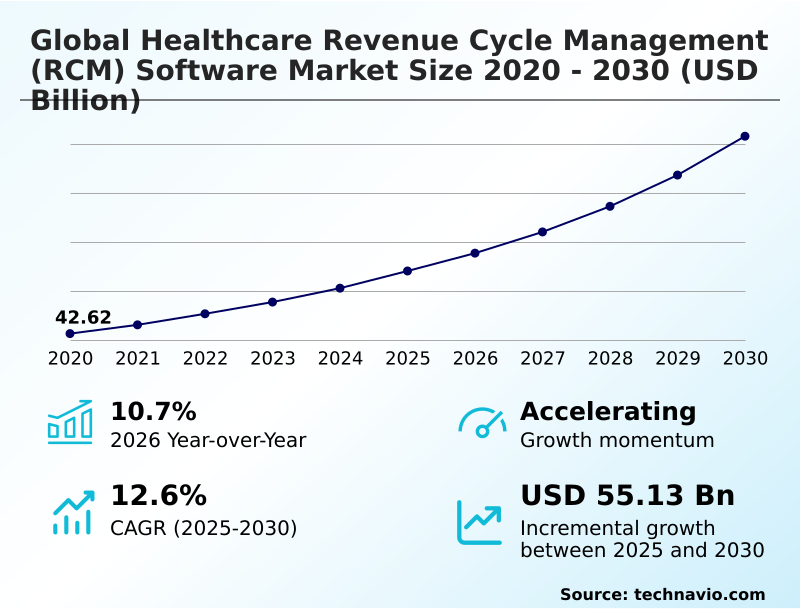
The healthcare revenue cycle management (rcm) software market size is valued to increase by USD 55.13 billion, at a CAGR of 12.6% from 2025 to 2030. Proliferation of agentic AI and autonomous coding workflows will drive the healthcare revenue cycle management (rcm) software market.

Major Market Trends & Insights

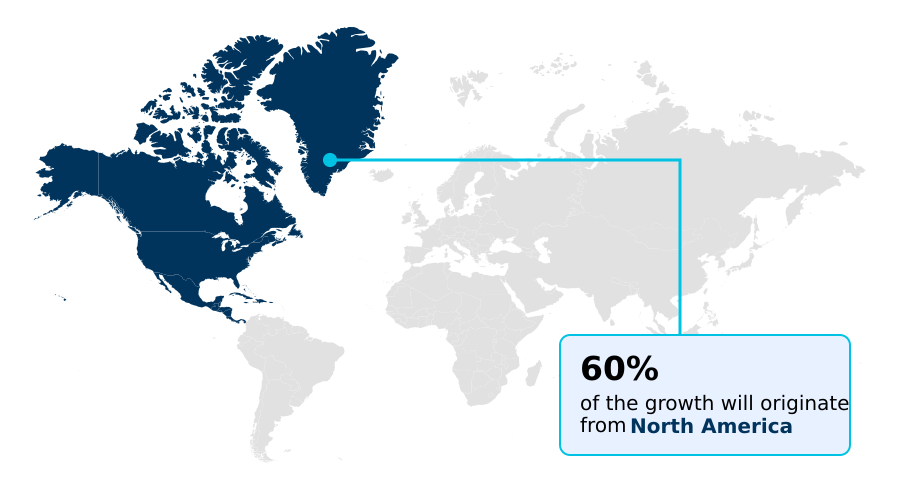
  • North America dominated the market and accounted for a 60.1% growth during the forecast period.
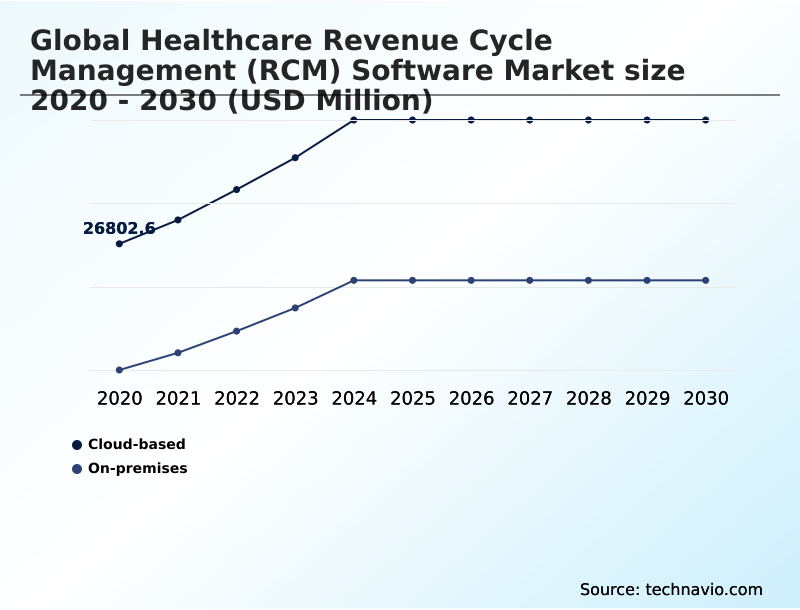
  • By Deployment - Cloud-based segment was valued at USD 37.58 billion in 2024
  • By End-user - Hospitals segment accounted for the largest market revenue share in 2024

Market Size & Forecast

  • Market Opportunities: USD 80.73 billion
  • Market Future Opportunities: USD 55.13 billion
  • CAGR from 2025 to 2030 : 12.6%

Market Summary

  • The Healthcare Revenue Cycle Management (RCM) Software market is undergoing a significant transformation, driven by the need to streamline financial operations and enhance revenue integrity. As healthcare providers face mounting pressure from complex reimbursement models and labor shortages, the adoption of advanced software has become a strategic imperative.
  • The market is characterized by a strong trend towards automation, particularly through the use of agentic AI in RCM for tasks like medical coding automation and denial management. This technological shift addresses the high volume of administrative work, which can account for up to 40% of hospital expenses.
  • For instance, a large health system can leverage an integrated platform for real-time eligibility verification and prior authorization automation, significantly reducing claim denials and accelerating cash flow. This proactive approach, which also includes robust patient financial engagement tools, moves beyond reactive problem-solving to create a more resilient and efficient financial ecosystem.
  • The integration with EHRs and adherence to interoperability standards are also key, ensuring seamless data flow and billing compliance across the care continuum.

What will be the Size of the Healthcare Revenue Cycle Management (RCM) Software Market during the forecast period?

Get Key Insights on Market Forecast (PDF) Request Free Sample

How is the Healthcare Revenue Cycle Management (RCM) Software Market Segmented?

The healthcare revenue cycle management (rcm) software industry research report provides comprehensive data (region-wise segment analysis), with forecasts and estimates in "USD million" for the period 2026-2030, as well as historical data from 2020-2024 for the following segments.

  • Deployment
    • Cloud-based
    • On-premises
  • End-user
    • Hospitals
    • Physicians
    • Medical labs
  • Product type
    • RCM services
    • Integrated RCM software
    • Standalone RCM modules
  • Geography
    • North America
      • US
      • Canada
      • Mexico
    • Europe
      • Germany
      • UK
      • France
    • APAC
      • China
      • India
      • Japan
    • South America
      • Brazil
      • Argentina
    • Middle East and Africa
      • Saudi Arabia
      • UAE
      • South Africa
    • Rest of World (ROW)

By Deployment Insights

The cloud-based segment is estimated to witness significant growth during the forecast period.

The market is rapidly expanding its adoption of cloud-based RCM solutions, as providers prioritize scalability, real-time data access, and reduced capital expenditure.

These healthcare billing platforms allow for the integration of complex billing processes, including payment posting automation, with disparate EHR systems. The shift is driven by the need for enhanced cybersecurity and frequent software updates to align with changing payer rules.

Advanced healthcare analytics embedded in these systems enable more accurate patient responsibility estimation and strategies for bad debt reduction, with some AI-native RCM automation software achieving significantly higher profitability profiles compared to legacy systems.

This model facilitates the use of predictive analytics to forecast patient payment behaviors and minimize denial rates, improving overall cash flow.

Request Free Sample

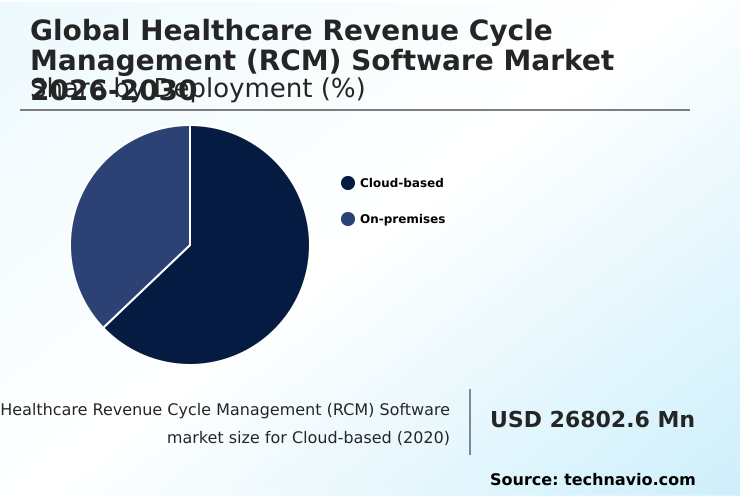
The Cloud-based segment was valued at USD 37.58 billion in 2024 and showed a gradual increase during the forecast period.

Request Free Sample

Regional Analysis

North America is estimated to contribute 60.1% to the growth of the global market during the forecast period.Technavio’s analysts have elaborately explained the regional trends and drivers that shape the market during the forecast period.

See How Healthcare Revenue Cycle Management (RCM) Software Market Demand is Rising in North America Request Free Sample

The geographic landscape is led by North America, which accounts for over 60% of the incremental growth, driven by an aggressive deployment of agentic AI to achieve revenue integrity and automate denial management.

This region focuses on patient access management tools that provide real-time cost estimates. In contrast, Europe's market is shaped by regulatory compliance, with an emphasis on data governance and transparency in claims adjudication.

The APAC region is experiencing the most rapid expansion, with a growth rate of 13.6%, by leapfrogging legacy systems in favor of cloud-native architectures that ensure charge capture accuracy. South America is modernizing with integrated solutions for real-time financial oversight.

These regional dynamics highlight a global shift towards sophisticated healthcare financial management and medical claims processing tools, including patient self-service portals.

Market Dynamics

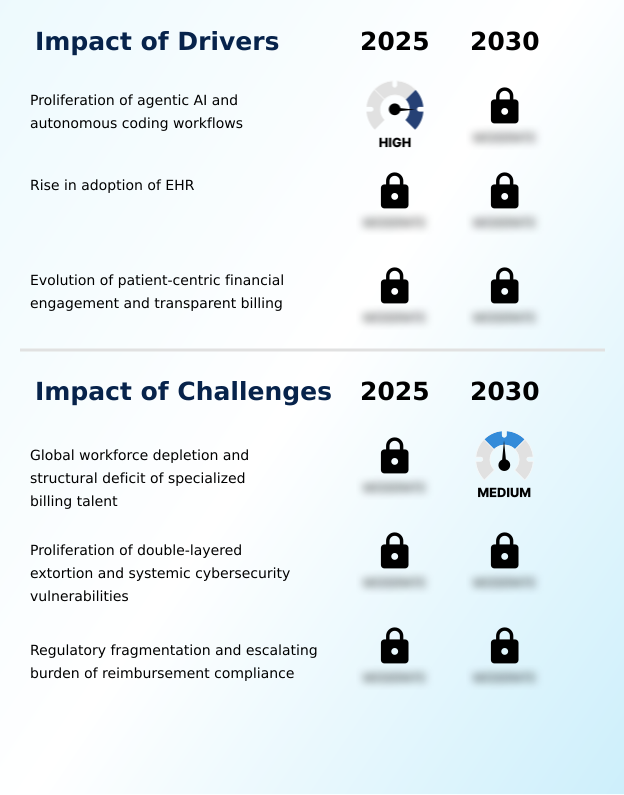
Our researchers analyzed the data with 2025 as the base year, along with the key drivers, trends, and challenges. A holistic analysis of drivers will help companies refine their marketing strategies to gain a competitive advantage.

  • The future of the healthcare RCM software market is centered on achieving complete financial and administrative autonomy. This evolution is powered by autonomous coding workflows for healthcare RCM, where AI interprets clinical notes and assigns codes without human review, significantly improving clean claim rate with automation.
  • Concurrently, AI-driven tools for medical necessity validation are becoming essential for preventing denials before they occur, scrutinizing documentation against payer rules with precision. This proactive stance is complemented by patient cost estimation and transparency tools, which address surprise billing act compliance by providing clear, upfront financial information.
  • The backbone of this ecosystem is the cloud-based RCM platform integration with EHR, creating a single source of truth. Enhanced interoperability for payer-provider data exchange allows for automating claims status inquiry and follow-up, drastically reducing administrative burden in healthcare. Digital payment rails in healthcare billing are also streamlining patient collections, while predictive analytics for patient payment propensity tailor financial counseling.
  • Revenue integrity solutions for value-based care are crucial for tracking outcomes, while patient access solutions for financial clearance ensure viability from the first touchpoint. Even the most complex issues, like managing denials with machine learning algorithms, are becoming automated.
  • This technology is not just for large hospitals; RCM software for specialty clinics and labs is also optimizing accounts receivable with AI, proving that advanced systems can reduce denial rates by more than double compared to legacy platforms, enhancing patient financial experience with software while mitigating cybersecurity for healthcare financial data.
  • Ultimately, advanced analytics for RCM key performance indicators will guide strategic decisions in this new paradigm.

What are the key market drivers leading to the rise in the adoption of Healthcare Revenue Cycle Management (RCM) Software Industry?

  • The proliferation of agentic AI and autonomous coding workflows is a key driver for market growth, reshaping ROI expectations for RCM software.

  • A primary driver is the rapid shift from basic automation to agentic AI in RCM, which enables autonomous decision-making. These platforms use large language models for tasks like medical coding automation and prior authorization automation without human intervention.
  • This shift is critical as providers face sophisticated payer algorithms; matching AI on the provider side allows for first-pass accuracy rates that human staff cannot achieve at scale.
  • Furthermore, tight electronic health record (EHR) integration ensures that financial data is captured at the point of care for immediate financial clearance.
  • The ability of AI in revenue cycle management to handle over 30% of routine administrative burdens, including real-time eligibility verification, has made it a core component of modern financial infrastructure, with seamless practice management software integration.

What are the market trends shaping the Healthcare Revenue Cycle Management (RCM) Software Industry?

  • The market is shaped by a major trend toward cloud-native platforms. These platforms enable fully interoperable revenue ecosystems that enhance financial workflow management.

  • A transformative trend involves the hyper-personalization of patient financial engagement, utilizing digital patient payment solutions and advanced payment rails to improve collection rates. As patient financial responsibility increases, providers are prioritizing software that mirrors modern e-commerce transparency. Tools using behavioral data now deliver customized financial counseling and flexible payment plans through mobile-first channels.
  • This proactive engagement, supported by robust claims scrubbing, reduces the confusion that leads to non-payment. Additionally, the strategic push for interoperability between payers and providers, essential for value-based reimbursement models, is creating seamless data corridors.
  • This alignment supports complex payer contract management and automated remittance advice processing, with real-time payment mechanisms seeing nearly 7% growth in the third quarter of 2025.

What challenges does the Healthcare Revenue Cycle Management (RCM) Software Industry face during its growth?

  • A significant challenge affecting industry growth is the global depletion of the workforce and the structural deficit of specialized talent in medical billing and coding.

  • A primary challenge is the structural deficit in specialized billing talent, which increases documentation errors and slows claims processing. While autonomous coding platforms are being deployed, their success is hampered by the capital needed to train staff for supervision. This labor shortage elevates days in accounts receivable and claim denial frequency, making collections optimization difficult.
  • The necessity for human intervention in complex appeals and medical necessity validation means software alone is insufficient. Moreover, navigating fragmented global regulatory landscapes and ensuring billing compliance is increasingly difficult. The lack of robust interoperability standards also complicates data exchange with healthcare clearinghouse services, impacting overall revenue cycle optimization and automated denial prediction.

Exclusive Technavio Analysis on Customer Landscape

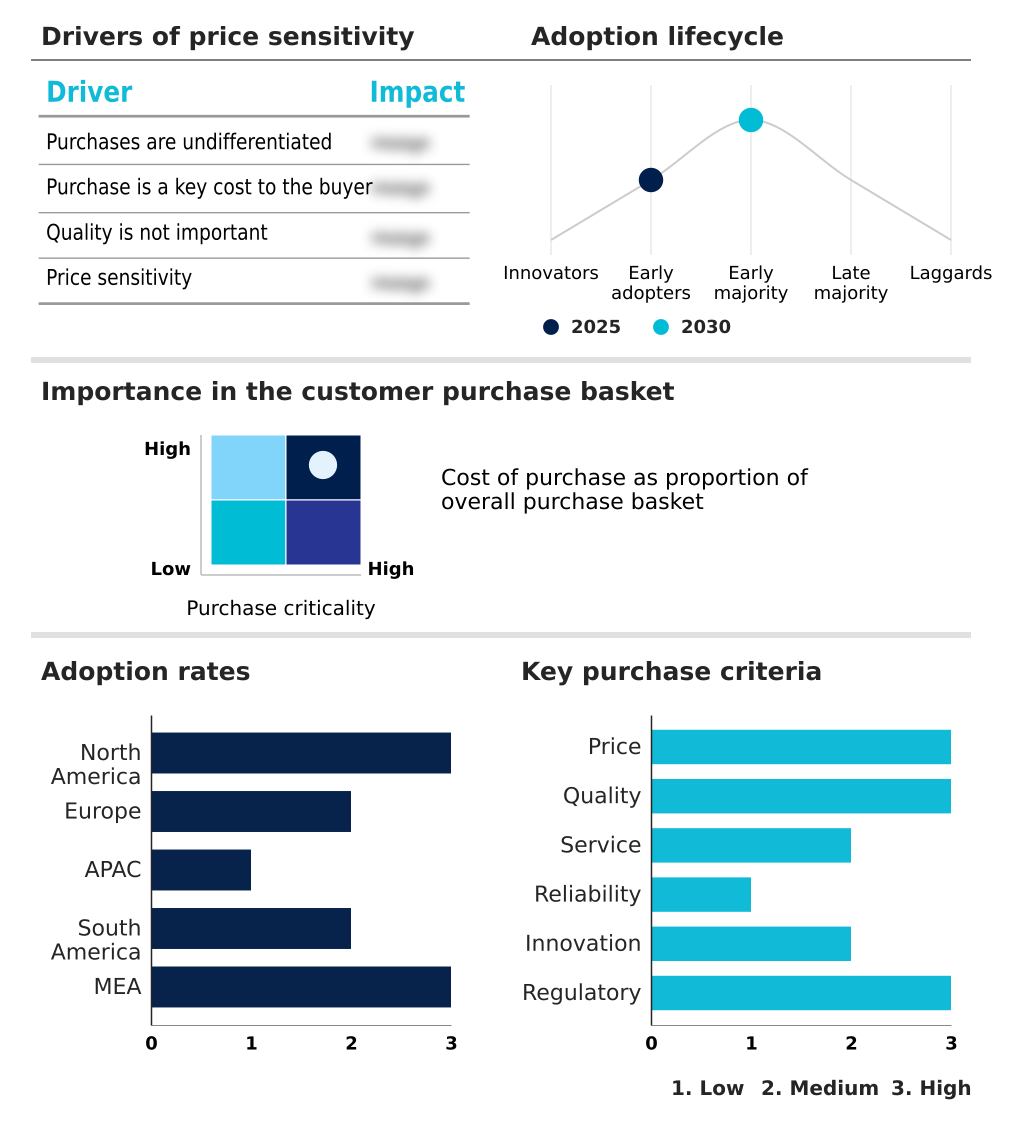
The healthcare revenue cycle management (rcm) software market forecasting report includes the adoption lifecycle of the market, covering from the innovator’s stage to the laggard’s stage. It focuses on adoption rates in different regions based on penetration. Furthermore, the healthcare revenue cycle management (rcm) software market report also includes key purchase criteria and drivers of price sensitivity to help companies evaluate and develop their market growth analysis strategies.

Customer Landscape of Healthcare Revenue Cycle Management (RCM) Software Industry

Competitive Landscape

Companies are implementing various strategies, such as strategic alliances, healthcare revenue cycle management (rcm) software market forecast, partnerships, mergers and acquisitions, geographical expansion, and product/service launches, to enhance their presence in the industry.

3M Co. - Delivers advanced coding and reimbursement platforms that are engineered to optimize financial workflows and ensure comprehensive coding accuracy within complex healthcare provider environments.

The industry research and growth report includes detailed analyses of the competitive landscape of the market and information about key companies, including:

  • 3M Co.
  • Athenahealth Inc.
  • Chetu Inc.
  • Cognizant Technology Solution
  • CompuGroup Medical SE and Co.
  • Epic Systems Corp.
  • Experian Plc
  • IBM Corp.
  • OSP Labs
  • ProHance
  • Quest Diagnostics Inc.
  • Qway Healthcare Inc.
  • R1 RCM Inc.
  • The SSI Group LLC
  • TruBridge Inc.
  • United Health Group Inc.
  • Waystar Holding Corp.
  • WellSky Corp.
  • ZH Healthcare Inc.

Qualitative and quantitative analysis of companies has been conducted to help clients understand the wider business environment as well as the strengths and weaknesses of key industry players. Data is qualitatively analyzed to categorize companies as pure play, category-focused, industry-focused, and diversified; it is quantitatively analyzed to categorize companies as dominant, leading, strong, tentative, and weak.

Recent Development and News in Healthcare revenue cycle management (rcm) software market

  • In May, 2025, Smarter Technologies launched an AI-powered revenue management platform designed to help hospitals streamline administrative workflows and improve financial performance.
  • In July, 2025, Astrana Health completed its acquisition of Prospect Health, a move indicating ongoing consolidation and the need for scalable RCM infrastructures in expanding health systems.
  • In July, 2025, Omega Healthcare announced an expanded collaboration with Microsoft to deploy more than twenty generative and agentic AI solutions, aiming to automate high-friction tasks like medical coding.
  • In November, 2025, the merger of AleraCare and Pure Healthcare formed a national platform for specialty care, driving demand for unified billing software to manage complex therapies.

Dive into Technavio’s robust research methodology, blending expert interviews, extensive data synthesis, and validated models for unparalleled Healthcare Revenue Cycle Management (RCM) Software Market insights. See full methodology.

Market Scope
Page number 293
Base year 2025
Historic period 2020-2024
Forecast period 2026-2030
Growth momentum & CAGR Accelerate at a CAGR of 12.6%
Market growth 2026-2030 USD 55132.4 million
Market structure Fragmented
YoY growth 2025-2026(%) 10.7%
Key countries US, Canada, Mexico, Germany, UK, France, Italy, Spain, Switzerland, China, India, Japan, South Korea, Australia, Singapore, Brazil, Argentina, Chile, Saudi Arabia, UAE, South Africa, Egypt and Nigeria
Competitive landscape Leading Companies, Market Positioning of Companies, Competitive Strategies, and Industry Risks

Request Free Sample

Research Analyst Overview

  • The Healthcare Revenue Cycle Management (RCM) software market is rapidly evolving beyond simple billing functions into a strategic asset for financial health. The integration of agentic AI in RCM is central to this shift, automating complex processes like claims scrubbing and payer contract management. For boardroom decisions, the focus is on how these technologies impact operational budgets and compliance.
  • For example, adopting platforms with robust clinical documentation improvement (CDI) and medical necessity validation capabilities directly addresses revenue integrity and mitigates audit risks. The move towards full electronic health record (EHR) integration and sophisticated healthcare analytics provides unprecedented visibility into financial performance, enabling proactive denial management and collections optimization.
  • This technological adoption, which can reduce administrative tasks by over 30%, allows providers to manage accounts receivable more effectively. Key offerings now focus on end-to-end automation, from patient access management and financial clearance to final remittance advice processing and bad debt reduction, ensuring billing compliance and improving patient responsibility estimation.

What are the Key Data Covered in this Healthcare Revenue Cycle Management (RCM) Software Market Research and Growth Report?

  • What is the expected growth of the Healthcare Revenue Cycle Management (RCM) Software Market between 2026 and 2030?

    • USD 55.13 billion, at a CAGR of 12.6%

  • What segmentation does the market report cover?

    • The report is segmented by Deployment (Cloud-based, and On-premises), End-user (Hospitals, Physicians, and Medical labs), Product Type (RCM services, Integrated RCM software, and Standalone RCM modules) and Geography (North America, Europe, APAC, South America, Middle East and Africa)

  • Which regions are analyzed in the report?

    • North America, Europe, APAC, South America and Middle East and Africa

  • What are the key growth drivers and market challenges?

    • Proliferation of agentic AI and autonomous coding workflows, Global workforce depletion and structural deficit of specialized billing talent

  • Who are the major players in the Healthcare Revenue Cycle Management (RCM) Software Market?

    • 3M Co., Athenahealth Inc., Chetu Inc., Cognizant Technology Solution, CompuGroup Medical SE and Co., Epic Systems Corp., Experian Plc, IBM Corp., OSP Labs, ProHance, Quest Diagnostics Inc., Qway Healthcare Inc., R1 RCM Inc., The SSI Group LLC, TruBridge Inc., United Health Group Inc., Waystar Holding Corp., WellSky Corp. and ZH Healthcare Inc.

Market Research Insights

  • The market dynamics are heavily influenced by a push toward automation and consumer-centric financial experiences. Providers are leveraging RCM automation software to address administrative burdens, with advanced platforms demonstrating the ability to reduce claim denials by up to 44% through automated denial prediction. The evolution toward value-based care models is also compelling the adoption of sophisticated healthcare financial management tools.
  • A key driver is the integration of AI in revenue cycle management, which automates tasks and can absorb over 30% of routine administrative duties, freeing staff for higher-value work. This push for efficiency extends to the patient side, with a focus on patient payment solutions and digital patient engagement to improve collection rates and satisfaction.
  • Interoperability standards remain critical for connecting disparate systems, enabling seamless data flow for better revenue cycle optimization.

We can help! Our analysts can customize this healthcare revenue cycle management (rcm) software market research report to meet your requirements.

Get in touch

1. Executive Summary

1.1 Market overview

Executive Summary - Chart on Market Overview
Executive Summary - Data Table on Market Overview
Executive Summary - Chart on Global Market Characteristics
Executive Summary - Chart on Market by Geography
Executive Summary - Chart on Market Segmentation by Deployment
Executive Summary - Chart on Market Segmentation by End-user
Executive Summary - Chart on Market Segmentation by Product Type
Executive Summary - Chart on Incremental Growth
Executive Summary - Data Table on Incremental Growth
Executive Summary - Chart on Company Market Positioning

2. Technavio Analysis

2.1 Analysis of price sensitivity, lifecycle, customer purchase basket, adoption rates, and purchase criteria

2.2 Criticality of inputs and Factors of differentiation

Chart on Overview on criticality of inputs and factors of differentiation

2.3 Factors of disruption

Chart on Overview on factors of disruption

2.4 Impact of drivers and challenges

Chart on Impact of drivers and challenges in 2025 and 2030

3. Market Landscape

3.1 Market ecosystem

Chart on Parent Market
Data Table on - Parent Market

3.2 Market characteristics

Chart on Market characteristics analysis

3.3 Value chain analysis

Chart on Value chain analysis

4. Market Sizing

4.1 Market definition

Data Table on Offerings of companies included in the market definition

4.2 Market segment analysis

Market segments

4.3 Market size 2025

4.4 Market outlook: Forecast for 2025-2030

Chart on Global - Market size and forecast 2025-2030 ($ million)
Data Table on Global - Market size and forecast 2025-2030 ($ million)
Chart on Global Market: Year-over-year growth 2025-2030 (%)
Data Table on Global Market: Year-over-year growth 2025-2030 (%)

5. Historic Market Size

5.1 Global Healthcare Revenue Cycle Management (RCM) Software Market 2020 - 2024

Historic Market Size - Data Table on Global Healthcare Revenue Cycle Management (RCM) Software Market 2020 - 2024 ($ million)

5.2 Deployment segment analysis 2020 - 2024

Historic Market Size - Deployment Segment 2020 - 2024 ($ million)

5.3 End-user segment analysis 2020 - 2024

Historic Market Size - End-user Segment 2020 - 2024 ($ million)

5.4 Product Type segment analysis 2020 - 2024

Historic Market Size - Product Type Segment 2020 - 2024 ($ million)

5.5 Geography segment analysis 2020 - 2024

Historic Market Size - Geography Segment 2020 - 2024 ($ million)

5.6 Country segment analysis 2020 - 2024

Historic Market Size - Country Segment 2020 - 2024 ($ million)

6. Qualitative Analysis

6.1 Impact of AI on Global Healthcare Revenue Cycle Management (RCM) Software Market

7. Five Forces Analysis

7.1 Five forces summary

Five forces analysis - Comparison between 2025 and 2030

7.2 Bargaining power of buyers

Bargaining power of buyers - Impact of key factors 2025 and 2030

7.3 Bargaining power of suppliers

Bargaining power of suppliers - Impact of key factors in 2025 and 2030

7.4 Threat of new entrants

Threat of new entrants - Impact of key factors in 2025 and 2030

7.5 Threat of substitutes

Threat of substitutes - Impact of key factors in 2025 and 2030

7.6 Threat of rivalry

Threat of rivalry - Impact of key factors in 2025 and 2030

7.7 Market condition

Chart on Market condition - Five forces 2025 and 2030

8. Market Segmentation by Deployment

8.1 Market segments

Chart on Deployment - Market share 2025-2030 (%)
Data Table on Deployment - Market share 2025-2030 (%)

8.2 Comparison by Deployment

Chart on Comparison by Deployment
Data Table on Comparison by Deployment

8.3 Cloud-based - Market size and forecast 2025-2030

Chart on Cloud-based - Market size and forecast 2025-2030 ($ million)
Data Table on Cloud-based - Market size and forecast 2025-2030 ($ million)
Chart on Cloud-based - Year-over-year growth 2025-2030 (%)
Data Table on Cloud-based - Year-over-year growth 2025-2030 (%)

8.4 On-premises - Market size and forecast 2025-2030

Chart on On-premises - Market size and forecast 2025-2030 ($ million)
Data Table on On-premises - Market size and forecast 2025-2030 ($ million)
Chart on On-premises - Year-over-year growth 2025-2030 (%)
Data Table on On-premises - Year-over-year growth 2025-2030 (%)

8.5 Market opportunity by Deployment

Market opportunity by Deployment ($ million)
Data Table on Market opportunity by Deployment ($ million)

9. Market Segmentation by End-user

9.1 Market segments

Chart on End-user - Market share 2025-2030 (%)
Data Table on End-user - Market share 2025-2030 (%)

9.2 Comparison by End-user

Chart on Comparison by End-user
Data Table on Comparison by End-user

9.3 Hospitals - Market size and forecast 2025-2030

Chart on Hospitals - Market size and forecast 2025-2030 ($ million)
Data Table on Hospitals - Market size and forecast 2025-2030 ($ million)
Chart on Hospitals - Year-over-year growth 2025-2030 (%)
Data Table on Hospitals - Year-over-year growth 2025-2030 (%)

9.4 Physicians - Market size and forecast 2025-2030

Chart on Physicians - Market size and forecast 2025-2030 ($ million)
Data Table on Physicians - Market size and forecast 2025-2030 ($ million)
Chart on Physicians - Year-over-year growth 2025-2030 (%)
Data Table on Physicians - Year-over-year growth 2025-2030 (%)

9.5 Medical labs - Market size and forecast 2025-2030

Chart on Medical labs - Market size and forecast 2025-2030 ($ million)
Data Table on Medical labs - Market size and forecast 2025-2030 ($ million)
Chart on Medical labs - Year-over-year growth 2025-2030 (%)
Data Table on Medical labs - Year-over-year growth 2025-2030 (%)

9.6 Market opportunity by End-user

Market opportunity by End-user ($ million)
Data Table on Market opportunity by End-user ($ million)

10. Market Segmentation by Product Type

10.1 Market segments

Chart on Product Type - Market share 2025-2030 (%)
Data Table on Product Type - Market share 2025-2030 (%)

10.2 Comparison by Product Type

Chart on Comparison by Product Type
Data Table on Comparison by Product Type

10.3 RCM services - Market size and forecast 2025-2030

Chart on RCM services - Market size and forecast 2025-2030 ($ million)
Data Table on RCM services - Market size and forecast 2025-2030 ($ million)
Chart on RCM services - Year-over-year growth 2025-2030 (%)
Data Table on RCM services - Year-over-year growth 2025-2030 (%)

10.4 Integrated RCM software - Market size and forecast 2025-2030

Chart on Integrated RCM software - Market size and forecast 2025-2030 ($ million)
Data Table on Integrated RCM software - Market size and forecast 2025-2030 ($ million)
Chart on Integrated RCM software - Year-over-year growth 2025-2030 (%)
Data Table on Integrated RCM software - Year-over-year growth 2025-2030 (%)

10.5 Standalone RCM modules - Market size and forecast 2025-2030

Chart on Standalone RCM modules - Market size and forecast 2025-2030 ($ million)
Data Table on Standalone RCM modules - Market size and forecast 2025-2030 ($ million)
Chart on Standalone RCM modules - Year-over-year growth 2025-2030 (%)
Data Table on Standalone RCM modules - Year-over-year growth 2025-2030 (%)

10.6 Market opportunity by Product Type

Market opportunity by Product Type ($ million)
Data Table on Market opportunity by Product Type ($ million)

11. Customer Landscape

11.1 Customer landscape overview

Analysis of price sensitivity, lifecycle, customer purchase basket, adoption rates, and purchase criteria

12. Geographic Landscape

12.1 Geographic segmentation

Chart on Market share by geography 2025-2030 (%)
Data Table on Market share by geography 2025-2030 (%)

12.2 Geographic comparison

Chart on Geographic comparison
Data Table on Geographic comparison

12.3 North America - Market size and forecast 2025-2030

Chart on North America - Market size and forecast 2025-2030 ($ million)
Data Table on North America - Market size and forecast 2025-2030 ($ million)
Chart on North America - Year-over-year growth 2025-2030 (%)
Data Table on North America - Year-over-year growth 2025-2030 (%)
Chart on Regional Comparison - North America
Data Table on Regional Comparison - North America

12.3.1 US - Market size and forecast 2025-2030

Chart on US - Market size and forecast 2025-2030 ($ million)
Data Table on US - Market size and forecast 2025-2030 ($ million)
Chart on US - Year-over-year growth 2025-2030 (%)
Data Table on US - Year-over-year growth 2025-2030 (%)

12.3.2 Canada - Market size and forecast 2025-2030

Chart on Canada - Market size and forecast 2025-2030 ($ million)
Data Table on Canada - Market size and forecast 2025-2030 ($ million)
Chart on Canada - Year-over-year growth 2025-2030 (%)
Data Table on Canada - Year-over-year growth 2025-2030 (%)

12.3.3 Mexico - Market size and forecast 2025-2030

Chart on Mexico - Market size and forecast 2025-2030 ($ million)
Data Table on Mexico - Market size and forecast 2025-2030 ($ million)
Chart on Mexico - Year-over-year growth 2025-2030 (%)
Data Table on Mexico - Year-over-year growth 2025-2030 (%)

12.4 Europe - Market size and forecast 2025-2030

Chart on Europe - Market size and forecast 2025-2030 ($ million)
Data Table on Europe - Market size and forecast 2025-2030 ($ million)
Chart on Europe - Year-over-year growth 2025-2030 (%)
Data Table on Europe - Year-over-year growth 2025-2030 (%)
Chart on Regional Comparison - Europe
Data Table on Regional Comparison - Europe

12.4.1 Germany - Market size and forecast 2025-2030

Chart on Germany - Market size and forecast 2025-2030 ($ million)
Data Table on Germany - Market size and forecast 2025-2030 ($ million)
Chart on Germany - Year-over-year growth 2025-2030 (%)
Data Table on Germany - Year-over-year growth 2025-2030 (%)

12.4.2 UK - Market size and forecast 2025-2030

Chart on UK - Market size and forecast 2025-2030 ($ million)
Data Table on UK - Market size and forecast 2025-2030 ($ million)
Chart on UK - Year-over-year growth 2025-2030 (%)
Data Table on UK - Year-over-year growth 2025-2030 (%)

12.4.3 France - Market size and forecast 2025-2030

Chart on France - Market size and forecast 2025-2030 ($ million)
Data Table on France - Market size and forecast 2025-2030 ($ million)
Chart on France - Year-over-year growth 2025-2030 (%)
Data Table on France - Year-over-year growth 2025-2030 (%)

12.4.4 Italy - Market size and forecast 2025-2030

Chart on Italy - Market size and forecast 2025-2030 ($ million)
Data Table on Italy - Market size and forecast 2025-2030 ($ million)
Chart on Italy - Year-over-year growth 2025-2030 (%)
Data Table on Italy - Year-over-year growth 2025-2030 (%)

12.4.5 Spain - Market size and forecast 2025-2030

Chart on Spain - Market size and forecast 2025-2030 ($ million)
Data Table on Spain - Market size and forecast 2025-2030 ($ million)
Chart on Spain - Year-over-year growth 2025-2030 (%)
Data Table on Spain - Year-over-year growth 2025-2030 (%)

12.4.6 Switzerland - Market size and forecast 2025-2030

Chart on Switzerland - Market size and forecast 2025-2030 ($ million)
Data Table on Switzerland - Market size and forecast 2025-2030 ($ million)
Chart on Switzerland - Year-over-year growth 2025-2030 (%)
Data Table on Switzerland - Year-over-year growth 2025-2030 (%)

12.5 APAC - Market size and forecast 2025-2030

Chart on APAC - Market size and forecast 2025-2030 ($ million)
Data Table on APAC - Market size and forecast 2025-2030 ($ million)
Chart on APAC - Year-over-year growth 2025-2030 (%)
Data Table on APAC - Year-over-year growth 2025-2030 (%)
Chart on Regional Comparison - APAC
Data Table on Regional Comparison - APAC

12.5.1 China - Market size and forecast 2025-2030

Chart on China - Market size and forecast 2025-2030 ($ million)
Data Table on China - Market size and forecast 2025-2030 ($ million)
Chart on China - Year-over-year growth 2025-2030 (%)
Data Table on China - Year-over-year growth 2025-2030 (%)

12.5.2 India - Market size and forecast 2025-2030

Chart on India - Market size and forecast 2025-2030 ($ million)
Data Table on India - Market size and forecast 2025-2030 ($ million)
Chart on India - Year-over-year growth 2025-2030 (%)
Data Table on India - Year-over-year growth 2025-2030 (%)

12.5.3 Japan - Market size and forecast 2025-2030

Chart on Japan - Market size and forecast 2025-2030 ($ million)
Data Table on Japan - Market size and forecast 2025-2030 ($ million)
Chart on Japan - Year-over-year growth 2025-2030 (%)
Data Table on Japan - Year-over-year growth 2025-2030 (%)

12.5.4 South Korea - Market size and forecast 2025-2030

Chart on South Korea - Market size and forecast 2025-2030 ($ million)
Data Table on South Korea - Market size and forecast 2025-2030 ($ million)
Chart on South Korea - Year-over-year growth 2025-2030 (%)
Data Table on South Korea - Year-over-year growth 2025-2030 (%)

12.5.5 Australia - Market size and forecast 2025-2030

Chart on Australia - Market size and forecast 2025-2030 ($ million)
Data Table on Australia - Market size and forecast 2025-2030 ($ million)
Chart on Australia - Year-over-year growth 2025-2030 (%)
Data Table on Australia - Year-over-year growth 2025-2030 (%)

12.5.6 Singapore - Market size and forecast 2025-2030

Chart on Singapore - Market size and forecast 2025-2030 ($ million)
Data Table on Singapore - Market size and forecast 2025-2030 ($ million)
Chart on Singapore - Year-over-year growth 2025-2030 (%)
Data Table on Singapore - Year-over-year growth 2025-2030 (%)

12.6 South America - Market size and forecast 2025-2030

Chart on South America - Market size and forecast 2025-2030 ($ million)
Data Table on South America - Market size and forecast 2025-2030 ($ million)
Chart on South America - Year-over-year growth 2025-2030 (%)
Data Table on South America - Year-over-year growth 2025-2030 (%)
Chart on Regional Comparison - South America
Data Table on Regional Comparison - South America

12.6.1 Brazil - Market size and forecast 2025-2030

Chart on Brazil - Market size and forecast 2025-2030 ($ million)
Data Table on Brazil - Market size and forecast 2025-2030 ($ million)
Chart on Brazil - Year-over-year growth 2025-2030 (%)
Data Table on Brazil - Year-over-year growth 2025-2030 (%)

12.6.2 Argentina - Market size and forecast 2025-2030

Chart on Argentina - Market size and forecast 2025-2030 ($ million)
Data Table on Argentina - Market size and forecast 2025-2030 ($ million)
Chart on Argentina - Year-over-year growth 2025-2030 (%)
Data Table on Argentina - Year-over-year growth 2025-2030 (%)

12.6.3 Chile - Market size and forecast 2025-2030

Chart on Chile - Market size and forecast 2025-2030 ($ million)
Data Table on Chile - Market size and forecast 2025-2030 ($ million)
Chart on Chile - Year-over-year growth 2025-2030 (%)
Data Table on Chile - Year-over-year growth 2025-2030 (%)

12.7 Middle East and Africa - Market size and forecast 2025-2030

Chart on Middle East and Africa - Market size and forecast 2025-2030 ($ million)
Data Table on Middle East and Africa - Market size and forecast 2025-2030 ($ million)
Chart on Middle East and Africa - Year-over-year growth 2025-2030 (%)
Data Table on Middle East and Africa - Year-over-year growth 2025-2030 (%)
Chart on Regional Comparison - Middle East and Africa
Data Table on Regional Comparison - Middle East and Africa

12.7.1 Saudi Arabia - Market size and forecast 2025-2030

Chart on Saudi Arabia - Market size and forecast 2025-2030 ($ million)
Data Table on Saudi Arabia - Market size and forecast 2025-2030 ($ million)
Chart on Saudi Arabia - Year-over-year growth 2025-2030 (%)
Data Table on Saudi Arabia - Year-over-year growth 2025-2030 (%)

12.7.2 UAE - Market size and forecast 2025-2030

Chart on UAE - Market size and forecast 2025-2030 ($ million)
Data Table on UAE - Market size and forecast 2025-2030 ($ million)
Chart on UAE - Year-over-year growth 2025-2030 (%)
Data Table on UAE - Year-over-year growth 2025-2030 (%)

12.7.3 South Africa - Market size and forecast 2025-2030

Chart on South Africa - Market size and forecast 2025-2030 ($ million)
Data Table on South Africa - Market size and forecast 2025-2030 ($ million)
Chart on South Africa - Year-over-year growth 2025-2030 (%)
Data Table on South Africa - Year-over-year growth 2025-2030 (%)

12.7.4 Egypt - Market size and forecast 2025-2030

Chart on Egypt - Market size and forecast 2025-2030 ($ million)
Data Table on Egypt - Market size and forecast 2025-2030 ($ million)
Chart on Egypt - Year-over-year growth 2025-2030 (%)
Data Table on Egypt - Year-over-year growth 2025-2030 (%)

12.7.5 Nigeria - Market size and forecast 2025-2030

Chart on Nigeria - Market size and forecast 2025-2030 ($ million)
Data Table on Nigeria - Market size and forecast 2025-2030 ($ million)
Chart on Nigeria - Year-over-year growth 2025-2030 (%)
Data Table on Nigeria - Year-over-year growth 2025-2030 (%)

12.8 Market opportunity by geography

Market opportunity by geography ($ million)
Data Tables on Market opportunity by geography ($ million)

13. Drivers, Challenges, and Opportunity

13.1 Market drivers

Proliferation of agentic AI and autonomous coding workflows
Rise in adoption of EHR
Evolution of patient-centric financial engagement and transparent billing

13.2 Market challenges

Global workforce depletion and structural deficit of specialized billing talent
Proliferation of double-layered extortion and systemic cybersecurity vulnerabilities
Regulatory fragmentation and escalating burden of reimbursement compliance

13.3 Impact of drivers and challenges

Impact of drivers and challenges in 2025 and 2030

13.4 Market opportunities

Cloud-native platforms and interoperable revenue ecosystems
Hyper-personalization of patient financial experience and digital payment rails
Strategic integration of interoperable data corridors and payer-provider alignment

14. Competitive Landscape

14.1 Overview

14.2

Overview on criticality of inputs and factors of differentiation

14.3 Landscape disruption

Overview on factors of disruption

14.4 Industry risks

Impact of key risks on business

15. Competitive Analysis

15.1 Companies profiled

Companies covered

15.2 Company ranking index

15.3 Market positioning of companies

Matrix on companies position and classification

15.4 3M Co.

3M Co. - Overview
3M Co. - Business segments
3M Co. - Key news
3M Co. - Key offerings
3M Co. - Segment focus
SWOT

15.5 Athenahealth Inc.

Athenahealth Inc. - Overview
Athenahealth Inc. - Product / Service
Athenahealth Inc. - Key offerings
SWOT

15.6 Chetu Inc.

Chetu Inc. - Overview
Chetu Inc. - Product / Service
Chetu Inc. - Key offerings
SWOT

15.7 Cognizant Technology Solution

Cognizant Technology Solution - Overview
Cognizant Technology Solution - Business segments
Cognizant Technology Solution - Key news
Cognizant Technology Solution - Key offerings
Cognizant Technology Solution - Segment focus
SWOT

15.8 CompuGroup Medical SE and Co.

CompuGroup Medical SE and Co. - Overview
CompuGroup Medical SE and Co. - Business segments
CompuGroup Medical SE and Co. - Key offerings
CompuGroup Medical SE and Co. - Segment focus
SWOT

15.9 Epic Systems Corp.

Epic Systems Corp. - Overview
Epic Systems Corp. - Product / Service
Epic Systems Corp. - Key offerings
SWOT

15.10 Experian Plc

Experian Plc - Overview
Experian Plc - Business segments
Experian Plc - Key offerings
Experian Plc - Segment focus
SWOT

15.11 IBM Corp.

IBM Corp. - Overview
IBM Corp. - Business segments
IBM Corp. - Key news
IBM Corp. - Key offerings
IBM Corp. - Segment focus
SWOT

15.12 Quest Diagnostics Inc.

Quest Diagnostics Inc. - Overview
Quest Diagnostics Inc. - Business segments
Quest Diagnostics Inc. - Key offerings
Quest Diagnostics Inc. - Segment focus
SWOT

15.13 Qway Healthcare Inc.

Qway Healthcare Inc. - Overview
Qway Healthcare Inc. - Product / Service
Qway Healthcare Inc. - Key offerings
SWOT

15.14 R1 RCM Inc.

R1 RCM Inc. - Overview
R1 RCM Inc. - Product / Service
R1 RCM Inc. - Key offerings
SWOT

15.15 TruBridge Inc.

TruBridge Inc. - Overview
TruBridge Inc. - Business segments
TruBridge Inc. - Key offerings
TruBridge Inc. - Segment focus
SWOT

15.16 United Health Group Inc.

United Health Group Inc. - Overview
United Health Group Inc. - Business segments
United Health Group Inc. - Key offerings
United Health Group Inc. - Segment focus
SWOT

15.17 Waystar Holding Corp.

Waystar Holding Corp. - Overview
Waystar Holding Corp. - Product / Service
Waystar Holding Corp. - Key offerings
SWOT

15.18 WellSky Corp.

WellSky Corp. - Overview
WellSky Corp. - Product / Service
WellSky Corp. - Key offerings
SWOT

16. Appendix

16.1 Scope of the report

Market definition
Objectives
Notes and caveats

16.2 Inclusions and exclusions checklist

Inclusions checklist
Exclusions checklist

16.3 Currency conversion rates for US$

16.4 Research methodology

16.5 Data procurement

Information sources

16.6 Data validation

16.7 Validation techniques employed for market sizing

16.8 Data synthesis

16.9 360 degree market analysis

16.10 List of abbreviations

Research Methodology

Technavio presents a detailed picture of the market by way of study, synthesis, and summation of data from multiple sources. The analysts have presented the various facets of the market with a particular focus on identifying the key industry influencers. The data thus presented is comprehensive, reliable, and the result of extensive research, both primary and secondary.

INFORMATION SOURCES

Primary sources

  • Manufacturers and suppliers
  • Channel partners
  • Industry experts
  • Strategic decision makers

Secondary sources

  • Industry journals and periodicals
  • Government data
  • Financial reports of key industry players
  • Historical data
  • Press releases

DATA ANALYSIS

Data Synthesis

  • Collation of data
  • Estimation of key figures
  • Analysis of derived insights

Data Validation

  • Triangulation with data models
  • Reference against proprietary databases
  • Corroboration with industry experts

REPORT WRITING

Qualitative

  • Market drivers
  • Market challenges
  • Market trends
  • Five forces analysis

Quantitative

  • Market size and forecast
  • Market segmentation
  • Geographical insights
  • Competitive landscape

Interested in this report?

Get your sample now to see our research methodology and insights!

Download Now

Frequently Asked Questions

Healthcare Revenue Cycle Management (RCM) Software market growth will increase by USD 55132.4 million during 2026-2030.

The Healthcare Revenue Cycle Management (RCM) Software market is expected to grow at a CAGR of 12.6% during 2026-2030.

Healthcare Revenue Cycle Management (RCM) Software market is segmented by Deployment (Cloud-based, On-premises) End-user (Hospitals, Physicians, Medical labs) Product type (RCM services, Integrated RCM software, Standalone RCM modules)

3M Co., Athenahealth Inc., Chetu Inc., Cognizant Technology Solution, CompuGroup Medical SE and Co., Epic Systems Corp., Experian Plc, IBM Corp., OSP Labs, ProHance, Quest Diagnostics Inc., Qway Healthcare Inc., R1 RCM Inc., The SSI Group LLC, TruBridge Inc., United Health Group Inc., Waystar Holding Corp., WellSky Corp., ZH Healthcare Inc. are a few of the key vendors in the Healthcare Revenue Cycle Management (RCM) Software market.

North America will register the highest growth rate of 60.1% among the other regions. Therefore, the Healthcare Revenue Cycle Management (RCM) Software market in North America is expected to garner significant business opportunities for the vendors during the forecast period.

US, Canada, Mexico, Germany, UK, France, Italy, Spain, Switzerland, China, India, Japan, South Korea, Australia, Singapore, Brazil, Argentina, Chile, Saudi Arabia, UAE, South Africa, Egypt, Nigeria

  • Proliferation of agentic AI and autonomous coding workflows is the driving factor this market.

The Healthcare Revenue Cycle Management (RCM) Software market vendors should focus on grabbing business opportunities from the Deployment segment as it accounted for the largest market share in the base year.
RIA - Research AI Assistant
Ask RIA