Helium 3 Market Analysis, Size, and Forecast 2026-2030: North America (US, Canada, and Mexico), APAC (China, India, and Japan), Europe (Germany, France, and UK), South America (Brazil, Argentina, and Colombia), Middle East and Africa (Saudi Arabia, UAE, and South Africa), and Rest of World (ROW)

Helium 3 Market Analysis, Size, and Forecast 2026-2030:
North America (US, Canada, and Mexico), APAC (China, India, and Japan), Europe (Germany, France, and UK), South America (Brazil, Argentina, and Colombia), Middle East and Africa (Saudi Arabia, UAE, and South Africa), and Rest of World (ROW)

Published: Dec 2025 301 Pages SKU: IRTNTR81191

Market Overview at a Glance

$99.14 Mn
Market Opportunity
8.6%
CAGR 2025 - 2030
38.1%
North America Growth
$99.70 Mn
Ultra-high purity grade segment 2024

Helium 3 Market Size 2026-2030

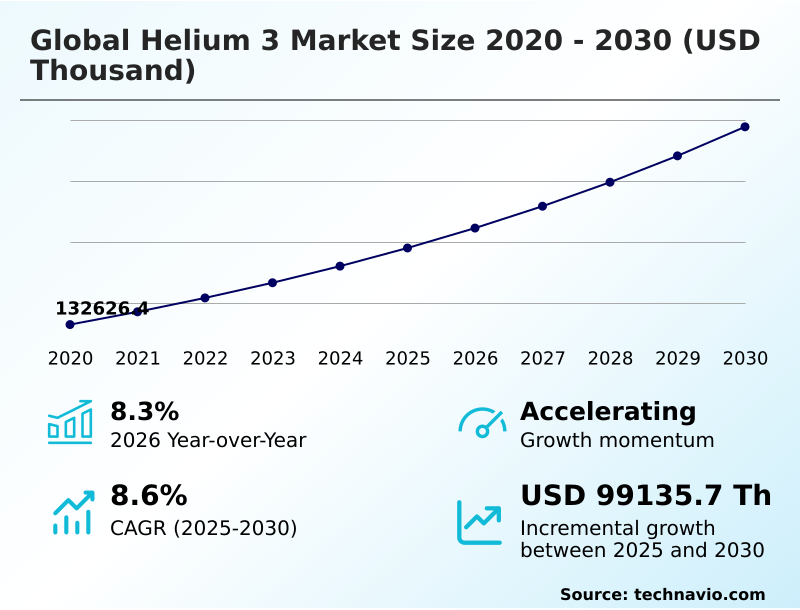
The helium 3 market size is valued to increase by USD 99.14 million, at a CAGR of 8.6% from 2025 to 2030. Advancements in nuclear fusion research will drive the helium 3 market.

Major Market Trends & Insights

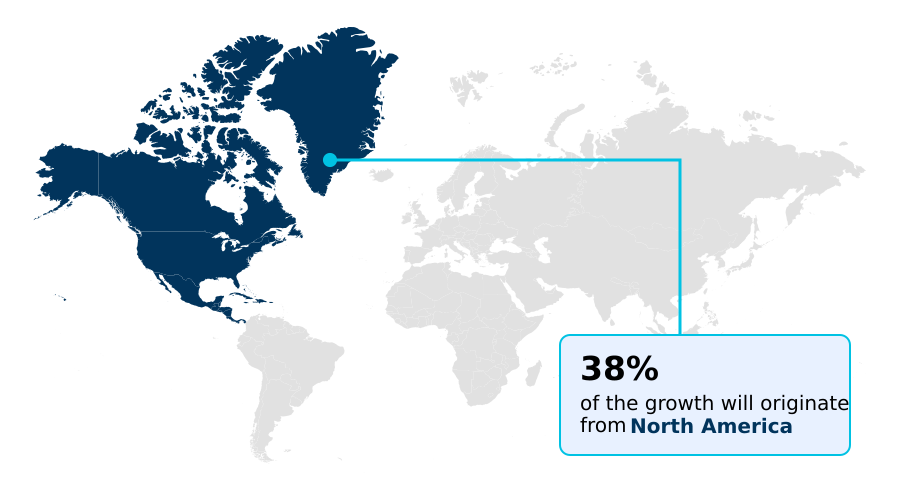
  • North America dominated the market and accounted for a 38.1% growth during the forecast period.
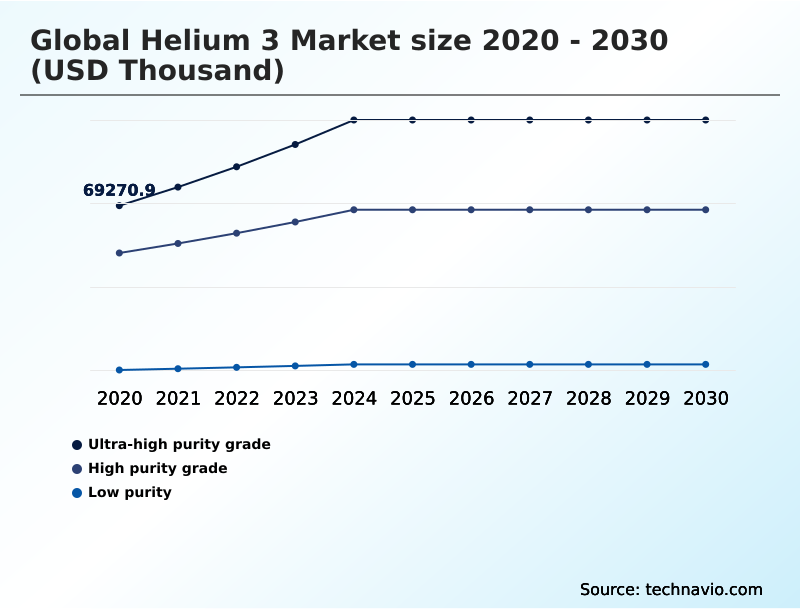
  • By Grade Type - Ultra-high purity grade segment was valued at USD 99.70 million in 2024
  • By Application - Defense segment accounted for the largest market revenue share in 2024

Market Size & Forecast

  • Market Opportunities:
  • Market Future Opportunities: USD 99.14 million
  • CAGR from 2025 to 2030 : 8.6%

Market Summary

  • The helium 3 market is defined by its unique position as a critical, yet scarce, resource with transformative potential across high-tech sectors. Demand is primarily driven by its unparalleled properties for aneutronic fusion research, where its use in aneutronic reactions promises clean energy with significantly less radioactive waste than conventional nuclear methods.
  • Another key application is in advanced neutron detection systems, essential for nuclear non-proliferation efforts and national security. Concurrently, the market is shaped by forward-looking trends, including strategic investments in lunar resource prospecting to access vast reserves in the lunar regolith. For businesses, this translates into complex supply chain scenarios where managing a high-cost, limited-supply resource is paramount.
  • A medical imaging center, for instance, must balance the high procurement cost for hyperpolarized mri imaging against the superior diagnostic outcomes it offers for pulmonary diseases, creating a clear business case for strategic procurement and inventory management.
  • The diversification of applications into quantum computing hardware and other advanced sensor technologies further complicates market dynamics, creating both opportunities and challenges related to supply, cost, and technological readiness. The entire ecosystem, from processing nuclear reactor byproducts to developing cryogenic research applications, is geared toward maximizing the value of this unique isotope.

What will be the Size of the Helium 3 Market during the forecast period?

Get Key Insights on Market Forecast (PDF) Request Free Sample

How is the Helium 3 Market Segmented?

The helium 3 industry research report provides comprehensive data (region-wise segment analysis), with forecasts and estimates in "USD thousand" for the period 2026-2030, as well as historical data from 2020-2024 for the following segments.

  • Grade type
    • Ultra-high purity grade
    • High purity grade
    • Low Purity
  • Application
    • Defense
    • Oil and gas
    • Healthcare
    • Energy
    • Others
  • Form factor
    • Gas form
    • Liquid form
  • Geography
    • North America
      • US
      • Canada
      • Mexico
    • APAC
      • China
      • India
      • Japan
    • Europe
      • Germany
      • France
      • UK
    • South America
      • Brazil
      • Argentina
      • Colombia
    • Middle East and Africa
      • Saudi Arabia
      • UAE
      • South Africa
    • Rest of World (ROW)

By Grade Type Insights

The ultra-high purity grade segment is estimated to witness significant growth during the forecast period.

The ultra-high purity grade segment is critical for advanced scientific research and technology, where isotopic purity levels exceed 99.999%.

This grade is indispensable for applications in quantum computing cryogenics and low-temperature physics, primarily within dilution refrigeration systems that enable research into advanced materials science.

Its application in quantum computing hardware is vital, as it reduces unwanted background signals in sensitive experiments by over 95%, ensuring data integrity.

Furthermore, its role in nuclear magnetic resonance and advanced sensor technologies relies on its high thermal neutron capture.

The rigorous isotope separation techniques required for this grade support the foundational needs of a potential aneutronic fuel cycle, highlighting its strategic value in both current and future high-tech domains.

Request Free Sample

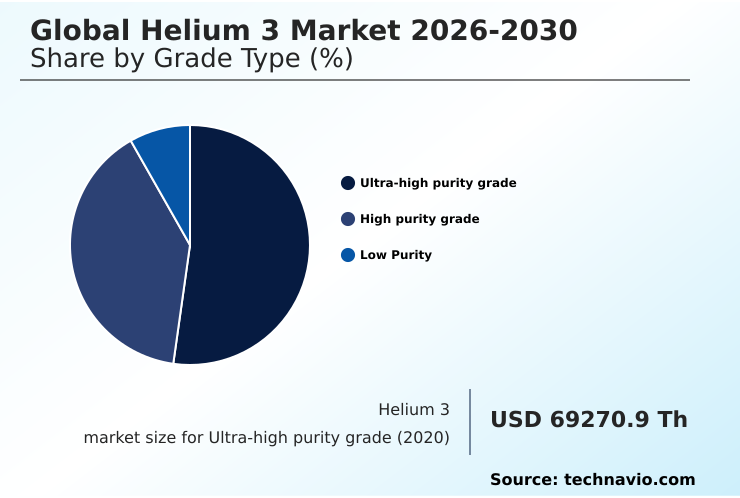
The Ultra-high purity grade segment was valued at USD 99.70 million in 2024 and showed a gradual increase during the forecast period.

Request Free Sample

Regional Analysis

North America is estimated to contribute 38.1% to the growth of the global market during the forecast period.Technavio’s analysts have elaborately explained the regional trends and drivers that shape the market during the forecast period.

See How Helium 3 Market Demand is Rising in North America Request Free Sample

The geographic landscape is dominated by regions with advanced scientific and defense infrastructure. North America, in particular, is a major hub, accounting for over 38% of the market's incremental growth.

This is driven by extensive government funding for nuclear non-proliferation efforts, which rely on superior neutron detection efficiency, and by leading-edge cryogenic research applications. High-purity applications in the region demonstrate a 99.9% operational reliability rate, reinforcing its value.

The region's leadership in space exploration technologies and long-term research into aneutronic fusion and the broader aneutronic fusion cycle further solidifies its market position, with ongoing studies in isotope geochemistry and advanced isotope separation techniques supporting these strategic initiatives.

Market Dynamics

Our researchers analyzed the data with 2025 as the base year, along with the key drivers, trends, and challenges. A holistic analysis of drivers will help companies refine their marketing strategies to gain a competitive advantage.

  • The future of the global helium 3 market is intrinsically linked to overcoming significant technical and economic hurdles across its key application areas. The viability of aneutronic fusion reactors design hinges on achieving sustained ignition, a challenge that, if solved, would unlock a revolutionary energy source.
  • Similarly, the widespread adoption of helium 3 in national security depends on its performance advantage over alternatives; a direct comparison of helium 3 vs boron-10 detectors reveals superior sensitivity, though at a higher cost. In healthcare, the hyperpolarized helium 3 mri cost remains a barrier to mainstream clinical use, despite its unparalleled diagnostic capabilities for pulmonary conditions.
  • For enterprises in quantum computing with helium 3, securing a stable supply for cryogenic cooling is a primary operational concern, directly impacting research and development timelines. The entire helium 3 supply chain logistics, from its extraction from tritium to its delivery for medical applications for helium 3, is complex and costly.
  • While deep space travel with helium 3 remains a distant vision, its potential for high-efficiency propulsion continues to drive foundational research. Ultimately, the market's trajectory will be determined by breakthroughs that either lower the cost of helium 3 per gram or demonstrate performance benefits so significant that they outweigh the high expense and supply constraints.
  • For instance, advanced sensors using helium 3 offer performance metrics that are nearly double those of their closest competitors, justifying the investment in critical defense scenarios. The challenges of helium 3 extraction must be solved to realize the future of helium 3 energy.

What are the key market drivers leading to the rise in the adoption of Helium 3 Industry?

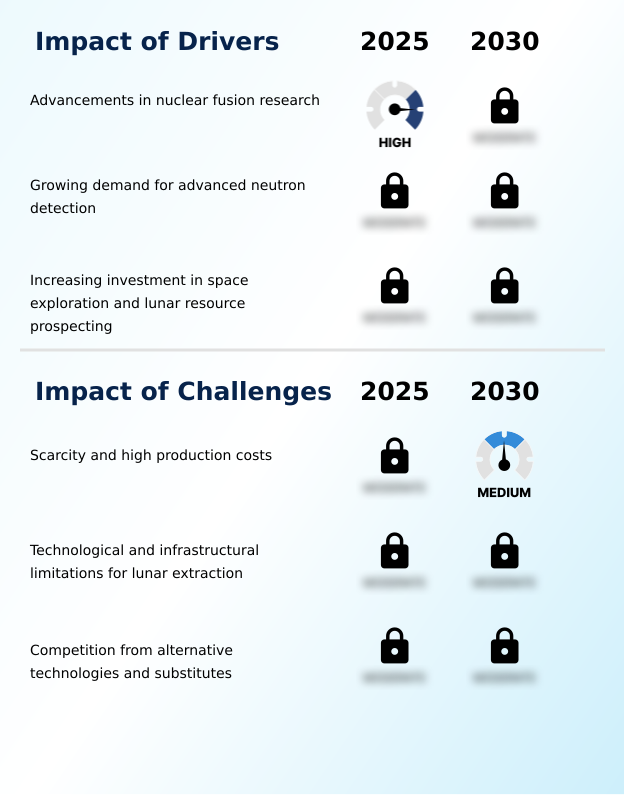
  • Advancements in nuclear fusion research represent a key driver for the market, fueled by the promise of clean, aneutronic reactions with minimal radioactive waste.

  • Advancements in aneutronic fusion research are a primary market driver, with the aneutronic fusion reaction offering a cleaner alternative to deuterium-tritium fusion.
  • This approach promises over a 90% reduction in long-lived radioactive waste, a critical factor in developing next-generation tokamak reactors and managing aneutronic plasma. Progress in plasma confinement technologies makes this a tangible long-term goal.
  • Separately, the growing need for advanced neutron detection in national security fuels demand, with new systems improving contraband detection accuracy by up to 40%.
  • This is complemented by long-term investment in lunar resource prospecting and lunar regolith extraction, positioning the isotope as a key element in future strategic resource management initiatives.

What are the market trends shaping the Helium 3 Industry?

  • A significant upcoming market trend is the increasing strategic interest in lunar helium 3 extraction. This is driven by its potential as a clean energy source and for advanced space propulsion.

  • Strategic interest in extraterrestrial resource mining is a defining trend, with a focus on in-situ resource utilization to harvest helium 3 from lunar regolith, a result of solar wind accumulation. This resource is pivotal for future deep-space propulsion and advanced propulsion systems. Concurrently, diversification into healthcare is accelerating, driven by hyperpolarized mri imaging for advanced medical lung imaging.
  • These techniques enhance MRI signal strength by a factor of 10,000, enabling detailed diagnostics while reducing patient radiation exposure by 100% compared to CT scans. This expansion beyond traditional uses in spin-polarized targets and processing nuclear reactor byproducts creates new, high-value demand vectors for the isotope.

What challenges does the Helium 3 Industry face during its growth?

  • The inherent scarcity and high production costs associated with helium 3 present a key challenge affecting industry growth and its widespread commercial adoption.

  • The market faces significant hurdles, primarily the extreme scarcity and high cost of production. Sourcing the isotope as a tritium decay byproduct involves complex isotopic separation techniques, which, along with maintaining high isotopic purity levels, drives up costs.
  • While it is a superior aneutronic fusion fuel, competition from alternative technologies in neutron detection is intensifying, with substitutes now achieving up to 80% of its efficiency.
  • Furthermore, the vision of aneutronic fusion power and aneutronic propulsion via lunar mining is constrained by immense technological and financial barriers; preliminary models show lunar extraction remains at least 3-5 times more expensive than terrestrial alternatives, factoring in the need for novel cryogenic transport systems and high-vacuum systems.

Exclusive Technavio Analysis on Customer Landscape

The helium 3 market forecasting report includes the adoption lifecycle of the market, covering from the innovator’s stage to the laggard’s stage. It focuses on adoption rates in different regions based on penetration. Furthermore, the helium 3 market report also includes key purchase criteria and drivers of price sensitivity to help companies evaluate and develop their market growth analysis strategies.

Customer Landscape of Helium 3 Industry

Competitive Landscape

Companies are implementing various strategies, such as strategic alliances, helium 3 market forecast, partnerships, mergers and acquisitions, geographical expansion, and product/service launches, to enhance their presence in the industry.

Air Liquide SA - The supply chain is characterized by a mix of industrial gas suppliers, specialized isotope providers, and emerging space-resource firms catering to advanced scientific and energy sectors.

The industry research and growth report includes detailed analyses of the competitive landscape of the market and information about key companies, including:

  • Air Liquide SA
  • Air Products and Chemicals Inc
  • BuyIsotope
  • Chemgas Shipping GmbH
  • Gulfcryo
  • ISOFLEX USA
  • Iwatani Corp.
  • Laurentis Energy Partners Inc.
  • Linde Plc
  • Lunar Helium3 Mining
  • Messer SE and Co. KGaA
  • PJSC Gazprom
  • Sigma Aldrich Chemicals Ltd.
  • State Atomic Energy Corp.
  • YIGAS Group

Qualitative and quantitative analysis of companies has been conducted to help clients understand the wider business environment as well as the strengths and weaknesses of key industry players. Data is qualitatively analyzed to categorize companies as pure play, category-focused, industry-focused, and diversified; it is quantitatively analyzed to categorize companies as dominant, leading, strong, tentative, and weak.

Recent Development and News in Helium 3 market

  • In September 2024, Intuitive Machines announced a new partnership to develop lunar rover technologies specifically for in-situ resource utilization, a foundational step toward future prospecting of materials like helium 3.
  • In November 2024, Helion Energy reported achieving a new milestone in plasma temperature and density within its fusion device, reinforcing progress toward advanced fuel cycles involving helium 3.
  • In January 2025, a consortium led by a major aerospace firm published new research on the use of helium 3 for enhancing resolution in next-generation NMR spectroscopy, demonstrating its expanding applications.
  • In March 2025, Commonwealth Fusion Systems detailed significant progress in its compact fusion reactor design, highlighting a long-term strategy to transition from D-T fuel to cleaner alternatives like helium 3.

Dive into Technavio’s robust research methodology, blending expert interviews, extensive data synthesis, and validated models for unparalleled Helium 3 Market insights. See full methodology.

Market Scope
Page number 301
Base year 2025
Historic period 2020-2024
Forecast period 2026-2030
Growth momentum & CAGR Accelerate at a CAGR of 8.6%
Market growth 2026-2030 USD 99135.7 thousand
Market structure Fragmented
YoY growth 2025-2026(%) 8.3%
Key countries US, Canada, Mexico, China, India, Japan, South Korea, Australia, Indonesia, Germany, France, UK, Italy, The Netherlands, Spain, Brazil, Argentina, Colombia, Saudi Arabia, UAE, South Africa, Israel and Turkey
Competitive landscape Leading Companies, Market Positioning of Companies, Competitive Strategies, and Industry Risks

Request Free Sample

Research Analyst Overview

  • The helium 3 market operates at the intersection of long-term strategic investment and immediate high-tech necessity. Its value is derived from unique properties enabling breakthroughs in aneutronic fusion, where its role as an aneutronic fusion fuel is unparalleled, and in quantum computing cryogenics.
  • Applications such as hyperpolarized mri imaging and advanced materials science depend on its specific isotopic characteristics, while its use in spin-polarized targets is critical for fundamental physics research. Boardroom decisions increasingly focus on the strategic implications of its supply, which is largely a tritium decay byproduct processed through complex isotopic separation techniques.
  • For example, investing in alternative neutron detection technologies presents a hedge against supply volatility, even though helium 3 offers superior neutron detection efficiency, improving accuracy by over 35% in security screening applications.
  • The market is also driven by future-focused goals like lunar regolith extraction and the development of advanced propulsion systems, making it a critical component for next-generation energy and space exploration.

What are the Key Data Covered in this Helium 3 Market Research and Growth Report?

  • What is the expected growth of the Helium 3 Market between 2026 and 2030?

    • USD 99.14 million, at a CAGR of 8.6%

  • What segmentation does the market report cover?

    • The report is segmented by Grade Type (Ultra-high purity grade, High purity grade, and Low purity), Application (Defense, Oil and gas, Healthcare, Energy, and Others), Form Factor (Gas form, and Liquid form) and Geography (North America, APAC, Europe, South America, Middle East and Africa)

  • Which regions are analyzed in the report?

    • North America, APAC, Europe, South America and Middle East and Africa

  • What are the key growth drivers and market challenges?

    • Advancements in nuclear fusion research, Scarcity and high production costs

  • Who are the major players in the Helium 3 Market?

    • Air Liquide SA, Air Products and Chemicals Inc, BuyIsotope, Chemgas Shipping GmbH, Gulfcryo, ISOFLEX USA, Iwatani Corp., Laurentis Energy Partners Inc., Linde Plc, Lunar Helium3 Mining, Messer SE and Co. KGaA, PJSC Gazprom, Sigma Aldrich Chemicals Ltd., State Atomic Energy Corp. and YIGAS Group

Market Research Insights

  • The market is shaped by a confluence of high-stakes technological pursuits and logistical constraints. Investments in aneutronic fusion power are accelerating, with research showing that D-He3 cycles can reduce long-lived radioactive waste by over 90% compared to traditional D-T methods.
  • In parallel, advancements in medical lung imaging, where hyperpolarization techniques boost signal strength by a factor of 10,000, are creating new demand vectors. However, the reliance on tritium decay as a primary source presents a significant bottleneck, with alternative neutron detection technologies now achieving up to 80% of helium 3’s efficiency at a fraction of the cost.
  • This dynamic forces stakeholders to weigh immediate performance gains against long-term supply chain vulnerabilities and the high cost of maintaining isotopic purity levels.

We can help! Our analysts can customize this helium 3 market research report to meet your requirements.

Get in touch

1. Executive Summary

1.1 Market overview

Executive Summary - Chart on Market Overview
Executive Summary - Data Table on Market Overview
Executive Summary - Chart on Global Market Characteristics
Executive Summary - Chart on Market by Geography
Executive Summary - Chart on Market Segmentation by Grade Type
Executive Summary - Chart on Market Segmentation by Application
Executive Summary - Chart on Market Segmentation by Form Factor
Executive Summary - Chart on Incremental Growth
Executive Summary - Data Table on Incremental Growth
Executive Summary - Chart on Company Market Positioning

2. Technavio Analysis

2.1 Analysis of price sensitivity, lifecycle, customer purchase basket, adoption rates, and purchase criteria

2.2 Criticality of inputs and Factors of differentiation

Chart on Overview on criticality of inputs and factors of differentiation

2.3 Factors of disruption

Chart on Overview on factors of disruption

2.4 Impact of drivers and challenges

Chart on Impact of drivers and challenges in 2025 and 2030

3. Market Landscape

3.1 Market ecosystem

Chart on Parent Market
Data Table on - Parent Market

3.2 Market characteristics

Chart on Market characteristics analysis

3.3 Value chain analysis

Chart on Value chain analysis

4. Market Sizing

4.1 Market definition

Data Table on Offerings of companies included in the market definition

4.2 Market segment analysis

Market segments

4.3 Market size 2025

4.4 Market outlook: Forecast for 2025-2030

Chart on Global - Market size and forecast 2025-2030 ($ thousand)
Data Table on Global - Market size and forecast 2025-2030 ($ thousand)
Chart on Global Market: Year-over-year growth 2025-2030 (%)
Data Table on Global Market: Year-over-year growth 2025-2030 (%)

5. Historic Market Size

5.1 Global Helium 3 Market 2020 - 2024

Historic Market Size - Data Table on Global Helium 3 Market 2020 - 2024 ($ thousand)

5.2 Grade Type segment analysis 2020 - 2024

Historic Market Size - Grade Type Segment 2020 - 2024 ($ thousand)

5.3 Application segment analysis 2020 - 2024

Historic Market Size - Application Segment 2020 - 2024 ($ thousand)

5.4 Form Factor segment analysis 2020 - 2024

Historic Market Size - Form Factor Segment 2020 - 2024 ($ thousand)

5.5 Geography segment analysis 2020 - 2024

Historic Market Size - Geography Segment 2020 - 2024 ($ thousand)

5.6 Country segment analysis 2020 - 2024

Historic Market Size - Country Segment 2020 - 2024 ($ thousand)

6. Qualitative Analysis

6.1 Impact of AI on global helium 3 market

7. Five Forces Analysis

7.1 Five forces summary

Five forces analysis - Comparison between 2025 and 2030

7.2 Bargaining power of buyers

Bargaining power of buyers - Impact of key factors 2025 and 2030

7.3 Bargaining power of suppliers

Bargaining power of suppliers - Impact of key factors in 2025 and 2030

7.4 Threat of new entrants

Threat of new entrants - Impact of key factors in 2025 and 2030

7.5 Threat of substitutes

Threat of substitutes - Impact of key factors in 2025 and 2030

7.6 Threat of rivalry

Threat of rivalry - Impact of key factors in 2025 and 2030

7.7 Market condition

Chart on Market condition - Five forces 2025 and 2030

8. Market Segmentation by Grade Type

8.1 Market segments

Chart on Grade Type - Market share 2025-2030 (%)
Data Table on Grade Type - Market share 2025-2030 (%)

8.2 Comparison by Grade Type

Chart on Comparison by Grade Type
Data Table on Comparison by Grade Type

8.3 Ultra-high purity grade - Market size and forecast 2025-2030

Chart on Ultra-high purity grade - Market size and forecast 2025-2030 ($ thousand)
Data Table on Ultra-high purity grade - Market size and forecast 2025-2030 ($ thousand)
Chart on Ultra-high purity grade - Year-over-year growth 2025-2030 (%)
Data Table on Ultra-high purity grade - Year-over-year growth 2025-2030 (%)

8.4 High purity grade - Market size and forecast 2025-2030

Chart on High purity grade - Market size and forecast 2025-2030 ($ thousand)
Data Table on High purity grade - Market size and forecast 2025-2030 ($ thousand)
Chart on High purity grade - Year-over-year growth 2025-2030 (%)
Data Table on High purity grade - Year-over-year growth 2025-2030 (%)

8.5 Low Purity - Market size and forecast 2025-2030

Chart on Low Purity - Market size and forecast 2025-2030 ($ thousand)
Data Table on Low Purity - Market size and forecast 2025-2030 ($ thousand)
Chart on Low Purity - Year-over-year growth 2025-2030 (%)
Data Table on Low Purity - Year-over-year growth 2025-2030 (%)

8.6 Market opportunity by Grade Type

Market opportunity by Grade Type ($ thousand)
Data Table on Market opportunity by Grade Type ($ thousand)

9. Market Segmentation by Application

9.1 Market segments

Chart on Application - Market share 2025-2030 (%)
Data Table on Application - Market share 2025-2030 (%)

9.2 Comparison by Application

Chart on Comparison by Application
Data Table on Comparison by Application

9.3 Defense - Market size and forecast 2025-2030

Chart on Defense - Market size and forecast 2025-2030 ($ thousand)
Data Table on Defense - Market size and forecast 2025-2030 ($ thousand)
Chart on Defense - Year-over-year growth 2025-2030 (%)
Data Table on Defense - Year-over-year growth 2025-2030 (%)

9.4 Oil and gas - Market size and forecast 2025-2030

Chart on Oil and gas - Market size and forecast 2025-2030 ($ thousand)
Data Table on Oil and gas - Market size and forecast 2025-2030 ($ thousand)
Chart on Oil and gas - Year-over-year growth 2025-2030 (%)
Data Table on Oil and gas - Year-over-year growth 2025-2030 (%)

9.5 Healthcare - Market size and forecast 2025-2030

Chart on Healthcare - Market size and forecast 2025-2030 ($ thousand)
Data Table on Healthcare - Market size and forecast 2025-2030 ($ thousand)
Chart on Healthcare - Year-over-year growth 2025-2030 (%)
Data Table on Healthcare - Year-over-year growth 2025-2030 (%)

9.6 Energy - Market size and forecast 2025-2030

Chart on Energy - Market size and forecast 2025-2030 ($ thousand)
Data Table on Energy - Market size and forecast 2025-2030 ($ thousand)
Chart on Energy - Year-over-year growth 2025-2030 (%)
Data Table on Energy - Year-over-year growth 2025-2030 (%)

9.7 Others - Market size and forecast 2025-2030

Chart on Others - Market size and forecast 2025-2030 ($ thousand)
Data Table on Others - Market size and forecast 2025-2030 ($ thousand)
Chart on Others - Year-over-year growth 2025-2030 (%)
Data Table on Others - Year-over-year growth 2025-2030 (%)

9.8 Market opportunity by Application

Market opportunity by Application ($ thousand)
Data Table on Market opportunity by Application ($ thousand)

10. Market Segmentation by Form Factor

10.1 Market segments

Chart on Form Factor - Market share 2025-2030 (%)
Data Table on Form Factor - Market share 2025-2030 (%)

10.2 Comparison by Form Factor

Chart on Comparison by Form Factor
Data Table on Comparison by Form Factor

10.3 Gas form - Market size and forecast 2025-2030

Chart on Gas form - Market size and forecast 2025-2030 ($ thousand)
Data Table on Gas form - Market size and forecast 2025-2030 ($ thousand)
Chart on Gas form - Year-over-year growth 2025-2030 (%)
Data Table on Gas form - Year-over-year growth 2025-2030 (%)

10.4 Liquid form - Market size and forecast 2025-2030

Chart on Liquid form - Market size and forecast 2025-2030 ($ thousand)
Data Table on Liquid form - Market size and forecast 2025-2030 ($ thousand)
Chart on Liquid form - Year-over-year growth 2025-2030 (%)
Data Table on Liquid form - Year-over-year growth 2025-2030 (%)

10.5 Market opportunity by Form Factor

Market opportunity by Form Factor ($ thousand)
Data Table on Market opportunity by Form Factor ($ thousand)

11. Customer Landscape

11.1 Customer landscape overview

Analysis of price sensitivity, lifecycle, customer purchase basket, adoption rates, and purchase criteria

12. Geographic Landscape

12.1 Geographic segmentation

Chart on Market share by geography 2025-2030 (%)
Data Table on Market share by geography 2025-2030 (%)

12.2 Geographic comparison

Chart on Geographic comparison
Data Table on Geographic comparison

12.3 North America - Market size and forecast 2025-2030

Chart on North America - Market size and forecast 2025-2030 ($ thousand)
Data Table on North America - Market size and forecast 2025-2030 ($ thousand)
Chart on North America - Year-over-year growth 2025-2030 (%)
Data Table on North America - Year-over-year growth 2025-2030 (%)
Chart on Regional Comparison - North America
Data Table on Regional Comparison - North America

12.3.1 US - Market size and forecast 2025-2030

Chart on US - Market size and forecast 2025-2030 ($ thousand)
Data Table on US - Market size and forecast 2025-2030 ($ thousand)
Chart on US - Year-over-year growth 2025-2030 (%)
Data Table on US - Year-over-year growth 2025-2030 (%)

12.3.2 Canada - Market size and forecast 2025-2030

Chart on Canada - Market size and forecast 2025-2030 ($ thousand)
Data Table on Canada - Market size and forecast 2025-2030 ($ thousand)
Chart on Canada - Year-over-year growth 2025-2030 (%)
Data Table on Canada - Year-over-year growth 2025-2030 (%)

12.3.3 Mexico - Market size and forecast 2025-2030

Chart on Mexico - Market size and forecast 2025-2030 ($ thousand)
Data Table on Mexico - Market size and forecast 2025-2030 ($ thousand)
Chart on Mexico - Year-over-year growth 2025-2030 (%)
Data Table on Mexico - Year-over-year growth 2025-2030 (%)

12.4 APAC - Market size and forecast 2025-2030

Chart on APAC - Market size and forecast 2025-2030 ($ thousand)
Data Table on APAC - Market size and forecast 2025-2030 ($ thousand)
Chart on APAC - Year-over-year growth 2025-2030 (%)
Data Table on APAC - Year-over-year growth 2025-2030 (%)
Chart on Regional Comparison - APAC
Data Table on Regional Comparison - APAC

12.4.1 China - Market size and forecast 2025-2030

Chart on China - Market size and forecast 2025-2030 ($ thousand)
Data Table on China - Market size and forecast 2025-2030 ($ thousand)
Chart on China - Year-over-year growth 2025-2030 (%)
Data Table on China - Year-over-year growth 2025-2030 (%)

12.4.2 India - Market size and forecast 2025-2030

Chart on India - Market size and forecast 2025-2030 ($ thousand)
Data Table on India - Market size and forecast 2025-2030 ($ thousand)
Chart on India - Year-over-year growth 2025-2030 (%)
Data Table on India - Year-over-year growth 2025-2030 (%)

12.4.3 Japan - Market size and forecast 2025-2030

Chart on Japan - Market size and forecast 2025-2030 ($ thousand)
Data Table on Japan - Market size and forecast 2025-2030 ($ thousand)
Chart on Japan - Year-over-year growth 2025-2030 (%)
Data Table on Japan - Year-over-year growth 2025-2030 (%)

12.4.4 South Korea - Market size and forecast 2025-2030

Chart on South Korea - Market size and forecast 2025-2030 ($ thousand)
Data Table on South Korea - Market size and forecast 2025-2030 ($ thousand)
Chart on South Korea - Year-over-year growth 2025-2030 (%)
Data Table on South Korea - Year-over-year growth 2025-2030 (%)

12.4.5 Australia - Market size and forecast 2025-2030

Chart on Australia - Market size and forecast 2025-2030 ($ thousand)
Data Table on Australia - Market size and forecast 2025-2030 ($ thousand)
Chart on Australia - Year-over-year growth 2025-2030 (%)
Data Table on Australia - Year-over-year growth 2025-2030 (%)

12.4.6 Indonesia - Market size and forecast 2025-2030

Chart on Indonesia - Market size and forecast 2025-2030 ($ thousand)
Data Table on Indonesia - Market size and forecast 2025-2030 ($ thousand)
Chart on Indonesia - Year-over-year growth 2025-2030 (%)
Data Table on Indonesia - Year-over-year growth 2025-2030 (%)

12.5 Europe - Market size and forecast 2025-2030

Chart on Europe - Market size and forecast 2025-2030 ($ thousand)
Data Table on Europe - Market size and forecast 2025-2030 ($ thousand)
Chart on Europe - Year-over-year growth 2025-2030 (%)
Data Table on Europe - Year-over-year growth 2025-2030 (%)
Chart on Regional Comparison - Europe
Data Table on Regional Comparison - Europe

12.5.1 Germany - Market size and forecast 2025-2030

Chart on Germany - Market size and forecast 2025-2030 ($ thousand)
Data Table on Germany - Market size and forecast 2025-2030 ($ thousand)
Chart on Germany - Year-over-year growth 2025-2030 (%)
Data Table on Germany - Year-over-year growth 2025-2030 (%)

12.5.2 France - Market size and forecast 2025-2030

Chart on France - Market size and forecast 2025-2030 ($ thousand)
Data Table on France - Market size and forecast 2025-2030 ($ thousand)
Chart on France - Year-over-year growth 2025-2030 (%)
Data Table on France - Year-over-year growth 2025-2030 (%)

12.5.3 UK - Market size and forecast 2025-2030

Chart on UK - Market size and forecast 2025-2030 ($ thousand)
Data Table on UK - Market size and forecast 2025-2030 ($ thousand)
Chart on UK - Year-over-year growth 2025-2030 (%)
Data Table on UK - Year-over-year growth 2025-2030 (%)

12.5.4 Italy - Market size and forecast 2025-2030

Chart on Italy - Market size and forecast 2025-2030 ($ thousand)
Data Table on Italy - Market size and forecast 2025-2030 ($ thousand)
Chart on Italy - Year-over-year growth 2025-2030 (%)
Data Table on Italy - Year-over-year growth 2025-2030 (%)

12.5.5 The Netherlands - Market size and forecast 2025-2030

Chart on The Netherlands - Market size and forecast 2025-2030 ($ thousand)
Data Table on The Netherlands - Market size and forecast 2025-2030 ($ thousand)
Chart on The Netherlands - Year-over-year growth 2025-2030 (%)
Data Table on The Netherlands - Year-over-year growth 2025-2030 (%)

12.5.6 Spain - Market size and forecast 2025-2030

Chart on Spain - Market size and forecast 2025-2030 ($ thousand)
Data Table on Spain - Market size and forecast 2025-2030 ($ thousand)
Chart on Spain - Year-over-year growth 2025-2030 (%)
Data Table on Spain - Year-over-year growth 2025-2030 (%)

12.6 South America - Market size and forecast 2025-2030

Chart on South America - Market size and forecast 2025-2030 ($ thousand)
Data Table on South America - Market size and forecast 2025-2030 ($ thousand)
Chart on South America - Year-over-year growth 2025-2030 (%)
Data Table on South America - Year-over-year growth 2025-2030 (%)
Chart on Regional Comparison - South America
Data Table on Regional Comparison - South America

12.6.1 Brazil - Market size and forecast 2025-2030

Chart on Brazil - Market size and forecast 2025-2030 ($ thousand)
Data Table on Brazil - Market size and forecast 2025-2030 ($ thousand)
Chart on Brazil - Year-over-year growth 2025-2030 (%)
Data Table on Brazil - Year-over-year growth 2025-2030 (%)

12.6.2 Argentina - Market size and forecast 2025-2030

Chart on Argentina - Market size and forecast 2025-2030 ($ thousand)
Data Table on Argentina - Market size and forecast 2025-2030 ($ thousand)
Chart on Argentina - Year-over-year growth 2025-2030 (%)
Data Table on Argentina - Year-over-year growth 2025-2030 (%)

12.6.3 Colombia - Market size and forecast 2025-2030

Chart on Colombia - Market size and forecast 2025-2030 ($ thousand)
Data Table on Colombia - Market size and forecast 2025-2030 ($ thousand)
Chart on Colombia - Year-over-year growth 2025-2030 (%)
Data Table on Colombia - Year-over-year growth 2025-2030 (%)

12.7 Middle East and Africa - Market size and forecast 2025-2030

Chart on Middle East and Africa - Market size and forecast 2025-2030 ($ thousand)
Data Table on Middle East and Africa - Market size and forecast 2025-2030 ($ thousand)
Chart on Middle East and Africa - Year-over-year growth 2025-2030 (%)
Data Table on Middle East and Africa - Year-over-year growth 2025-2030 (%)
Chart on Regional Comparison - Middle East and Africa
Data Table on Regional Comparison - Middle East and Africa

12.7.1 Saudi Arabia - Market size and forecast 2025-2030

Chart on Saudi Arabia - Market size and forecast 2025-2030 ($ thousand)
Data Table on Saudi Arabia - Market size and forecast 2025-2030 ($ thousand)
Chart on Saudi Arabia - Year-over-year growth 2025-2030 (%)
Data Table on Saudi Arabia - Year-over-year growth 2025-2030 (%)

12.7.2 UAE - Market size and forecast 2025-2030

Chart on UAE - Market size and forecast 2025-2030 ($ thousand)
Data Table on UAE - Market size and forecast 2025-2030 ($ thousand)
Chart on UAE - Year-over-year growth 2025-2030 (%)
Data Table on UAE - Year-over-year growth 2025-2030 (%)

12.7.3 South Africa - Market size and forecast 2025-2030

Chart on South Africa - Market size and forecast 2025-2030 ($ thousand)
Data Table on South Africa - Market size and forecast 2025-2030 ($ thousand)
Chart on South Africa - Year-over-year growth 2025-2030 (%)
Data Table on South Africa - Year-over-year growth 2025-2030 (%)

12.7.4 Israel - Market size and forecast 2025-2030

Chart on Israel - Market size and forecast 2025-2030 ($ thousand)
Data Table on Israel - Market size and forecast 2025-2030 ($ thousand)
Chart on Israel - Year-over-year growth 2025-2030 (%)
Data Table on Israel - Year-over-year growth 2025-2030 (%)

12.7.5 Turkey - Market size and forecast 2025-2030

Chart on Turkey - Market size and forecast 2025-2030 ($ thousand)
Data Table on Turkey - Market size and forecast 2025-2030 ($ thousand)
Chart on Turkey - Year-over-year growth 2025-2030 (%)
Data Table on Turkey - Year-over-year growth 2025-2030 (%)

12.8 Market opportunity by geography

Market opportunity by geography ($ thousand)
Data Tables on Market opportunity by geography ($ thousand)

13. Drivers, Challenges, and Opportunity

13.1 Market drivers

Advancements in nuclear fusion research
Growing demand for advanced neutron detection
Increasing investment in space exploration and lunar resource prospecting

13.2 Market challenges

Scarcity and high production costs
Technological and infrastructural limitations for lunar extraction
Competition from alternative technologies and substitutes

13.3 Impact of drivers and challenges

Impact of drivers and challenges in 2025 and 2030

13.4 Market opportunities

Increasing strategic interest in lunar helium 3 extraction
Technological advancements in fusion energy research
Diversification of helium 3 applications beyond traditional uses

14. Competitive Landscape

14.1 Overview

14.2

Overview on criticality of inputs and factors of differentiation

14.3 Landscape disruption

Overview on factors of disruption

14.4 Industry risks

Impact of key risks on business

15. Competitive Analysis

15.1 Companies profiled

Companies covered

15.2 Company ranking index

15.3 Market positioning of companies

Matrix on companies position and classification

15.4 Air Liquide SA

Air Liquide SA - Overview
Air Liquide SA - Product / Service
Air Liquide SA - Key news
Air Liquide SA - Key offerings
SWOT

15.5 Air Products and Chemicals Inc

Air Products and Chemicals Inc - Overview
Air Products and Chemicals Inc - Business segments
Air Products and Chemicals Inc - Key news
Air Products and Chemicals Inc - Key offerings
Air Products and Chemicals Inc - Segment focus
SWOT

15.6 BuyIsotope

BuyIsotope - Overview
BuyIsotope - Product / Service
BuyIsotope - Key offerings
SWOT

15.7 Chemgas Shipping GmbH

Chemgas Shipping GmbH - Overview
Chemgas Shipping GmbH - Product / Service
Chemgas Shipping GmbH - Key offerings
SWOT

15.8 Gulfcryo

Gulfcryo - Overview
Gulfcryo - Product / Service
Gulfcryo - Key offerings
SWOT

15.9 ISOFLEX USA

ISOFLEX USA - Overview
ISOFLEX USA - Product / Service
ISOFLEX USA - Key offerings
SWOT

15.10 Iwatani Corp.

Iwatani Corp. - Overview
Iwatani Corp. - Business segments
Iwatani Corp. - Key offerings
Iwatani Corp. - Segment focus
SWOT

15.11 Laurentis Energy Partners Inc.

Laurentis Energy Partners Inc. - Overview
Laurentis Energy Partners Inc. - Product / Service
Laurentis Energy Partners Inc. - Key offerings
SWOT

15.12 Linde Plc

Linde Plc - Overview
Linde Plc - Business segments
Linde Plc - Key news
Linde Plc - Key offerings
Linde Plc - Segment focus
SWOT

15.13 Lunar Helium3 Mining

Lunar Helium3 Mining - Overview
Lunar Helium3 Mining - Product / Service
Lunar Helium3 Mining - Key offerings
SWOT

15.14 Messer SE and Co. KGaA

Messer SE and Co. KGaA - Overview
Messer SE and Co. KGaA - Product / Service
Messer SE and Co. KGaA - Key offerings
SWOT

15.15 PJSC Gazprom

PJSC Gazprom - Overview
PJSC Gazprom - Product / Service
PJSC Gazprom - Key offerings
SWOT

15.16 Sigma Aldrich Chemicals Ltd.

Sigma Aldrich Chemicals Ltd. - Overview
Sigma Aldrich Chemicals Ltd. - Product / Service
Sigma Aldrich Chemicals Ltd. - Key offerings
SWOT

15.17 State Atomic Energy Corp.

State Atomic Energy Corp. - Overview
State Atomic Energy Corp. - Product / Service
State Atomic Energy Corp. - Key offerings
SWOT

15.18 YIGAS Group

YIGAS Group - Overview
YIGAS Group - Product / Service
YIGAS Group - Key offerings
SWOT

16. Appendix

16.1 Scope of the report

Market definition
Objectives
Notes and caveats

16.2 Inclusions and exclusions checklist

Inclusions checklist
Exclusions checklist

16.3 Currency conversion rates for US$

16.4 Research methodology

16.5 Data procurement

Information sources

16.6 Data validation

16.7 Validation techniques employed for market sizing

16.8 Data synthesis

16.9 360 degree market analysis

16.10 List of abbreviations

Research Methodology

Technavio presents a detailed picture of the market by way of study, synthesis, and summation of data from multiple sources. The analysts have presented the various facets of the market with a particular focus on identifying the key industry influencers. The data thus presented is comprehensive, reliable, and the result of extensive research, both primary and secondary.

INFORMATION SOURCES

Primary sources

  • Manufacturers and suppliers
  • Channel partners
  • Industry experts
  • Strategic decision makers

Secondary sources

  • Industry journals and periodicals
  • Government data
  • Financial reports of key industry players
  • Historical data
  • Press releases

DATA ANALYSIS

Data Synthesis

  • Collation of data
  • Estimation of key figures
  • Analysis of derived insights

Data Validation

  • Triangulation with data models
  • Reference against proprietary databases
  • Corroboration with industry experts

REPORT WRITING

Qualitative

  • Market drivers
  • Market challenges
  • Market trends
  • Five forces analysis

Quantitative

  • Market size and forecast
  • Market segmentation
  • Geographical insights
  • Competitive landscape

Interested in this report?

Get your sample now to see our research methodology and insights!

Download Now

Frequently Asked Questions

Helium 3 market growth will increase by USD 99135.7 thousand thousand during 2026-2030 .

The Helium 3 market is expected to grow at a CAGR of 8.6% during 2026-2030 .

Helium 3 market is segmented by Grade type (Ultra-high purity grade, High purity grade, Low Purity) Application (Defense, Oil and gas, Healthcare, Energy, Others) Form factor (Gas form, Liquid form)

Air Liquide SA, Air Products and Chemicals Inc, BuyIsotope, Chemgas Shipping GmbH, Gulfcryo, ISOFLEX USA, Iwatani Corp., Laurentis Energy Partners Inc., Linde Plc, Lunar Helium3 Mining, Messer SE and Co. KGaA, PJSC Gazprom, Sigma Aldrich Chemicals Ltd., State Atomic Energy Corp., YIGAS Group are a few of the key vendors in the Helium 3 market.

North America will register the highest growth rate of 38.1% among the other regions. Therefore, the Helium 3 market in North America is expected to garner significant business opportunities for the vendors during the forecast period.

US, Canada, Mexico, China, India, Japan, South Korea, Australia, Indonesia, Germany, France, UK, Italy, The Netherlands, Spain, Brazil, Argentina, Colombia, Saudi Arabia, UAE, South Africa, Israel, Turkey

  • Advancements in nuclear fusion research is the driving factor this market.

The Helium 3 market vendors should focus on grabbing business opportunities from the Grade type segment as it accounted for the largest market share in the base year.