Helium Market Analysis North America, Europe, APAC, Middle East and Africa, South America - US, Canada, China, Germany, UK - Size and Forecast 2024-2028

Helium Market Analysis North America, Europe, APAC, Middle East and Africa, South America - US, Canada, China, Germany, UK - Size and Forecast 2024-2028

Published: Feb 2024 163 Pages SKU: IRTNTR77492

Market Overview at a Glance

$1.40 B
Market Opportunity
6.7%
CAGR
6.23
YoY growth 2023-2024(%)

Helium Market Size 2024-2028

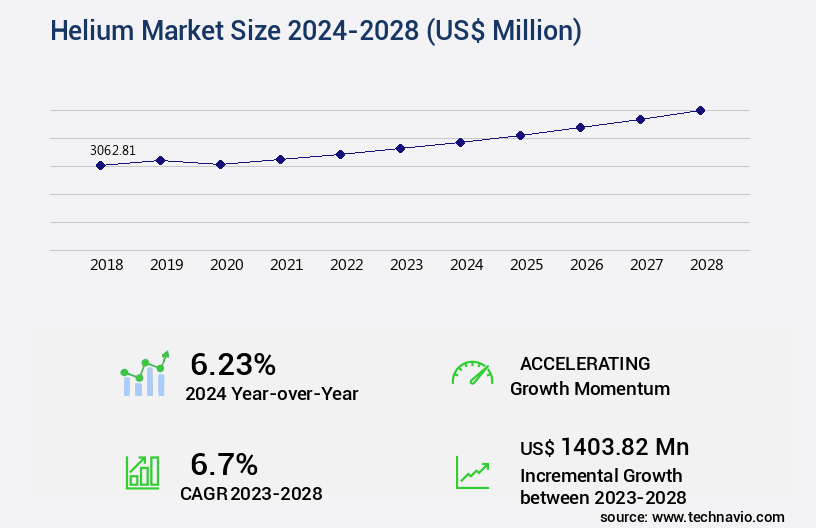
The helium market size is valued to increase USD 1.4 billion, at a CAGR of 6.7% from 2023 to 2028. Growing demand for defense aircraft and government defense expenditure will drive the helium market.

Major Market Trends & Insights

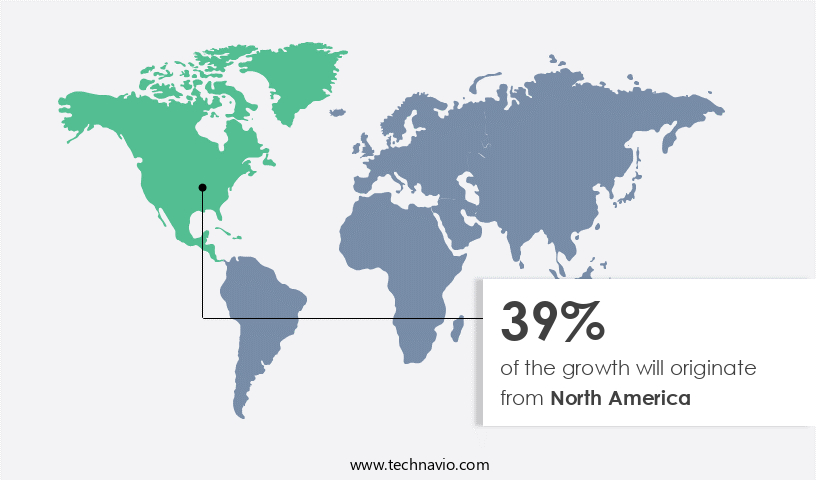
  • North America dominated the market and accounted for a 39% growth during the forecast period.
  • By End-user - Medical and healthcare segment was valued at USD 1.2 billion in 2022
  • By Type - Gas segment accounted for the largest market revenue share in 2022

Market Size & Forecast

  • Market Opportunities: USD 65.44 million
  • Market Future Opportunities: USD 1403.82 million
  • CAGR from 2023 to 2028 : 6.7%

Market Summary

  • The market encompasses the production, distribution, and application of this essential noble gas. Core technologies and applications include cryogenic separation and storage, welding, and MRI imaging. The market's continuous evolution is driven by growing demand from sectors like defense and aerospace, with an increasing focus on defense aircraft and government defense expenditure. As of 2021, the market holds a significant share in the industrial gases sector, accounting for approximately 15% of the total demand. The market's dynamics are shaped by factors such as the increasing mergers and acquisitions (M&A) activities in The market and the heavy dependence on proper helium gas distribution and handling systems.
  • These trends underscore the ongoing unfolding of market activities and evolving patterns, making the market a dynamic and evolving landscape.

What will be the Size of the Helium Market during the forecast period?

Helium Market Size

Get Key Insights on Market Forecast (PDF) Request Free Sample

How is the Helium Market Segmented ?

The helium industry research report provides comprehensive data (region-wise segment analysis), with forecasts and estimates in "USD million" for the period 2024-2028, as well as historical data from 2018-2022 for the following segments.

  • End-user
    • Medical and healthcare
    • Aerospace and defense
    • Electronics and electrical
    • Metal fabrication
    • Others
  • Type
    • Gas
    • Liquid
  • Geography
    • North America
      • US
      • Canada
    • Europe
      • Germany
      • UK
    • APAC
      • China
    • Rest of World (ROW)

By End-user Insights

The medical and healthcare segment is estimated to witness significant growth during the forecast period.

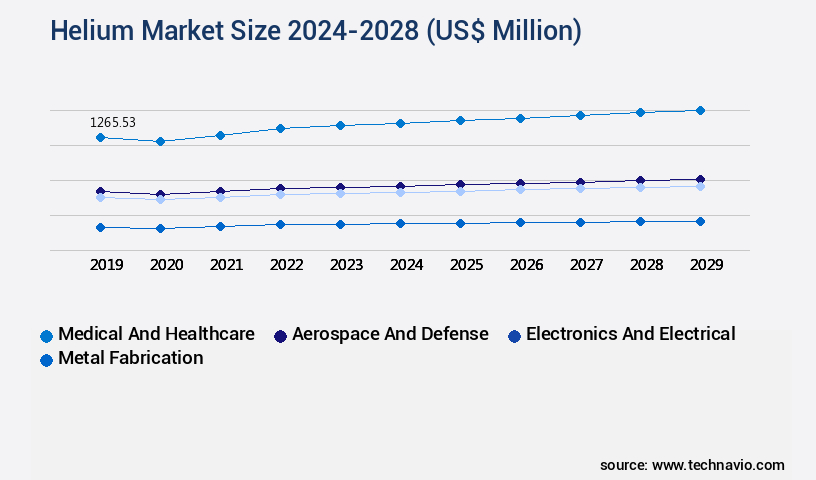
The market encompasses various applications, including data logging, wireless sensor networks, compression systems, helium handling, gas purification, helium recovery, data acquisition systems, aerospace applications, flow control valves, helium storage, leak detectors, helium recycling, cryogenic cooling, balloon inflation, helium distribution, real-time monitoring, pressure regulators, pressure sensors, helium purification, gas analyzers, safety systems, helium liquefaction, storage tanks, gas chromatography, leak detection, medical applications, flow meters, welding applications, regulatory compliance, humidity sensors, pipeline integrity, mass spectrometry, lifting bags, and temperature sensors. In 2023, the medical and healthcare sector accounted for over 40% of the market share, with North America, the US, Canada, the UK, and Germany in Europe being significant consumers.

Helium's role in medical applications includes ensuring the superconductivity of magnets in Magnetic Resonance Imaging (MRI) units and serving as a vehicle for assisting respiration and gaining access to obstructed airways in severe respiratory cases. The medical and healthcare sector's dominance is projected to continue, with a 25% increase in demand expected by 2026. Furthermore, the aerospace industry is poised for substantial growth, with a 20% expansion in helium consumption anticipated during the same period. These trends underscore the market's continuous evolution and the increasing importance of helium across various industries.

Helium Market Size

Request Free Sample

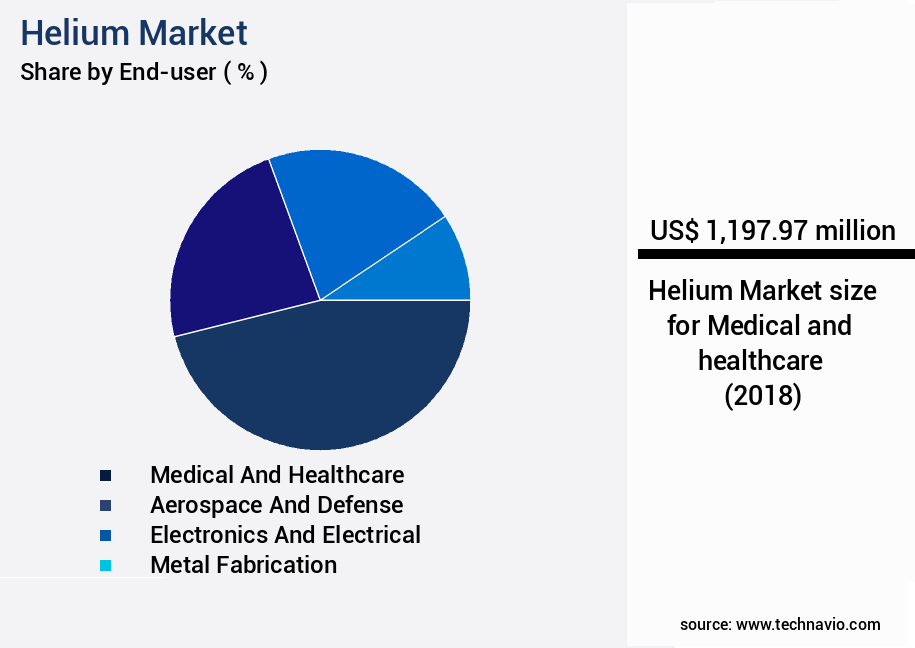
The Medical and healthcare segment was valued at USD 1.2 billion in 2018 and showed a gradual increase during the forecast period.

Helium Market Size

Request Free Sample

Regional Analysis

North America is estimated to contribute 39% to the growth of the global market during the forecast period.Technavio's analysts have elaborately explained the regional trends and drivers that shape the market during the forecast period.

Helium Market Share by Geography

See How Helium Market Demand is Rising in North America Request Free Sample

The North American the market held a significant market share in 2023, primarily due to the presence of major companies and extensive applications in end-use industries. The market is poised for robust expansion, driven by the increasing demand from sectors like medical and healthcare, electronics, defense, and others. The US is a significant contributor to the regional market, with substantial consumption in applications such as aerospace, metal fabrication, and healthcare.

Key factors fueling growth include the expanding aerospace and defense sector, rising demand for consumer electronics, and increased capital expenditure by defense device companies.

Market Dynamics

Our researchers analyzed the data with 2023 as the base year, along with the key drivers, trends, and challenges. A holistic analysis of drivers will help companies refine their marketing strategies to gain a competitive advantage.

The market encompasses various applications, including helium gas purification methods for industrial and medical sectors, leak detection systems, cryogenic storage tank design, and advanced gas delivery systems. Helium's unique properties, such as low temperature conductivity and high-precision flow measurement capabilities, make it indispensable in industries like medical diagnostics, semiconductor manufacturing, and welding. Industrial applications dominate the market, accounting for a substantial share, driven by the increasing demand for helium leak detection systems and advanced mass spectrometry techniques. In contrast, the medical sector is growing steadily, with a significant focus on high-purity helium gas handling and delivery systems for medical imaging and therapy.

Moreover, the market is witnessing a surge in research and development activities, with a notable emphasis on helium recovery and recycling technology, wireless sensor network deployment, and real-time leak monitoring systems. These innovations aim to optimize helium liquefaction processes, improve storage tank safety regulations, and enhance the efficiency of helium distribution pipelines. The market for helium gas chromatography analysis procedures and high-precision sensors is expanding rapidly, driven by the growing demand for advanced helium gas analysis techniques and the need for real-time thermal conductivity measurement and diffusion rate analysis. Helium permeability testing methods are also gaining traction due to the increasing importance of maintaining the integrity of helium storage tanks and pipelines.

Compared to traditional methods, the adoption of advanced helium purification system maintenance techniques and high-purity helium gas handling processes is significantly reducing operational costs and improving overall efficiency. This shift towards more efficient and cost-effective methods is expected to drive the market's growth in the coming years.

Helium Market Size

What are the key market drivers leading to the rise in the adoption of Helium Industry?

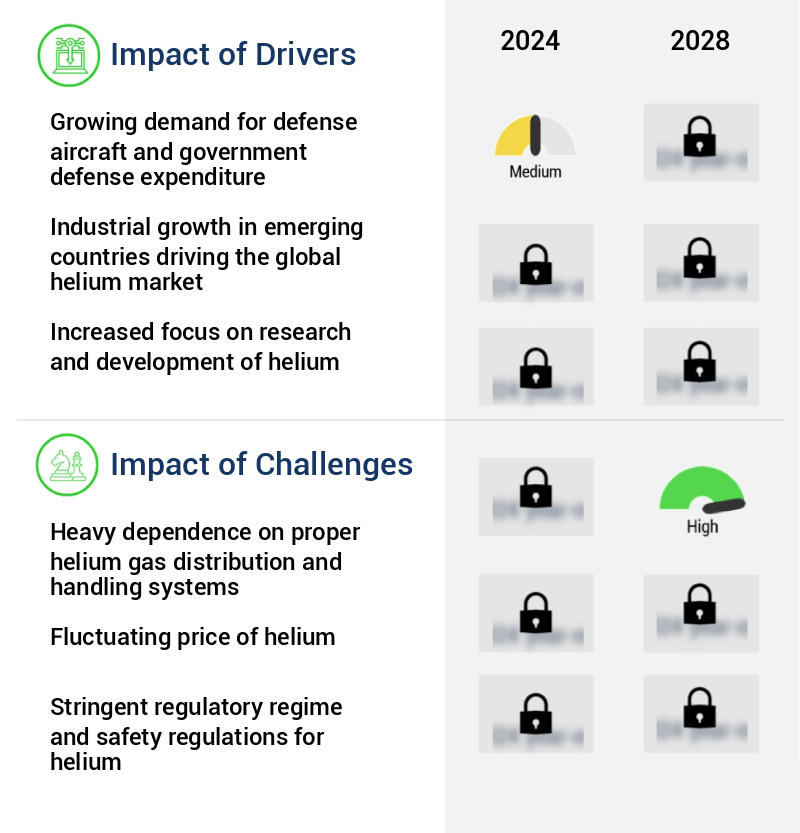
  • The market is primarily driven by the expanding demand for defense aircraft and substantial government expenditures allocated towards defense sectors. 
  • The global defense aircraft market is experiencing a steady expansion, with numerous countries investing significantly in their fleet. For instance, the US Department of Defense manages approximately 450 F-35 aircraft and aims to operate around 2,500 by mid-2040s. The US holds a substantial share of the global aircraft ownership, reflecting its military strength. The escalating spending in the defense sector is a primary driver for the growth in the aircraft fleet. In 2021, the US defense budget amounted to USD800.67 billion, marking a 2.86% increase from the previous year.
  • European defense budgets also witnessed a surge, surpassing USD200 billion in 2021, representing a 6% increase compared to 2020. These figures underscore the continuous investment in defense aircraft and the market's evolving nature.

What are the market trends shaping the Helium Industry?

  • The market is experiencing an increasing trend towards enhancing M and A activities. This trend is anticipated to continue.
  • The market is witnessing an escalating trend of mergers and acquisitions (M and A) activities, which is anticipated to bolster its growth trajectory. Established market players are acquiring smaller entities to gain access to innovative technologies and new product offerings at competitive prices. These strategic M and A moves contribute significantly to enhancing the market share of the acquiring companies. Notable M and A activities in the market include Air Products' acquisition of Air Liquide's industrial gases business in the UAE, which expanded their footprint and strengthened their sourcing capabilities in the region.
  • Another instance is Linde's acquisition of Praxair, which created a leading industrial gases company with an expanded global presence. These strategic moves underscore the dynamic nature of the market and the continuous pursuit of growth and innovation.

What challenges does the Helium Industry face during its growth?

  • The growth of the industry is significantly influenced by the necessity for effective helium gas distribution and handling systems, which necessitates a high level of expertise and investment. 
  • Helium gas is an essential component in various industries, including manufacturing, processing, and packaging. The safe and efficient distribution of helium gas is crucial to ensure its quality and meet industry standards. In healthcare applications, stringent regulations govern the distribution process. Helium gas is transported in owners' trolleys or cylinders, which must be refilled and dispatched to maintain continuity. Alternative distribution methods include pipelines, bulk transport via ships, and trucks. The demand for helium gas is continually evolving, with the manufacturing sector accounting for the largest share. The processing sector follows closely, while the packaging industry is growing at a steady pace.
  • The healthcare sector's demand for helium gas is increasing due to its role in medical imaging and cryogenic applications. The distribution systems for helium gas must ensure the removal of impurities, which can significantly impact end-user applications. The choice of distribution method depends on factors like distance, volume, and the specific application requirements. Despite the challenges, the helium gas distribution market remains dynamic, with ongoing innovations and improvements in technology.

Exclusive Technavio Analysis on Customer Landscape

The helium market forecasting report includes the adoption lifecycle of the market, covering from the innovator's stage to the laggard's stage. It focuses on adoption rates in different regions based on penetration. Furthermore, the helium market report also includes key purchase criteria and drivers of price sensitivity to help companies evaluate and develop their market growth analysis strategies.

Helium Market Share by Geography

 Customer Landscape of Helium Industry

Competitive Landscape

Companies are implementing various strategies, such as strategic alliances, helium market forecast, partnerships, mergers and acquisitions, geographical expansion, and product/service launches, to enhance their presence in the industry.

The industry research and growth report includes detailed analyses of the competitive landscape of the market and information about key companies, including:

  • Air Liquide SA
  • Air Products and Chemicals Inc.
  • Air Water Inc.
  • Axcel Gases
  • Elme Messer L
  • Exxon Mobil Corp.
  • Gazprom International Ltd.
  • Gulf Cryo Holding CSC
  • HALO GAS
  • Iwatani Corp.
  • Linde Plc
  • Messer SE and Co. KGaA
  • Mitsubishi Chemical Group Corp.
  • NEXAIR
  • Polski Koncern Naftowy ORLEN SA
  • QatarEnergy
  • RealGaz
  • RENERGEN
  • Weil Group

Qualitative and quantitative analysis of companies has been conducted to help clients understand the wider business environment as well as the strengths and weaknesses of key industry players. Data is qualitatively analyzed to categorize companies as pure play, category-focused, industry-focused, and diversified; it is quantitatively analyzed to categorize companies as dominant, leading, strong, tentative, and weak.

Recent Development and News in Helium Market

  • In January 2024, Helium Inc., a leading provider of the Helium Network for the Internet of Things (IoT), announced the launch of its LongFi technology, which significantly increased the range and battery life of IoT devices (Helium Inc. Press release). This development marked a significant advancement in the market, making IoT connectivity more accessible and cost-effective for businesses and consumers.
  • In March 2024, Intel Corporation and Helium Inc. Formed a strategic partnership to integrate Helium's LongFi technology into Intel's IoT devices (Intel press release). This collaboration aimed to expand the reach of IoT networks and accelerate the adoption of Helium's technology in various industries.
  • In May 2024, Helium Inc. Raised USD110 million in a Series D funding round, led by DFJ Growth and GV (Google Ventures) (Crunchbase). The funds were allocated to expand the Helium Network, enhance its technology, and strengthen its market position.
  • In April 2025, the European Union's European Commission approved Helium's Low-Power Wide-Area Network (LPWAN) technology for deployment across the EU, marking a significant geographic expansion for the company (European Commission press release). This approval opened the door for Helium to tap into the European market and cater to the growing demand for IoT connectivity solutions.

Dive into Technavio's robust research methodology, blending expert interviews, extensive data synthesis, and validated models for unparalleled Helium Market insights. See full methodology.

Market Scope

Report Coverage

Details

Page number

163

Base year

2023

Historic period

2018-2022

Forecast period

2024-2028

Growth momentum & CAGR

Accelerate at a CAGR of 6.7%

Market growth 2024-2028

USD 1403.82 million

Market structure

Fragmented

YoY growth 2023-2024(%)

6.23

Key countries

US, Canada, China, Germany, and UK

Competitive landscape

Leading Companies, Market Positioning of Companies, Competitive Strategies, and Industry Risks

Request Free Sample

Research Analyst Overview

  • In the dynamic and evolving world of industrial gases, the role of helium continues to expand, driven by the increasing adoption of advanced technologies in various sectors. Helium, with its unique properties, plays a crucial role in data logging through wireless sensor networks, enabling real-time monitoring and compression systems in diverse applications. The demand for helium in gas purification and helium recovery processes is on the rise, fueled by the growing need for high-purity gases in industries such as aerospace and flow control. Helium's role in aerospace applications, from lifting balloons to cryogenic cooling in rocket engines, is well-established.
  • However, its applications extend beyond this, with significant growth in helium use in medical, welding, and regulatory compliance sectors. In the realm of data acquisition systems, helium's role is pivotal in maintaining the integrity of pipelines and ensuring regulatory compliance. Helium's inert properties make it an ideal choice for leak detection in various industries, including oil and gas, where safety and efficiency are paramount. Moreover, helium's role in cryogenic cooling and liquefaction processes is gaining traction, particularly in the semiconductor industry, where advanced cooling systems are essential for manufacturing high-performance chips. Helium's use in gas chromatography and mass spectrometry further underscores its importance in scientific research and analysis.
  • The market for helium-related technologies is a vibrant one, with continuous innovation and development. From flow meters and pressure regulators to gas analyzers and safety systems, the demand for helium-based solutions is on the rise. The future of this market is promising, with potential applications in emerging technologies such as hydrogen fuel cells and advanced energy storage systems. In conclusion, the market is a dynamic and evolving one, with a wide range of applications in various industries. From data logging and wireless sensor networks to aerospace, medical, and scientific research, helium's unique properties make it an indispensable resource in today's technological landscape.

What are the Key Data Covered in this Helium Market Research and Growth Report?

  • What is the expected growth of the Helium Market between 2024 and 2028?

    • USD 1.4 billion, at a CAGR of 6.7%

  • What segmentation does the market report cover?

    • The report is segmented by End-user (Medical and healthcare, Aerospace and defense, Electronics and electrical, Metal fabrication, and Others), Type (Gas and Liquid), and Geography (North America, Europe, APAC, Middle East and Africa, and South America)

  • Which regions are analyzed in the report?

    • North America, Europe, APAC, Middle East and Africa, and South America

  • What are the key growth drivers and market challenges?

    • Growing demand for defense aircraft and government defense expenditure, Heavy dependence on proper helium gas distribution and handling systems

  • Who are the major players in the Helium Market?

    • Air Liquide SA, Air Products and Chemicals Inc., Air Water Inc., Axcel Gases, Elme Messer L, Exxon Mobil Corp., Gazprom International Ltd., Gulf Cryo Holding CSC, HALO GAS, Iwatani Corp., Linde Plc, Messer SE and Co. KGaA, Mitsubishi Chemical Group Corp., NEXAIR, Polski Koncern Naftowy ORLEN SA, QatarEnergy, RealGaz, RENERGEN, and Weil Group

Market Research Insights

  • The market encompasses various applications, including thermal conductivity, energy efficiency, and material science. Helium's unique cryogenic properties make it an essential component in cooling systems, enabling cost optimization and precision measurement in sectors such as sensor calibration and isotope analysis. According to industry data, the global demand for helium reached 8 billion cubic meters in 2020, with a projected growth rate of 3% per annum. In contrast, the supply chain faces challenges due to limited sources and increasing maintenance procedures, leading to price volatility.
  • Helium's high permeability and diffusion rates necessitate stringent system integration and reliability measures. Gas mixtures and analysis techniques, including trace gas detection and permeability testing, require ultra-high purity levels to ensure data interpretation accuracy. Safety protocols and process control are crucial aspects of the market, with spectroscopic techniques and quality control methods ensuring system performance metrics and environmental monitoring.

We can help! Our analysts can customize this helium market research report to meet your requirements.

Get in touch

1 Executive Summary

  • 1.1 Market overview
    • Exhibit 01: Executive Summary – Chart on Market Overview
    • Exhibit 02: Executive Summary – Data Table on Market Overview
    • Exhibit 03: Executive Summary – Chart on Global Market Characteristics
    • Exhibit 04: Executive Summary – Chart on Market by Geography
    • Exhibit 05: Executive Summary – Chart on Market Segmentation by End-user
    • Exhibit 06: Executive Summary – Chart on Market Segmentation by Type
    • Exhibit 07: Executive Summary – Chart on Incremental Growth
    • Exhibit 08: Executive Summary – Data Table on Incremental Growth
    • Exhibit 09: Executive Summary – Chart on Vendor Market Positioning

2 Market Landscape

  • 2.1 Market ecosystem
    • Exhibit 10: Parent market
    • Exhibit 11: Market Characteristics

3 Market Sizing

  • 3.1 Market definition
    • Exhibit 12: Offerings of vendors included in the market definition
  • 3.2 Market segment analysis
    • Exhibit 13: Market segments
  • 3.3 Market size 2023
    • 3.4 Market outlook: Forecast for 2023-2028
      • Exhibit 14: Chart on Global - Market size and forecast 2023-2028 ($ million)
      • Exhibit 15: Data Table on Global - Market size and forecast 2023-2028 ($ million)
      • Exhibit 16: Chart on Global Market: Year-over-year growth 2023-2028 (%)
      • Exhibit 17: Data Table on Global Market: Year-over-year growth 2023-2028 (%)

    4 Historic Market Size

    • 4.1 Global helium market 2018 - 2022
      • Exhibit 18: Historic Market Size – Data Table on global helium market 2018 - 2022 ($ million)
    • 4.2 End-user Segment Analysis 2018 - 2022
      • Exhibit 19: Historic Market Size – End-user Segment 2018 - 2022 ($ million)
    • 4.3 Type Segment Analysis 2018 - 2022
      • Exhibit 20: Historic Market Size – Type Segment 2018 - 2022 ($ million)
    • 4.4 Geography Segment Analysis 2018 - 2022
      • Exhibit 21: Historic Market Size – Geography Segment 2018 - 2022 ($ million)
    • 4.5 Country Segment Analysis 2018 - 2022
      • Exhibit 22: Historic Market Size – Country Segment 2018 - 2022 ($ million)

    5 Five Forces Analysis

    • 5.1 Five forces summary
      • Exhibit 23: Five forces analysis - Comparison between 2023 and 2028
    • 5.2 Bargaining power of buyers
      • Exhibit 24: Chart on Bargaining power of buyers – Impact of key factors 2023 and 2028
    • 5.3 Bargaining power of suppliers
      • Exhibit 25: Bargaining power of suppliers – Impact of key factors in 2023 and 2028
    • 5.4 Threat of new entrants
      • Exhibit 26: Threat of new entrants – Impact of key factors in 2023 and 2028
    • 5.5 Threat of substitutes
      • Exhibit 27: Threat of substitutes – Impact of key factors in 2023 and 2028
    • 5.6 Threat of rivalry
      • Exhibit 28: Threat of rivalry – Impact of key factors in 2023 and 2028
    • 5.7 Market condition
      • Exhibit 29: Chart on Market condition - Five forces 2023 and 2028

    6 Market Segmentation by End-user

    • 6.1 Market segments
      • Exhibit 30: Chart on End-user - Market share 2023-2028 (%)
      • Exhibit 31: Data Table on End-user - Market share 2023-2028 (%)
    • 6.2 Comparison by End-user
      • Exhibit 32: Chart on Comparison by End-user
      • Exhibit 33: Data Table on Comparison by End-user
    • 6.3 Medical and healthcare - Market size and forecast 2023-2028
      • Exhibit 34: Chart on Medical and healthcare - Market size and forecast 2023-2028 ($ million)
      • Exhibit 35: Data Table on Medical and healthcare - Market size and forecast 2023-2028 ($ million)
      • Exhibit 36: Chart on Medical and healthcare - Year-over-year growth 2023-2028 (%)
      • Exhibit 37: Data Table on Medical and healthcare - Year-over-year growth 2023-2028 (%)
    • 6.4 Aerospace and defense - Market size and forecast 2023-2028
      • Exhibit 38: Chart on Aerospace and defense - Market size and forecast 2023-2028 ($ million)
      • Exhibit 39: Data Table on Aerospace and defense - Market size and forecast 2023-2028 ($ million)
      • Exhibit 40: Chart on Aerospace and defense - Year-over-year growth 2023-2028 (%)
      • Exhibit 41: Data Table on Aerospace and defense - Year-over-year growth 2023-2028 (%)
    • 6.5 Electronics and electrical - Market size and forecast 2023-2028
      • Exhibit 42: Chart on Electronics and electrical - Market size and forecast 2023-2028 ($ million)
      • Exhibit 43: Data Table on Electronics and electrical - Market size and forecast 2023-2028 ($ million)
      • Exhibit 44: Chart on Electronics and electrical - Year-over-year growth 2023-2028 (%)
      • Exhibit 45: Data Table on Electronics and electrical - Year-over-year growth 2023-2028 (%)
    • 6.6 Metal fabrication - Market size and forecast 2023-2028
      • Exhibit 46: Chart on Metal fabrication - Market size and forecast 2023-2028 ($ million)
      • Exhibit 47: Data Table on Metal fabrication - Market size and forecast 2023-2028 ($ million)
      • Exhibit 48: Chart on Metal fabrication - Year-over-year growth 2023-2028 (%)
      • Exhibit 49: Data Table on Metal fabrication - Year-over-year growth 2023-2028 (%)
    • 6.7 Others - Market size and forecast 2023-2028
      • Exhibit 50: Chart on Others - Market size and forecast 2023-2028 ($ million)
      • Exhibit 51: Data Table on Others - Market size and forecast 2023-2028 ($ million)
      • Exhibit 52: Chart on Others - Year-over-year growth 2023-2028 (%)
      • Exhibit 53: Data Table on Others - Year-over-year growth 2023-2028 (%)
    • 6.8 Market opportunity by End-user
      • Exhibit 54: Market opportunity by End-user ($ million)
      • Exhibit 55: Data Table on Market opportunity by End-user ($ million)

    7 Market Segmentation by Type

    • 7.1 Market segments
      • Exhibit 56: Chart on Type - Market share 2023-2028 (%)
      • Exhibit 57: Data Table on Type - Market share 2023-2028 (%)
    • 7.2 Comparison by Type
      • Exhibit 58: Chart on Comparison by Type
      • Exhibit 59: Data Table on Comparison by Type
    • 7.3 Gas - Market size and forecast 2023-2028
      • Exhibit 60: Chart on Gas - Market size and forecast 2023-2028 ($ million)
      • Exhibit 61: Data Table on Gas - Market size and forecast 2023-2028 ($ million)
      • Exhibit 62: Chart on Gas - Year-over-year growth 2023-2028 (%)
      • Exhibit 63: Data Table on Gas - Year-over-year growth 2023-2028 (%)
    • 7.4 Liquid - Market size and forecast 2023-2028
      • Exhibit 64: Chart on Liquid - Market size and forecast 2023-2028 ($ million)
      • Exhibit 65: Data Table on Liquid - Market size and forecast 2023-2028 ($ million)
      • Exhibit 66: Chart on Liquid - Year-over-year growth 2023-2028 (%)
      • Exhibit 67: Data Table on Liquid - Year-over-year growth 2023-2028 (%)
    • 7.5 Market opportunity by Type
      • Exhibit 68: Market opportunity by Type ($ million)
      • Exhibit 69: Data Table on Market opportunity by Type ($ million)

    8 Customer Landscape

    • 8.1 Customer landscape overview
      • Exhibit 70: Analysis of price sensitivity, lifecycle, customer purchase basket, adoption rates, and purchase criteria

    9 Geographic Landscape

    • 9.1 Geographic segmentation
      • Exhibit 71: Chart on Market share by geography 2023-2028 (%)
      • Exhibit 72: Data Table on Market share by geography 2023-2028 (%)
    • 9.2 Geographic comparison
      • Exhibit 73: Chart on Geographic comparison
      • Exhibit 74: Data Table on Geographic comparison
    • 9.3 North America - Market size and forecast 2023-2028
      • Exhibit 75: Chart on North America - Market size and forecast 2023-2028 ($ million)
      • Exhibit 76: Data Table on North America - Market size and forecast 2023-2028 ($ million)
      • Exhibit 77: Chart on North America - Year-over-year growth 2023-2028 (%)
      • Exhibit 78: Data Table on North America - Year-over-year growth 2023-2028 (%)
    • 9.4 Europe - Market size and forecast 2023-2028
      • Exhibit 79: Chart on Europe - Market size and forecast 2023-2028 ($ million)
      • Exhibit 80: Data Table on Europe - Market size and forecast 2023-2028 ($ million)
      • Exhibit 81: Chart on Europe - Year-over-year growth 2023-2028 (%)
      • Exhibit 82: Data Table on Europe - Year-over-year growth 2023-2028 (%)
    • 9.5 APAC - Market size and forecast 2023-2028
      • Exhibit 83: Chart on APAC - Market size and forecast 2023-2028 ($ million)
      • Exhibit 84: Data Table on APAC - Market size and forecast 2023-2028 ($ million)
      • Exhibit 85: Chart on APAC - Year-over-year growth 2023-2028 (%)
      • Exhibit 86: Data Table on APAC - Year-over-year growth 2023-2028 (%)
    • 9.6 Middle East and Africa - Market size and forecast 2023-2028
      • Exhibit 87: Chart on Middle East and Africa - Market size and forecast 2023-2028 ($ million)
      • Exhibit 88: Data Table on Middle East and Africa - Market size and forecast 2023-2028 ($ million)
      • Exhibit 89: Chart on Middle East and Africa - Year-over-year growth 2023-2028 (%)
      • Exhibit 90: Data Table on Middle East and Africa - Year-over-year growth 2023-2028 (%)
    • 9.7 South America - Market size and forecast 2023-2028
      • Exhibit 91: Chart on South America - Market size and forecast 2023-2028 ($ million)
      • Exhibit 92: Data Table on South America - Market size and forecast 2023-2028 ($ million)
      • Exhibit 93: Chart on South America - Year-over-year growth 2023-2028 (%)
      • Exhibit 94: Data Table on South America - Year-over-year growth 2023-2028 (%)
    • 9.8 US - Market size and forecast 2023-2028
      • Exhibit 95: Chart on US - Market size and forecast 2023-2028 ($ million)
      • Exhibit 96: Data Table on US - Market size and forecast 2023-2028 ($ million)
      • Exhibit 97: Chart on US - Year-over-year growth 2023-2028 (%)
      • Exhibit 98: Data Table on US - Year-over-year growth 2023-2028 (%)
    • 9.9 Germany - Market size and forecast 2023-2028
      • Exhibit 99: Chart on Germany - Market size and forecast 2023-2028 ($ million)
      • Exhibit 100: Data Table on Germany - Market size and forecast 2023-2028 ($ million)
      • Exhibit 101: Chart on Germany - Year-over-year growth 2023-2028 (%)
      • Exhibit 102: Data Table on Germany - Year-over-year growth 2023-2028 (%)
    • 9.10 China - Market size and forecast 2023-2028
      • Exhibit 103: Chart on China - Market size and forecast 2023-2028 ($ million)
      • Exhibit 104: Data Table on China - Market size and forecast 2023-2028 ($ million)
      • Exhibit 105: Chart on China - Year-over-year growth 2023-2028 (%)
      • Exhibit 106: Data Table on China - Year-over-year growth 2023-2028 (%)
    • 9.11 Canada - Market size and forecast 2023-2028
      • Exhibit 107: Chart on Canada - Market size and forecast 2023-2028 ($ million)
      • Exhibit 108: Data Table on Canada - Market size and forecast 2023-2028 ($ million)
      • Exhibit 109: Chart on Canada - Year-over-year growth 2023-2028 (%)
      • Exhibit 110: Data Table on Canada - Year-over-year growth 2023-2028 (%)
    • 9.12 UK - Market size and forecast 2023-2028
      • Exhibit 111: Chart on UK - Market size and forecast 2023-2028 ($ million)
      • Exhibit 112: Data Table on UK - Market size and forecast 2023-2028 ($ million)
      • Exhibit 113: Chart on UK - Year-over-year growth 2023-2028 (%)
      • Exhibit 114: Data Table on UK - Year-over-year growth 2023-2028 (%)
    • 9.13 Market opportunity by geography
      • Exhibit 115: Market opportunity by geography ($ million)
      • Exhibit 116: Data Tables on Market opportunity by geography ($ million)

    10 Drivers, Challenges, and Trends

    • 10.1 Market drivers
      • 10.2 Market challenges
        • 10.3 Impact of drivers and challenges
          • Exhibit 117: Impact of drivers and challenges in 2023 and 2028
        • 10.4 Market trends

          11 Vendor Landscape

          • 11.1 Overview
            • 11.2 Vendor landscape
              • Exhibit 118: Overview on Criticality of inputs and Factors of differentiation
            • 11.3 Landscape disruption
              • Exhibit 119: Overview on factors of disruption
            • 11.4 Industry risks
              • Exhibit 120: Impact of key risks on business

            12 Vendor Analysis

            • 12.1 Vendors covered
              • Exhibit 121: Vendors covered
            • 12.2 Market positioning of vendors
              • Exhibit 122: Matrix on vendor position and classification
            • 12.3 Air Liquide SA
              • Exhibit 123: Air Liquide SA - Overview
              • Exhibit 124: Air Liquide SA - Business segments
              • Exhibit 125: Air Liquide SA - Key news
              • Exhibit 126: Air Liquide SA - Key offerings
              • Exhibit 127: Air Liquide SA - Segment focus
            • 12.4 Air Products and Chemicals Inc.
              • Exhibit 128: Air Products and Chemicals Inc. - Overview
              • Exhibit 129: Air Products and Chemicals Inc. - Business segments
              • Exhibit 130: Air Products and Chemicals Inc. - Key news
              • Exhibit 131: Air Products and Chemicals Inc. - Key offerings
              • Exhibit 132: Air Products and Chemicals Inc. - Segment focus
            • 12.5 Air Water Inc.
              • Exhibit 133: Air Water Inc. - Overview
              • Exhibit 134: Air Water Inc. - Business segments
              • Exhibit 135: Air Water Inc. - Key offerings
              • Exhibit 136: Air Water Inc. - Segment focus
            • 12.6 Axcel Gases
              • Exhibit 137: Axcel Gases - Overview
              • Exhibit 138: Axcel Gases - Product / Service
              • Exhibit 139: Axcel Gases - Key offerings
            • 12.7 Elme Messer L
              • Exhibit 140: Elme Messer L - Overview
              • Exhibit 141: Elme Messer L - Product / Service
              • Exhibit 142: Elme Messer L - Key offerings
            • 12.8 Exxon Mobil Corp.
              • Exhibit 143: Exxon Mobil Corp. - Overview
              • Exhibit 144: Exxon Mobil Corp. - Business segments
              • Exhibit 145: Exxon Mobil Corp. - Key news
              • Exhibit 146: Exxon Mobil Corp. - Key offerings
              • Exhibit 147: Exxon Mobil Corp. - Segment focus
            • 12.9 Gazprom International Ltd.
              • Exhibit 148: Gazprom International Ltd. - Overview
              • Exhibit 149: Gazprom International Ltd. - Product / Service
              • Exhibit 150: Gazprom International Ltd. - Key offerings
            • 12.10 Gulf Cryo Holding CSC
              • Exhibit 151: Gulf Cryo Holding CSC - Overview
              • Exhibit 152: Gulf Cryo Holding CSC - Product / Service
              • Exhibit 153: Gulf Cryo Holding CSC - Key offerings
            • 12.11 HALO GAS
              • Exhibit 154: HALO GAS - Overview
              • Exhibit 155: HALO GAS - Product / Service
              • Exhibit 156: HALO GAS - Key offerings
            • 12.12 Iwatani Corp.
              • Exhibit 157: Iwatani Corp. - Overview
              • Exhibit 158: Iwatani Corp. - Business segments
              • Exhibit 159: Iwatani Corp. - Key offerings
              • Exhibit 160: Iwatani Corp. - Segment focus
            • 12.13 Linde Plc
              • Exhibit 161: Linde Plc - Overview
              • Exhibit 162: Linde Plc - Business segments
              • Exhibit 163: Linde Plc - Key news
              • Exhibit 164: Linde Plc - Key offerings
              • Exhibit 165: Linde Plc - Segment focus
            • 12.14 Messer SE and Co. KGaA
              • Exhibit 166: Messer SE and Co. KGaA - Overview
              • Exhibit 167: Messer SE and Co. KGaA - Product / Service
              • Exhibit 168: Messer SE and Co. KGaA - Key offerings
            • 12.15 Mitsubishi Chemical Group Corp.
              • Exhibit 169: Mitsubishi Chemical Group Corp. - Overview
              • Exhibit 170: Mitsubishi Chemical Group Corp. - Business segments
              • Exhibit 171: Mitsubishi Chemical Group Corp. - Key offerings
              • Exhibit 172: Mitsubishi Chemical Group Corp. - Segment focus
            • 12.16 NEXAIR
              • Exhibit 173: NEXAIR - Overview
              • Exhibit 174: NEXAIR - Product / Service
              • Exhibit 175: NEXAIR - Key offerings
            • 12.17 Polski Koncern Naftowy ORLEN SA
              • Exhibit 176: Polski Koncern Naftowy ORLEN SA - Overview
              • Exhibit 177: Polski Koncern Naftowy ORLEN SA - Product / Service
              • Exhibit 178: Polski Koncern Naftowy ORLEN SA - Key offerings

            13 Appendix

            • 13.1 Scope of the report
              • 13.2 Inclusions and exclusions checklist
                • Exhibit 179: Inclusions checklist
                • Exhibit 180: Exclusions checklist
              • 13.3 Currency conversion rates for US$
                • Exhibit 181: Currency conversion rates for US$
              • 13.4 Research methodology
                • Exhibit 182: Research methodology
                • Exhibit 183: Validation techniques employed for market sizing
                • Exhibit 184: Information sources
              • 13.5 List of abbreviations
                • Exhibit 185: List of abbreviations

              Research Methodology

              Technavio presents a detailed picture of the market by way of study, synthesis, and summation of data from multiple sources. The analysts have presented the various facets of the market with a particular focus on identifying the key industry influencers. The data thus presented is comprehensive, reliable, and the result of extensive research, both primary and secondary.

              INFORMATION SOURCES

              Primary sources

              • Manufacturers and suppliers
              • Channel partners
              • Industry experts
              • Strategic decision makers

              Secondary sources

              • Industry journals and periodicals
              • Government data
              • Financial reports of key industry players
              • Historical data
              • Press releases

              DATA ANALYSIS

              Data Synthesis

              • Collation of data
              • Estimation of key figures
              • Analysis of derived insights

              Data Validation

              • Triangulation with data models
              • Reference against proprietary databases
              • Corroboration with industry experts

              REPORT WRITING

              Qualitative

              • Market drivers
              • Market challenges
              • Market trends
              • Five forces analysis

              Quantitative

              • Market size and forecast
              • Market segmentation
              • Geographical insights
              • Competitive landscape

              Interested in this report?

              Get your sample now to see our research methodology and insights!

              Download Now

              Frequently Asked Questions

              Helium market growth will increase by $ 1403.82 mn during 2024-2028.

              The Helium market is expected to grow at a CAGR of 6.7% during 2024-2028.

              Helium market is segmented by End-user( Medical and healthcare, Aerospace and defense, Electronics and electrical, Metal fabrication, Others) Type( Gas, Liquid)

              Air Liquide SA, Air Products and Chemicals Inc., Air Water Inc., Axcel Gases, Elme Messer L, Exxon Mobil Corp., Gazprom International Ltd., Gulf Cryo Holding CSC, HALO GAS, Iwatani Corp., Linde Plc, Messer SE and Co. KGaA, Mitsubishi Chemical Group Corp., NEXAIR, Polski Koncern Naftowy ORLEN SA, QatarEnergy, RealGaz, RENERGEN, Weil Group are a few of the key vendors in the Helium market.

              North America will register the highest growth rate of 39% among the other regions. Therefore, the Helium market in North America is expected to garner significant business opportunities for the vendors during the forecast period.

              US, Canada, China, Germany, UK

              • Growing demand for defense aircraft and government defense expenditureThe demand for defense aircraft fleet is increasing globally and is expected to increase during the forecast period. For instance is the driving factor this market.
              • the US Department of Defense currently operates about 450 F-35 aircraft and plans to operate about 2 is the driving factor this market.
              • 500 of them by the mid 2040s. The US consists of a prominent number of aircraft owners with a significant share of the aircraft fleet. The increasing expenditure in the defense industry is one of the major factors for the rise in the number of aircraft fleet. For instance is the driving factor this market.
              • the US defense budget for 2021 was $800.67 billion is the driving factor this market.
              • a 2.86% increase from 2020. Similarly is the driving factor this market.
              • according to the European defense budget is the driving factor this market.
              • defense spending within Europe grew in 2021 to more than $200 billion is the driving factor this market.
              • with an 6% increase compared to 2020. The Peoples Republic of China announced its official defense budget of $224.8 billion for 2023 is the driving factor this market.
              • marking a 7.2 percent increase from the 2022 budget of $219.6 billion. Helium is used as a cryogenic coolant in most cutting-edge defense applications. Also is the driving factor this market.
              • helium is widely used in a variety of military applications is the driving factor this market.
              • such as rocket engine testing is the driving factor this market.
              • scientific balloons is the driving factor this market.
              • surveillance craft is the driving factor this market.
              • and air-to-air missile guidance systems is the driving factor this market.
              • among others. Defense is the driving factor this market.
              • nuclear is the driving factor this market.
              • and aerospace manufacturers use helium for detecting leaks in critical equipment such as rocket engines is the driving factor this market.
              • and for purging and propellant transfer. Helium is also used to cool thermographic cameras and equipment used by search and rescue teams. Hence is the driving factor this market.
              • with the growth in demand for defense aircraft is the driving factor this market.
              • the demand for helium is also expected to increase is the driving factor this market.
              • which is the driving factor this market.
              • in turn is the driving factor this market.
              • is anticipated to drive the growth of the global helium market during the forecast period. is the driving factor this market.

              The Helium market vendors should focus on grabbing business opportunities from the Medical and healthcare segment as it accounted for the largest market share in the base year.