Hematology Analyzers and Reagents Market Analysis, Size, and Forecast 2024-2028: North America (US and Canada), Europe (France, Germany, Italy, and UK), Middle East and Africa (Egypt, KSA, Oman, and UAE), APAC (China, India, and Japan), South America (Argentina and Brazil), and Rest of World (ROW)

Hematology Analyzers and Reagents Market Analysis, Size, and Forecast 2024-2028:
North America (US and Canada), Europe (France, Germany, Italy, and UK), Middle East and Africa (Egypt, KSA, Oman, and UAE), APAC (China, India, and Japan), South America (Argentina and Brazil), and Rest of World (ROW)

Published: Nov 2023 161 Pages SKU: IRTNTR76795

Market Overview at a Glance

$3.91 B
Market Opportunity
6.95%
CAGR
6.54
YoY growth 2023-2024(%)

Hematology Analyzers and Reagents Market Size 2024-2028

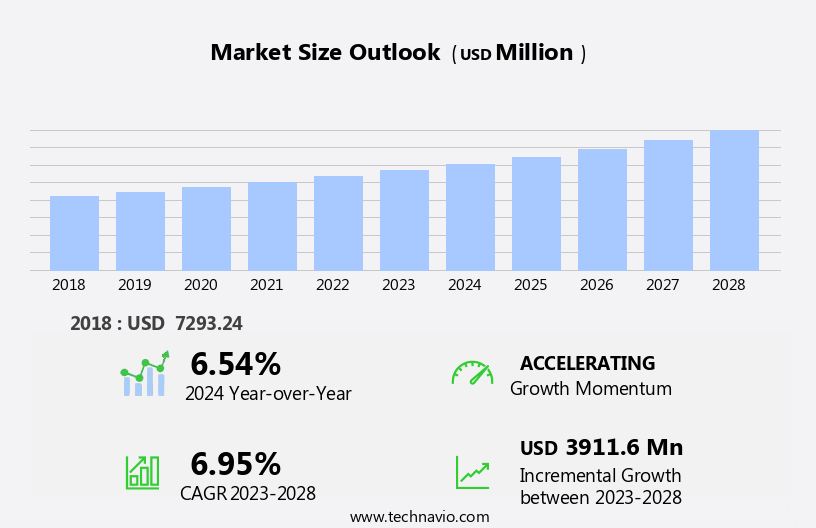
The hematology analyzers and reagents market size is forecast to increase by USD 3.91 billion, at a CAGR of 6.95% between 2023 and 2028.

  • The market is witnessing significant growth, driven by the increasing adoption of advanced hematology analyzer solutions in smaller and mid-sized laboratories. Automation in healthcare is a major trend, leading to the widespread use of hematology analyzers for accurate and efficient diagnosis. However, limited access to these technologies in rural areas presents a challenge. In the immunohematology market, the demand for cell surface markers is increasing due to their role in identifying blood types and detecting diseases such as leukemia and lymphoma. However, limited access to these solutions in rural areas poses a challenge for market expansion.
  • Despite this obstacle, companies can capitalize on opportunities by focusing on developing cost-effective, portable, and easy-to-use hematology analyzers and reagents, catering to the needs of rural healthcare facilities and remote laboratories. By addressing this challenge, market players can broaden their customer base and strengthen their market position.

What will be the Size of the Hematology Analyzers and Reagents Market during the forecast period?

Hematology Analyzers and Reagents Market Size

Explore in-depth regional segment analysis with market size data - historical 2018-2022 and forecasts 2024-2028 - in the full report.  
Request Free Sample

The market is characterized by its continuous evolution, driven by advancements in technology and regulatory requirements. CBC analyzers, for instance, are increasingly being integrated with automated systems, ensuring faster turnaround times and improved accuracy. IVD regulations, such as CLIA and CE marking, continue to shape the market, prioritizing regulatory compliance and quality assurance. Sample preparation and calibration fluids play a crucial role in maintaining the performance of these analyzers. Reagent management and inventory control are essential for ensuring a consistent supply of diagnostic reagents, while technical support and calibration services are vital for maintaining the accuracy and reliability of the systems.

Manual hematology systems and point-of-care testing are gaining popularity due to their ease of use and portability. Coagulation analyzers and immunohematology analyzers are also seeing significant growth, expanding the applications of hematology analyzers across various sectors. Platelet analyzers and differential analyzers are essential for diagnosing and monitoring blood disorders. Blood collection tubes and control materials are crucial components of the hematology analyzer system, ensuring accurate and reliable results. The market for hematology analyzers and reagents is dynamic, with ongoing developments in technology and regulatory requirements shaping its trajectory. The focus on improving turnaround time, ensuring regulatory compliance, and providing technical support and calibration services is driving innovation and growth in the market.

How is this Hematology Analyzers and Reagents Industry segmented?

The hematology analyzers and reagents industry research report provides comprehensive data (region-wise segment analysis), with forecasts and estimates in "USD million" for the period 2024-2028, as well as historical data from 2018-2022 for the following segments.

  • Product
    • Reagents and consumables
    • Instruments
  • End-user
    • Hospitals
    • Clinical laboratories
    • Research institute
    • Others
  • Analyzer Type
    • 3-Part Differential Analyzers
    • 5-Part Differential Analyzers
    • 6-Part Differential Analyzers
  • Application
    • Anemia
    • Blood Cancer
    • Hemorrhagic Conditions
    • Infectious Diseases
    • Immune System Disorders
  • Geography
    • North America
      • US
      • Canada
    • Europe
      • France
      • Germany
      • Italy
      • UK
    • Middle East and Africa
      • Egypt
      • KSA
      • Oman
      • UAE
    • APAC
      • China
      • India
      • Japan
    • South America
      • Argentina
      • Brazil
    • Rest of World (ROW)

    By Product Insights

    The reagents and consumables segment is estimated to witness significant growth during the forecast period.

    The market encompasses various product segments, each playing a crucial role in ensuring accurate and efficient blood analysis. Reagents, specifically, are integral to the hematology system as they facilitate chemical reactions for identifying and measuring blood components. Hematology reagents, which include calibration fluids, control materials, and diagnostic reagents, are dedicated substances used in automated cell counters. Sample preparation is a critical process in hematology analysis, and the use of specialized reagents facilitates optimal sample handling. Compliance with regulations such as CLIA and IVD is essential, and reagents must undergo rigorous testing to meet quality assurance standards. Automated hematology systems, which include CBC analyzers, platelet analyzers, coagulation analyzers, and immunohematology analyzers, require regular maintenance and calibration services.

    Reagent management systems ensure inventory control and timely replacement of consumables. Point-of-care testing has gained popularity due to its ease of use and quick turnaround time, necessitating the availability of diagnostic reagents and calibration services. Ease of use and CE marking are essential considerations for both manual and automated systems. Sample storage and transportation require specialized reagents and materials, such as blood collection tubes and control materials, to maintain sample integrity and prevent contamination. Regulatory compliance and quality control are paramount in the production and use of these reagents. Assay kits and inventory management systems facilitate efficient reagent utilization and reduce waste.

    Technical support and calibration services ensure the continued performance of hematology analyzers and maintain the accuracy of results.

    Hematology Analyzers and Reagents Market Size

    Request Free Sample

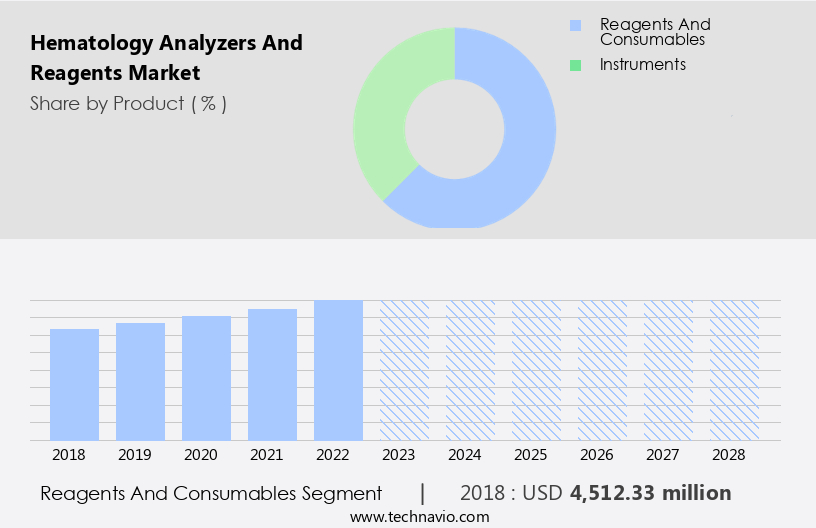
    The Reagents and consumables segment was valued at USD 4.51 billion in 2018 and showed a gradual increase during the forecast period.

    Regional Analysis

    North America is estimated to contribute 37% to the growth of the global market during the forecast period.Technavio's analysts have elaborately explained the regional trends and drivers that shape the market during the forecast period.

    Hematology Analyzers and Reagents Market Share by Geography

     Request Free Sample

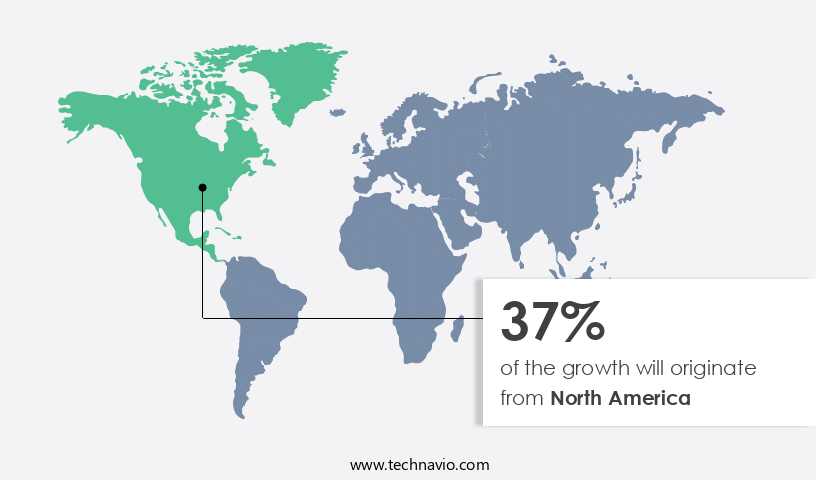
    The North American the market is experiencing steady growth due to substantial investments in healthcare research and testing in the US. In 2020, the Centers for Medicare and Medicaid Services (CMS) reported a 2.7% increase in US national health expenditure spending, reaching USD4.3 trillion, or USD12,914 per person, contributing 18.3% to the country's gross domestic product. The well-established distribution network in countries like the US and Canada, along with manufacturers' focus on offering comprehensive hematology solutions, such as automated analyzers, to hospitals and diagnostic centers, is driving market expansion. Data management software plays a crucial role in ensuring regulatory compliance, including CLIA regulations, in the hematology analyzers market.

    Reagent management, calibration fluids, and control materials are essential components of these systems, ensuring accurate and reliable results. Hematology analyzers, including CBC analyzers, platelet analyzers, hemoglobin analyzers, and coagulation analyzers, are integral to diagnosing various blood disorders. Automated hematology systems, with their ease of use and quick turnaround times, are increasingly popular. Point-of-care testing and manual hematology systems also have their place in the market, catering to specific needs. IVD regulations and quality assurance are critical factors influencing market trends. Inventory management and technical support are essential services provided by manufacturers to ensure seamless operations. Calibration services and assay kits are essential for maintaining the accuracy and reliability of hematology analyzers.

    CE marking and quality control are crucial for regulatory compliance and ensuring the highest standards in the industry. Blood collection tubes and sample storage are vital components of the overall hematology solutions portfolio. The market is evolving, with a focus on providing integrated solutions that cater to various needs, from manual systems to automated, and from routine testing to specialized applications. Manufacturers are continually innovating to meet the demands of healthcare providers and diagnostic centers, ensuring the market remains dynamic and responsive to the needs of the industry.

    Market Dynamics

    The global hematology analyzers and reagents market is undergoing substantial growth, driven by the increasing need for accurate blood disorder diagnosis, including prevalent conditions like anemia diagnosis and severe illnesses such as blood cancer diagnosis. The expanding hematology analyzers and reagents market size and dynamic hematology analyzers and reagents market trends are fueled by strong hematology analyzers and reagents market growth drivers. Hematology analyzers, especially point-of-care (POC) hematology analyzers, are crucial for performing a complete blood count (CBC). The effectiveness of these devices relies heavily on specialized hematology reagents. Innovations like automated hematology analysis leveraging AI in hematology analysis and machine learning (ML) in hematology are transforming diagnostics. Furthermore, advancements in flow cytometry technology are vital. These tools are indispensable for infectious disease diagnosis, monitoring chronic conditions, and ensuring safe practices in blood bank testing, serving both clinical laboratories and hospitals (end-users).

    Our researchers analyzed the data with 2023 as the base year, along with the key drivers, trends, and challenges. A holistic analysis of drivers will help companies refine their marketing strategies to gain a competitive advantage.

    What are the key market drivers leading to the rise in the adoption of Hematology Analyzers and Reagents Industry?

    • The adoption of hematology analyzer solutions is crucial for expanding the market reach, particularly among smaller and mid-sized laboratories. These advanced tools enable efficient and accurate diagnosis and management of blood disorders, making them an indispensable asset for medical facilities of all sizes. 
    • In the realm of diagnostic laboratory testing, hematology analyzers play a pivotal role in delivering precise results for various blood parameters. Automated hematology analyzers, in particular, have gained significant traction due to their efficiency and accuracy. These systems streamline sample preparation, data management, and analysis processes, ensuring timely and reliable results. Hemoglobin analyzers and differential analyzers, key components of hematology systems, facilitate the measurement of hemoglobin concentration and differential count of various blood cells, respectively. Calibration fluids and reagent management systems are essential for maintaining the accuracy and consistency of these analyzers. Adherence to Clinical Laboratory Improvement Amendments (CLIA) regulations is crucial for laboratories to ensure the validity and reliability of their test results.
    • Automated hematology analyzers, with their data management software, help laboratories maintain compliance with these regulations. Flow cytometry, another advanced technology, offers multidimensional analysis of blood cells, providing comprehensive diagnostic information. Automated systems in flow cytometry enable efficient data acquisition and analysis, enhancing the diagnostic capabilities of laboratories. In summary, automated hematology solutions, including analyzers, data management software, calibration fluids, and reagent management systems, contribute significantly to the efficiency, accuracy, and productivity of clinical laboratories. They provide valuable data-driven insights, reduce human error, and enable compliance with regulatory requirements.

    What are the market trends shaping the Hematology Analyzers and Reagents Industry?

    • The healthcare sector is witnessing an escalating trend towards the implementation of automated systems. This technological advancement is increasingly becoming a necessity rather than an option.
    • Small and mid-sized laboratories have traditionally relied on manual methods for hematology analysis due to the high cost and complexity of automated solutions. However, market companies have recognized this need and have introduced cost-effective, automated hematology analyzers and reagents specifically designed for these laboratories. For instance, Beckman Coulter Inc., a leading player in the market, launched the DxH 560 AL in 2021. This autoload hematology analyzer is tailored to small and mid-sized laboratories, reducing their time and resource constraints. The market trend towards automated solutions is gaining traction, as these laboratories seek to enhance efficiency and maintain regulatory compliance.
    • Sample storage and control materials are crucial components of hematology analysis, and companies are focusing on providing high-quality solutions to meet the demands of this market segment. The availability of these specialized products has led to increased adoption of hematology analyzers among small and mid-sized laboratories. In summary, the market for hematology analyzers and reagents is witnessing growth due to the increasing demand for automated solutions from small and mid-sized laboratories. companies are responding to this trend by introducing cost-effective, specialized products, such as platelet analyzers and immunohematology analyzers, to meet the unique needs of this market segment.
    • Additionally, regulatory compliance and the availability of high-quality sample storage and control materials are essential factors driving market growth.

    What challenges does the Hematology Analyzers and Reagents Industry face during its growth?

    • Rural areas present a significant challenge to the industry's growth due to limited accessibility. 
    • The market faces a significant challenge due to inadequate access to healthcare services in rural regions. These areas typically lack medical facilities and qualified personnel, leading to a scarcity of hematology analyzers and testing reagents. Consequently, the diagnosis and management of blood diseases in these areas are hindered. Healthcare infrastructure and resources are often unevenly distributed, making it challenging for patients in rural areas to access hematological testing and treatments in a timely manner. The absence of readily available equipment and reagents for hematological testing can result in delayed diagnoses and treatments, potentially compromising patient outcomes.
    • To address this issue, it is crucial to prioritize investments in healthcare infrastructure and resources in rural areas, ensuring the availability and affordability of hematology analyzers and reagents. Quality assurance, turnaround time, technical support, and the use of manual hematology systems, assay kits, and coagulation analyzers can help improve the accessibility and accuracy of hematological testing in rural regions.

    Exclusive Customer Landscape

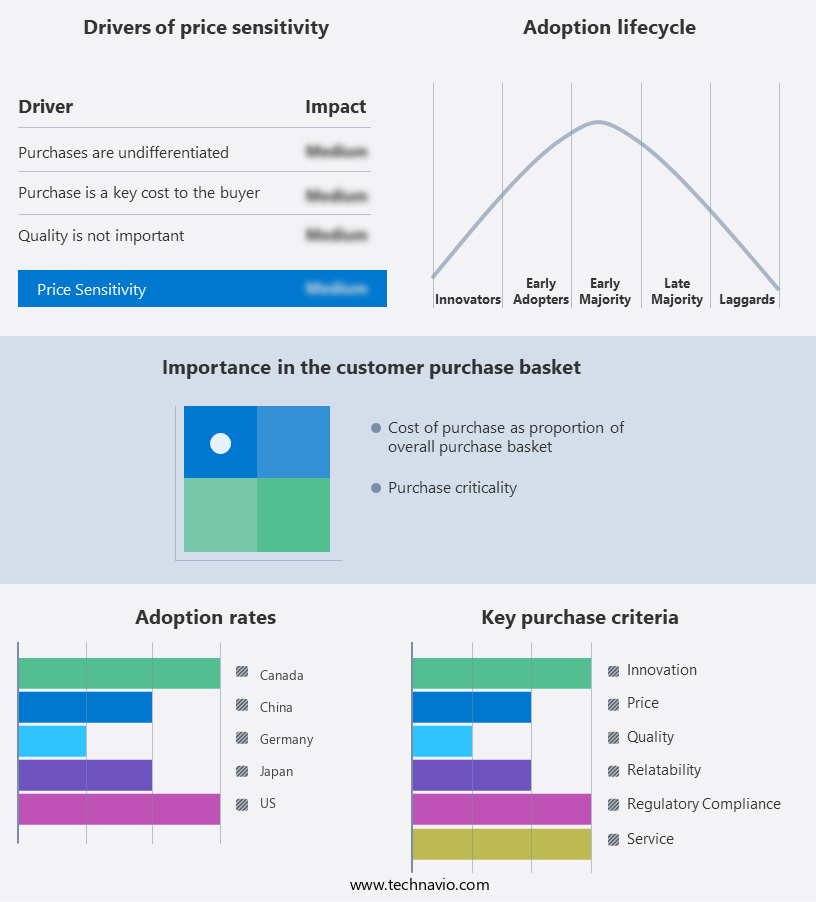
    The hematology analyzers and reagents market forecasting report includes the adoption lifecycle of the market, covering from the innovator's stage to the laggard's stage. It focuses on adoption rates in different regions based on penetration. Furthermore, the hematology analyzers and reagents market report also includes key purchase criteria and drivers of price sensitivity to help companies evaluate and develop their market growth analysis strategies.

    Hematology Analyzers and Reagents Market Share by Geography

     Customer Landscape

    Key Companies & Market Insights

    Companies are implementing various strategies, such as strategic alliances, hematology analyzers and reagents market forecast, partnerships, mergers and acquisitions, geographical expansion, and product/service launches, to enhance their presence in the industry.

    Abbott Laboratories - This company specializes in providing advanced hematology solutions, including analyzers like the CELL DYN Sapphire and CELL DYN Ruby, and accompanying reagents. Their offerings facilitate accurate and efficient blood cell analysis for various diagnostic applications.

    The industry research and growth report includes detailed analyses of the competitive landscape of the market and information about key companies, including:

    • Abbott Laboratories
    • Bio Rad Laboratories Inc.
    • BioSystems SA
    • Boule Diagnostics AB
    • Danaher Corp.
    • EKF Diagnostics Holdings Plc
    • Erba Diagnostics FZ LLC
    • F. Hoffmann La Roche Ltd.
    • Heska Corp.
    • HORIBA Ltd.
    • Mindray Bio medical Electronics Co. Ltd.
    • NeoMedica
    • Nihon Kohden Corp.
    • Siemens AG
    • STRATEC SE
    • Sysmex Corp.
    • Thermo Fisher Scientific Inc.
    • Toyobo Co. Ltd.
    • URIT Medical Electronic Co. Ltd.
    • Zoetis Inc.

    Qualitative and quantitative analysis of companies has been conducted to help clients understand the wider business environment as well as the strengths and weaknesses of key industry players. Data is qualitatively analyzed to categorize companies as pure play, category-focused, industry-focused, and diversified; it is quantitatively analyzed to categorize companies as dominant, leading, strong, tentative, and weak.

    Recent Development and News in Hematology Analyzers And Reagents Market

    • In January 2024, Sysmex Corporation, a leading global supplier of in vitro diagnostic systems and reagents, announced the launch of its new XN-9100 STAT hematology analyzer. This advanced system, featuring improved accuracy and efficiency, was designed to meet the growing demand for rapid and precise hematology analysis (Sysmex Corporation Press Release, 2024).
    • In March 2024, Roche Diagnostics and Illumina, Inc. Entered into a strategic partnership to integrate Illumina's next-generation sequencing (NGS) technology into Roche's hematology offerings. This collaboration aimed to enhance the diagnostic capabilities of hematology analyzers by incorporating genomic information (Roche Diagnostics Press Release, 2024).
    • In May 2024, Beckman Coulter, a Danaher company, completed the acquisition of Horiba Medical, a global leader in clinical chemistry and immunoassay systems. This acquisition expanded Beckman Coulter's portfolio in the diagnostics market, particularly in the hematology segment (Beckman Coulter Press Release, 2024).
    • In February 2025, the US Food and Drug Administration (FDA) granted 510(k) clearance to Abbott's new flagship hematology analyzer, the Architect i-2000SR. This clearance marked the entry of Abbott's latest system into the US market, further strengthening its position in The market (Abbott Laboratories Press Release, 2025).

    Research Analyst Overview

    • The market encompasses various technologies and applications, including Prothrombin Time (PT) testing, thrombocytopenia screening, cell morphology analysis, and hemostasis testing. Remote diagnostics and preventive healthcare are driving market growth, enabling early detection and treatment of conditions such as anemia and leukemia. Advanced technologies like machine learning (ML) and artificial intelligence (AI) are revolutionizing predictive diagnostics, with applications in D-dimer testing, hemoglobinopathy testing, and fibrinogen assays. Data analytics and microfluidic technology are also transforming plasma and serum analysis, while automated differential count and optical detection enhance accuracy and efficiency.
    • Clinical trials continue to explore the potential of novel techniques like manual differential count, whole blood analysis, and electrochemical detection. The integration of these advanced technologies is reshaping the hematology landscape, offering improved diagnostic capabilities and enhanced patient care.

    Dive into Technavio's robust research methodology, blending expert interviews, extensive data synthesis, and validated models for unparalleled Hematology Analyzers and Reagents Market insights. See full methodology.

    Market Scope

    Report Coverage

    Details

    Page number

    161

    Base year

    2023

    Historic period

    2018-2022

    Forecast period

    2024-2028

    Growth momentum & CAGR

    Accelerate at a CAGR of 6.95%

    Market growth 2024-2028

    USD 3911.6 million

    Market structure

    Fragmented

    YoY growth 2023-2024(%)

    6.54

    Key countries

    US, Canada, Germany, China, and Japan

    Competitive landscape

    Leading Companies, Market Positioning of Companies, Competitive Strategies, and Industry Risks

    Request Free Sample

    What are the Key Data Covered in this Hematology Analyzers and Reagents Market Research and Growth Report?

    • CAGR of the Hematology Analyzers and Reagents industry during the forecast period
    • Detailed information on factors that will drive the growth and forecasting between 2024 and 2028
    • Precise estimation of the size of the market and its contribution of the industry in focus to the parent market
    • Accurate predictions about upcoming growth and trends and changes in consumer behaviour
    • Growth of the market across North America, Asia, Europe, and Rest of World (ROW)
    • Thorough analysis of the market's competitive landscape and detailed information about companies
    • Comprehensive analysis of factors that will challenge the hematology analyzers and reagents market growth of industry companies

    We can help! Our analysts can customize this hematology analyzers and reagents market research report to meet your requirements.

    Get in touch

    1 Executive Summary

    • 1.1 Market overview
      • Exhibit 01: Executive Summary – Chart on Market Overview
      • Exhibit 02: Executive Summary – Data Table on Market Overview
      • Exhibit 03: Executive Summary – Chart on Global Market Characteristics
      • Exhibit 04: Executive Summary – Chart on Market by Geography
      • Exhibit 05: Executive Summary – Chart on Market Segmentation by Product
      • Exhibit 06: Executive Summary – Chart on Market Segmentation by End-user
      • Exhibit 07: Executive Summary – Chart on Incremental Growth
      • Exhibit 08: Executive Summary – Data Table on Incremental Growth
      • Exhibit 09: Executive Summary – Chart on Vendor Market Positioning

    2 Market Landscape

    • 2.1 Market ecosystem
      • Exhibit 10: Parent market
      • Exhibit 11: Market Characteristics

    3 Market Sizing

    • 3.1 Market definition
      • Exhibit 12: Offerings of vendors included in the market definition
    • 3.2 Market segment analysis
      • Exhibit 13: Market segments
    • 3.3 Market size 2023
      • 3.4 Market outlook: Forecast for 2023-2028
        • Exhibit 14: Chart on Global - Market size and forecast 2023-2028 ($ million)
        • Exhibit 15: Data Table on Global - Market size and forecast 2023-2028 ($ million)
        • Exhibit 16: Chart on Global Market: Year-over-year growth 2023-2028 (%)
        • Exhibit 17: Data Table on Global Market: Year-over-year growth 2023-2028 (%)

      4 Historic Market Size

      • 4.1 Global hematology analyzers and reagents market 2018 - 2022
        • Exhibit 18: Historic Market Size – Data Table on global hematology analyzers and reagents market 2018 - 2022 ($ million)
      • 4.2 Product Segment Analysis 2018 - 2022
        • Exhibit 19: Historic Market Size – Product Segment 2018 - 2022 ($ million)
      • 4.3 End-user Segment Analysis 2018 - 2022
        • Exhibit 20: Historic Market Size – End-user Segment 2018 - 2022 ($ million)
      • 4.4 Geography Segment Analysis 2018 - 2022
        • Exhibit 21: Historic Market Size – Geography Segment 2018 - 2022 ($ million)
      • 4.5 Country Segment Analysis 2018 - 2022
        • Exhibit 22: Historic Market Size – Country Segment 2018 - 2022 ($ million)

      5 Five Forces Analysis

      • 5.1 Five forces summary
        • Exhibit 23: Five forces analysis - Comparison between 2023 and 2028
      • 5.2 Bargaining power of buyers
        • Exhibit 24: Chart on Bargaining power of buyers – Impact of key factors 2023 and 2028
      • 5.3 Bargaining power of suppliers
        • Exhibit 25: Bargaining power of suppliers – Impact of key factors in 2023 and 2028
      • 5.4 Threat of new entrants
        • Exhibit 26: Threat of new entrants – Impact of key factors in 2023 and 2028
      • 5.5 Threat of substitutes
        • Exhibit 27: Threat of substitutes – Impact of key factors in 2023 and 2028
      • 5.6 Threat of rivalry
        • Exhibit 28: Threat of rivalry – Impact of key factors in 2023 and 2028
      • 5.7 Market condition
        • Exhibit 29: Chart on Market condition - Five forces 2023 and 2028

      6 Market Segmentation by Product

      • 6.1 Market segments
        • Chart on Product - Market share (2023-2028) (%)
        • Data Table on Product - Market share (2023-2028) (%)
      • 6.2 Comparison by Product
        • Chart on Comparison by Product
        • Data Table on Comparison by Product
      • 6.3 Reagents and consumables - Market size and forecast (2023-2028)
        • Chart on Reagents and consumables - Market size and forecast (2023-2028) ($ million)
        • Data Table on Reagents and consumables - Market size and forecast (2023-2028) ($ million)
        • Chart on Reagents and consumables - Year-over-year growth (2023-2028) (%)
        • Data Table on Reagents and consumables - Year-over-year growth (2023-2028) (%)
      • 6.4 Instruments - Market size and forecast (2023-2028)
        • Chart on Instruments - Market size and forecast (2023-2028) ($ million)
        • Data Table on Instruments - Market size and forecast (2023-2028) ($ million)
        • Chart on Instruments - Year-over-year growth (2023-2028) (%)
        • Data Table on Instruments - Year-over-year growth (2023-2028) (%)
      • 6.5 Market opportunity by Product
        • Market opportunity by Product ($ million)
        • Data Table on Market opportunity by Product ($ million)

      7 Market Segmentation by End-user

      • 7.1 Market segments
        • Chart on End-user - Market share (2023-2028) (%)
        • Data Table on End-user - Market share (2023-2028) (%)
      • 7.2 Comparison by End-user
        • Chart on Comparison by End-user
        • Data Table on Comparison by End-user
      • 7.3 Hospitals - Market size and forecast (2023-2028)
        • Chart on Hospitals - Market size and forecast (2023-2028) ($ million)
        • Data Table on Hospitals - Market size and forecast (2023-2028) ($ million)
        • Chart on Hospitals - Year-over-year growth (2023-2028) (%)
        • Data Table on Hospitals - Year-over-year growth (2023-2028) (%)
      • 7.4 Clinical laboratories - Market size and forecast (2023-2028)
        • Chart on Clinical laboratories - Market size and forecast (2023-2028) ($ million)
        • Data Table on Clinical laboratories - Market size and forecast (2023-2028) ($ million)
        • Chart on Clinical laboratories - Year-over-year growth (2023-2028) (%)
        • Data Table on Clinical laboratories - Year-over-year growth (2023-2028) (%)
      • 7.5 Research institute - Market size and forecast (2023-2028)
        • Chart on Research institute - Market size and forecast (2023-2028) ($ million)
        • Data Table on Research institute - Market size and forecast (2023-2028) ($ million)
        • Chart on Research institute - Year-over-year growth (2023-2028) (%)
        • Data Table on Research institute - Year-over-year growth (2023-2028) (%)
      • 7.6 Others - Market size and forecast (2023-2028)
        • Chart on Others - Market size and forecast (2023-2028) ($ million)
        • Data Table on Others - Market size and forecast (2023-2028) ($ million)
        • Chart on Others - Year-over-year growth (2023-2028) (%)
        • Data Table on Others - Year-over-year growth (2023-2028) (%)
      • 7.7 Market opportunity by End-user
        • Market opportunity by End-user ($ million)
        • Data Table on Market opportunity by End-user ($ million)

      8 Market Segmentation by Analyzer Type

      • 8.1 Market segments
        • Chart on Analyzer Type - Market share (2023-2028) (%)
        • Data Table on Analyzer Type - Market share (2023-2028) (%)
      • 8.2 Comparison by Analyzer Type
        • Chart on Comparison by Analyzer Type
        • Data Table on Comparison by Analyzer Type
      • 3-Part Differential Analyzers - Market size and forecast (2023-2028)
        • Chart on 3-Part Differential Analyzers - Market size and forecast (2023-2028) ($ million)
        • Data Table on 3-Part Differential Analyzers - Market size and forecast (2023-2028) ($ million)
        • Chart on 3-Part Differential Analyzers - Year-over-year growth (2023-2028) (%)
        • Data Table on 3-Part Differential Analyzers - Year-over-year growth (2023-2028) (%)
      • 5-Part Differential Analyzers - Market size and forecast (2023-2028)
        • Chart on 5-Part Differential Analyzers - Market size and forecast (2023-2028) ($ million)
        • Data Table on 5-Part Differential Analyzers - Market size and forecast (2023-2028) ($ million)
        • Chart on 5-Part Differential Analyzers - Year-over-year growth (2023-2028) (%)
        • Data Table on 5-Part Differential Analyzers - Year-over-year growth (2023-2028) (%)
      • 6-Part Differential Analyzers - Market size and forecast (2023-2028)
        • Chart on 6-Part Differential Analyzers - Market size and forecast (2023-2028) ($ million)
        • Data Table on 6-Part Differential Analyzers - Market size and forecast (2023-2028) ($ million)
        • Chart on 6-Part Differential Analyzers - Year-over-year growth (2023-2028) (%)
        • Data Table on 6-Part Differential Analyzers - Year-over-year growth (2023-2028) (%)
      • 8.6 Market opportunity by Analyzer Type
        • Market opportunity by Analyzer Type ($ million)
        • Data Table on Market opportunity by Analyzer Type ($ million)

      9 Market Segmentation by Application

      • 9.1 Market segments
        • Chart on Application - Market share (2023-2028) (%)
        • Data Table on Application - Market share (2023-2028) (%)
      • 9.2 Comparison by Application
        • Chart on Comparison by Application
        • Data Table on Comparison by Application
      • 9.3 Anemia - Market size and forecast (2023-2028)
        • Chart on Anemia - Market size and forecast (2023-2028) ($ million)
        • Data Table on Anemia - Market size and forecast (2023-2028) ($ million)
        • Chart on Anemia - Year-over-year growth (2023-2028) (%)
        • Data Table on Anemia - Year-over-year growth (2023-2028) (%)
      • 9.4 Blood Cancer - Market size and forecast (2023-2028)
        • Chart on Blood Cancer - Market size and forecast (2023-2028) ($ million)
        • Data Table on Blood Cancer - Market size and forecast (2023-2028) ($ million)
        • Chart on Blood Cancer - Year-over-year growth (2023-2028) (%)
        • Data Table on Blood Cancer - Year-over-year growth (2023-2028) (%)
      • 9.5 Hemorrhagic Conditions - Market size and forecast (2023-2028)
        • Chart on Hemorrhagic Conditions - Market size and forecast (2023-2028) ($ million)
        • Data Table on Hemorrhagic Conditions - Market size and forecast (2023-2028) ($ million)
        • Chart on Hemorrhagic Conditions - Year-over-year growth (2023-2028) (%)
        • Data Table on Hemorrhagic Conditions - Year-over-year growth (2023-2028) (%)
      • 9.6 Infectious Diseases - Market size and forecast (2023-2028)
        • Chart on Infectious Diseases - Market size and forecast (2023-2028) ($ million)
        • Data Table on Infectious Diseases - Market size and forecast (2023-2028) ($ million)
        • Chart on Infectious Diseases - Year-over-year growth (2023-2028) (%)
        • Data Table on Infectious Diseases - Year-over-year growth (2023-2028) (%)
      • 9.7 Immune System Disorders - Market size and forecast (2023-2028)
        • Chart on Immune System Disorders - Market size and forecast (2023-2028) ($ million)
        • Data Table on Immune System Disorders - Market size and forecast (2023-2028) ($ million)
        • Chart on Immune System Disorders - Year-over-year growth (2023-2028) (%)
        • Data Table on Immune System Disorders - Year-over-year growth (2023-2028) (%)
      • 9.8 Market opportunity by Application
        • Market opportunity by Application ($ million)
        • Data Table on Market opportunity by Application ($ million)

      8 Customer Landscape

      • 8.1 Customer landscape overview
        • Exhibit 66: Analysis of price sensitivity, lifecycle, customer purchase basket, adoption rates, and purchase criteria

      9 Geographic Landscape

      • 9.1 Geographic segmentation
        • Exhibit 67: Chart on Market share by geography 2023-2028 (%)
        • Exhibit 68: Data Table on Market share by geography 2023-2028 (%)
      • 9.2 Geographic comparison
        • Exhibit 69: Chart on Geographic comparison
        • Exhibit 70: Data Table on Geographic comparison
      • 9.3 North America - Market size and forecast 2023-2028
        • Exhibit 71: Chart on North America - Market size and forecast 2023-2028 ($ million)
        • Exhibit 72: Data Table on North America - Market size and forecast 2023-2028 ($ million)
        • Exhibit 73: Chart on North America - Year-over-year growth 2023-2028 (%)
        • Exhibit 74: Data Table on North America - Year-over-year growth 2023-2028 (%)
      • 9.4 Asia - Market size and forecast 2023-2028
        • Exhibit 75: Chart on Asia - Market size and forecast 2023-2028 ($ million)
        • Exhibit 76: Data Table on Asia - Market size and forecast 2023-2028 ($ million)
        • Exhibit 77: Chart on Asia - Year-over-year growth 2023-2028 (%)
        • Exhibit 78: Data Table on Asia - Year-over-year growth 2023-2028 (%)
      • 9.5 Europe - Market size and forecast 2023-2028
        • Exhibit 79: Chart on Europe - Market size and forecast 2023-2028 ($ million)
        • Exhibit 80: Data Table on Europe - Market size and forecast 2023-2028 ($ million)
        • Exhibit 81: Chart on Europe - Year-over-year growth 2023-2028 (%)
        • Exhibit 82: Data Table on Europe - Year-over-year growth 2023-2028 (%)
      • 9.6 Rest of World (ROW) - Market size and forecast 2023-2028
        • Exhibit 83: Chart on Rest of World (ROW) - Market size and forecast 2023-2028 ($ million)
        • Exhibit 84: Data Table on Rest of World (ROW) - Market size and forecast 2023-2028 ($ million)
        • Exhibit 85: Chart on Rest of World (ROW) - Year-over-year growth 2023-2028 (%)
        • Exhibit 86: Data Table on Rest of World (ROW) - Year-over-year growth 2023-2028 (%)
      • 9.7 US - Market size and forecast 2023-2028
        • Exhibit 87: Chart on US - Market size and forecast 2023-2028 ($ million)
        • Exhibit 88: Data Table on US - Market size and forecast 2023-2028 ($ million)
        • Exhibit 89: Chart on US - Year-over-year growth 2023-2028 (%)
        • Exhibit 90: Data Table on US - Year-over-year growth 2023-2028 (%)
      • 9.8 China - Market size and forecast 2023-2028
        • Exhibit 91: Chart on China - Market size and forecast 2023-2028 ($ million)
        • Exhibit 92: Data Table on China - Market size and forecast 2023-2028 ($ million)
        • Exhibit 93: Chart on China - Year-over-year growth 2023-2028 (%)
        • Exhibit 94: Data Table on China - Year-over-year growth 2023-2028 (%)
      • 9.9 Canada - Market size and forecast 2023-2028
        • Exhibit 95: Chart on Canada - Market size and forecast 2023-2028 ($ million)
        • Exhibit 96: Data Table on Canada - Market size and forecast 2023-2028 ($ million)
        • Exhibit 97: Chart on Canada - Year-over-year growth 2023-2028 (%)
        • Exhibit 98: Data Table on Canada - Year-over-year growth 2023-2028 (%)
      • 9.10 Germany - Market size and forecast 2023-2028
        • Exhibit 99: Chart on Germany - Market size and forecast 2023-2028 ($ million)
        • Exhibit 100: Data Table on Germany - Market size and forecast 2023-2028 ($ million)
        • Exhibit 101: Chart on Germany - Year-over-year growth 2023-2028 (%)
        • Exhibit 102: Data Table on Germany - Year-over-year growth 2023-2028 (%)
      • 9.11 Japan - Market size and forecast 2023-2028
        • Exhibit 103: Chart on Japan - Market size and forecast 2023-2028 ($ million)
        • Exhibit 104: Data Table on Japan - Market size and forecast 2023-2028 ($ million)
        • Exhibit 105: Chart on Japan - Year-over-year growth 2023-2028 (%)
        • Exhibit 106: Data Table on Japan - Year-over-year growth 2023-2028 (%)
      • 9.12 Market opportunity by geography
        • Exhibit 107: Market opportunity by geography ($ million)
        • Exhibit 108: Data Tables on Market opportunity by geography ($ million)
      • 11.13 UK - Market size and forecast (2023-2028)
        • Chart on UK - Market size and forecast (2023-2028) ($ million)
        • Data Table on UK - Market size and forecast (2023-2028) ($ million)
        • Chart on UK - Year-over-year growth (2023-2028) (%)
        • Data Table on UK - Year-over-year growth (2023-2028) (%)
      • 11.14 Italy - Market size and forecast (2023-2028)
        • Chart on Italy - Market size and forecast (2023-2028) ($ million)
        • Data Table on Italy - Market size and forecast (2023-2028) ($ million)
        • Chart on Italy - Year-over-year growth (2023-2028) (%)
        • Data Table on Italy - Year-over-year growth (2023-2028) (%)
      • 11.15 France - Market size and forecast (2023-2028)
        • Chart on France - Market size and forecast (2023-2028) ($ million)
        • Data Table on France - Market size and forecast (2023-2028) ($ million)
        • Chart on France - Year-over-year growth (2023-2028) (%)
        • Data Table on France - Year-over-year growth (2023-2028) (%)
      • 11.16 India - Market size and forecast (2023-2028)
        • Chart on India - Market size and forecast (2023-2028) ($ million)
        • Data Table on India - Market size and forecast (2023-2028) ($ million)
        • Chart on India - Year-over-year growth (2023-2028) (%)
        • Data Table on India - Year-over-year growth (2023-2028) (%)
      • 11.17 Brazil - Market size and forecast (2023-2028)
        • Chart on Brazil - Market size and forecast (2023-2028) ($ million)
        • Data Table on Brazil - Market size and forecast (2023-2028) ($ million)
        • Chart on Brazil - Year-over-year growth (2023-2028) (%)
        • Data Table on Brazil - Year-over-year growth (2023-2028) (%)
      • 11.18 Egypt - Market size and forecast (2023-2028)
        • Chart on Egypt - Market size and forecast (2023-2028) ($ million)
        • Data Table on Egypt - Market size and forecast (2023-2028) ($ million)
        • Chart on Egypt - Year-over-year growth (2023-2028) (%)
        • Data Table on Egypt - Year-over-year growth (2023-2028) (%)
      • 11.19 UAE - Market size and forecast (2023-2028)
        • Chart on UAE - Market size and forecast (2023-2028) ($ million)
        • Data Table on UAE - Market size and forecast (2023-2028) ($ million)
        • Chart on UAE - Year-over-year growth (2023-2028) (%)
        • Data Table on UAE - Year-over-year growth (2023-2028) (%)
      • 11.20 Oman - Market size and forecast (2023-2028)
        • Chart on Oman - Market size and forecast (2023-2028) ($ million)
        • Data Table on Oman - Market size and forecast (2023-2028) ($ million)
        • Chart on Oman - Year-over-year growth (2023-2028) (%)
        • Data Table on Oman - Year-over-year growth (2023-2028) (%)
      • 11.21 Argentina - Market size and forecast (2023-2028)
        • Chart on Argentina - Market size and forecast (2023-2028) ($ million)
        • Data Table on Argentina - Market size and forecast (2023-2028) ($ million)
        • Chart on Argentina - Year-over-year growth (2023-2028) (%)
        • Data Table on Argentina - Year-over-year growth (2023-2028) (%)
      • 11.22 KSA - Market size and forecast (2023-2028)
        • Chart on KSA - Market size and forecast (2023-2028) ($ million)
        • Data Table on KSA - Market size and forecast (2023-2028) ($ million)
        • Chart on KSA - Year-over-year growth (2023-2028) (%)
        • Data Table on KSA - Year-over-year growth (2023-2028) (%)

      10 Drivers, Challenges, and Trends

      • 10.1 Market drivers
        • 10.2 Market challenges
          • 10.3 Impact of drivers and challenges
            • Exhibit 109: Impact of drivers and challenges in 2023 and 2028
          • 10.4 Market trends

            11 Vendor Landscape

            • 11.1 Overview
              • 11.2 Vendor landscape
                • Exhibit 110: Overview on Criticality of inputs and Factors of differentiation
              • 11.3 Landscape disruption
                • Exhibit 111: Overview on factors of disruption
              • 11.4 Industry risks
                • Exhibit 112: Impact of key risks on business

              12 Vendor Analysis

              • 12.1 Vendors covered
                • Exhibit 113: Vendors covered
              • 12.2 Market positioning of vendors
                • Exhibit 114: Matrix on vendor position and classification
              • 12.3 Abbott Laboratories
                • Exhibit 115: Abbott Laboratories - Overview
                • Exhibit 116: Abbott Laboratories - Business segments
                • Exhibit 117: Abbott Laboratories - Key news
                • Exhibit 118: Abbott Laboratories - Key offerings
                • Exhibit 119: Abbott Laboratories - Segment focus
              • 12.4 Bio Rad Laboratories Inc.
                • Exhibit 120: Bio Rad Laboratories Inc. - Overview
                • Exhibit 121: Bio Rad Laboratories Inc. - Business segments
                • Exhibit 122: Bio Rad Laboratories Inc. - Key news
                • Exhibit 123: Bio Rad Laboratories Inc. - Key offerings
                • Exhibit 124: Bio Rad Laboratories Inc. - Segment focus
              • 12.5 BioSystems SA
                • Exhibit 125: BioSystems SA - Overview
                • Exhibit 126: BioSystems SA - Product / Service
                • Exhibit 127: BioSystems SA - Key offerings
              • 12.6 Boule Diagnostics AB
                • Exhibit 128: Boule Diagnostics AB - Overview
                • Exhibit 129: Boule Diagnostics AB - Product / Service
                • Exhibit 130: Boule Diagnostics AB - Key offerings
              • 12.7 Danaher Corp.
                • Exhibit 131: Danaher Corp. - Overview
                • Exhibit 132: Danaher Corp. - Business segments
                • Exhibit 133: Danaher Corp. - Key news
                • Exhibit 134: Danaher Corp. - Key offerings
                • Exhibit 135: Danaher Corp. - Segment focus
              • 12.8 EKF Diagnostics Holdings Plc
                • Exhibit 136: EKF Diagnostics Holdings Plc - Overview
                • Exhibit 137: EKF Diagnostics Holdings Plc - Business segments
                • Exhibit 138: EKF Diagnostics Holdings Plc - Key offerings
                • Exhibit 139: EKF Diagnostics Holdings Plc - Segment focus
              • 12.9 F. Hoffmann La Roche Ltd.
                • Exhibit 140: F. Hoffmann La Roche Ltd. - Overview
                • Exhibit 141: F. Hoffmann La Roche Ltd. - Business segments
                • Exhibit 142: F. Hoffmann La Roche Ltd. - Key news
                • Exhibit 143: F. Hoffmann La Roche Ltd. - Key offerings
                • Exhibit 144: F. Hoffmann La Roche Ltd. - Segment focus
              • 12.10 Heska Corp.
                • Exhibit 145: Heska Corp. - Overview
                • Exhibit 146: Heska Corp. - Business segments
                • Exhibit 147: Heska Corp. - Key news
                • Exhibit 148: Heska Corp. - Key offerings
                • Exhibit 149: Heska Corp. - Segment focus
              • 12.11 HORIBA Ltd.
                • Exhibit 150: HORIBA Ltd. - Overview
                • Exhibit 151: HORIBA Ltd. - Business segments
                • Exhibit 152: HORIBA Ltd. - Key offerings
                • Exhibit 153: HORIBA Ltd. - Segment focus
              • 12.12 Mindray Bio medical Electronics Co. Ltd.
                • Exhibit 154: Mindray Bio medical Electronics Co. Ltd. - Overview
                • Exhibit 155: Mindray Bio medical Electronics Co. Ltd. - Product / Service
                • Exhibit 156: Mindray Bio medical Electronics Co. Ltd. - Key offerings
              • 12.13 Nihon Kohden Corp.
                • Exhibit 157: Nihon Kohden Corp. - Overview
                • Exhibit 158: Nihon Kohden Corp. - Product / Service
                • Exhibit 159: Nihon Kohden Corp. - Key news
                • Exhibit 160: Nihon Kohden Corp. - Key offerings
              • 12.14 Siemens AG
                • Exhibit 161: Siemens AG - Overview
                • Exhibit 162: Siemens AG - Business segments
                • Exhibit 163: Siemens AG - Key news
                • Exhibit 164: Siemens AG - Key offerings
                • Exhibit 165: Siemens AG - Segment focus
              • 12.15 STRATEC SE
                • Exhibit 166: STRATEC SE - Overview
                • Exhibit 167: STRATEC SE - Business segments
                • Exhibit 168: STRATEC SE - Key offerings
                • Exhibit 169: STRATEC SE - Segment focus
              • 12.16 Sysmex Corp.
                • Exhibit 170: Sysmex Corp. - Overview
                • Exhibit 171: Sysmex Corp. - Business segments
                • Exhibit 172: Sysmex Corp. - Key offerings
                • Exhibit 173: Sysmex Corp. - Segment focus
              • 12.17 Zoetis Inc.
                • Exhibit 174: Zoetis Inc. - Overview
                • Exhibit 175: Zoetis Inc. - Business segments
                • Exhibit 176: Zoetis Inc. - Key news
                • Exhibit 177: Zoetis Inc. - Key offerings
                • Exhibit 178: Zoetis Inc. - Segment focus

              13 Appendix

              • 13.1 Scope of the report
                • 13.2 Inclusions and exclusions checklist
                  • Exhibit 179: Inclusions checklist
                  • Exhibit 180: Exclusions checklist
                • 13.3 Currency conversion rates for US$
                  • Exhibit 181: Currency conversion rates for US$
                • 13.4 Research methodology
                  • Exhibit 182: Research methodology
                  • Exhibit 183: Validation techniques employed for market sizing
                  • Exhibit 184: Information sources
                • 13.5 List of abbreviations
                  • Exhibit 185: List of abbreviations

                Research Methodology

                Technavio presents a detailed picture of the market by way of study, synthesis, and summation of data from multiple sources. The analysts have presented the various facets of the market with a particular focus on identifying the key industry influencers. The data thus presented is comprehensive, reliable, and the result of extensive research, both primary and secondary.

                INFORMATION SOURCES

                Primary sources

                • Manufacturers and suppliers
                • Channel partners
                • Industry experts
                • Strategic decision makers

                Secondary sources

                • Industry journals and periodicals
                • Government data
                • Financial reports of key industry players
                • Historical data
                • Press releases

                DATA ANALYSIS

                Data Synthesis

                • Collation of data
                • Estimation of key figures
                • Analysis of derived insights

                Data Validation

                • Triangulation with data models
                • Reference against proprietary databases
                • Corroboration with industry experts

                REPORT WRITING

                Qualitative

                • Market drivers
                • Market challenges
                • Market trends
                • Five forces analysis

                Quantitative

                • Market size and forecast
                • Market segmentation
                • Geographical insights
                • Competitive landscape

                Interested in this report?

                Get your sample now to see our research methodology and insights!

                Download Now

                Frequently Asked Questions

                Hematology Analyzers and Reagents market growth will increase by $ 3911.6 mn during 2024-2028 .

                The Hematology Analyzers and Reagents market is expected to grow at a CAGR of 6.95% during 2024-2028 .

                Hematology Analyzers and Reagents market is segmented by Product( Reagents and consumables, Instruments, Instruments) End-user( Hospitals, Clinical laboratories, Research institute, Others)

                Abbott Laboratories, Bio Rad Laboratories Inc., BioSystems SA, Boule Diagnostics AB, Danaher Corp., EKF Diagnostics Holdings Plc, Erba Diagnostics FZ LLC, F. Hoffmann La Roche Ltd., Heska Corp., HORIBA Ltd., Mindray Bio medical Electronics Co. Ltd., NeoMedica, Nihon Kohden Corp., Siemens AG, STRATEC SE, Sysmex Corp., Thermo Fisher Scientific Inc., Toyobo Co. Ltd., URIT Medical Electronic Co. Ltd., Zoetis Inc. are a few of the key vendors in the Hematology Analyzers and Reagents market.

                North America will register the highest growth rate of 37% among the other regions. Therefore, the Hematology Analyzers and Reagents market in North America is expected to garner significant business opportunities for the vendors during the forecast period.

                US, Canada, Germany, UK, Italy, France, China, India, Japan, Brazil, Egypt, UAE, Oman, Argentina, KSA, UAE, Brazil, Rest of World (ROW)

                • Increase adoption of hematology analyzer solutions for smaller and mid-sized laboratoriesFully automated laboratory solutions are cost-effective and provide precise results. Automated solutions also save the time of hospitals and clinical laboratories as automation replaces manually intensive tasks is the driving factor this market.
                • allowing researchers to focus more on analyzing and interpreting results by saving time. Automation reduces the chances of human error is the driving factor this market.
                • thereby improving the productivity of laboratories. It also contributes to procuring data-driven insights as the technology used to automate processes delivers a large volume of data at a faster turnaround time with superior performance optimization. With each step is the driving factor this market.
                • automated systems collect data on the working of the process and use the information to improve the same process is the driving factor this market.
                • which increases throughput and reduces the workload on healthcare professionals. For instance is the driving factor this market.
                • the DxH 900 hematology analyzer by Danaher is an automated hematology analyzer system is the driving factor this market.
                • which reduces manual interventions with automated maintenance procedures and fewer reagent turnovers to maximize walk-away time. It offers one-touch sample processing is the driving factor this market.
                • thereby maximizing efficiency with complete automation. The presence of laboratory automation systems helps hospitals is the driving factor this market.
                • diagnostic laboratories is the driving factor this market.
                • and research institutes handle the movement of specimens with disciplines and generate results quickly. The ability to move liquids in laboratories in a predefined volume is essential in research and pharmaceutical industries. Also is the driving factor this market.
                • large assays that can investigate more samples and biological targets in a limited time must be run. Moreover is the driving factor this market.
                • the wide range of applications offered by hematology analyzers is the driving factor this market.
                • including complete blood count analysis is the driving factor this market.
                • white blood cell count is the driving factor this market.
                • reticulocyte analysis is the driving factor this market.
                • and coagulation tests is the driving factor this market.
                • will increase their adoption and consequently expand the growth of the global hematology analyzers and reagents market during the forecast period. is the driving factor this market.

                The Hematology Analyzers and Reagents market vendors should focus on grabbing business opportunities from the Reagents and consumables segment as it accounted for the largest market share in the base year.