
Holographic Display Market Size 2025-2029
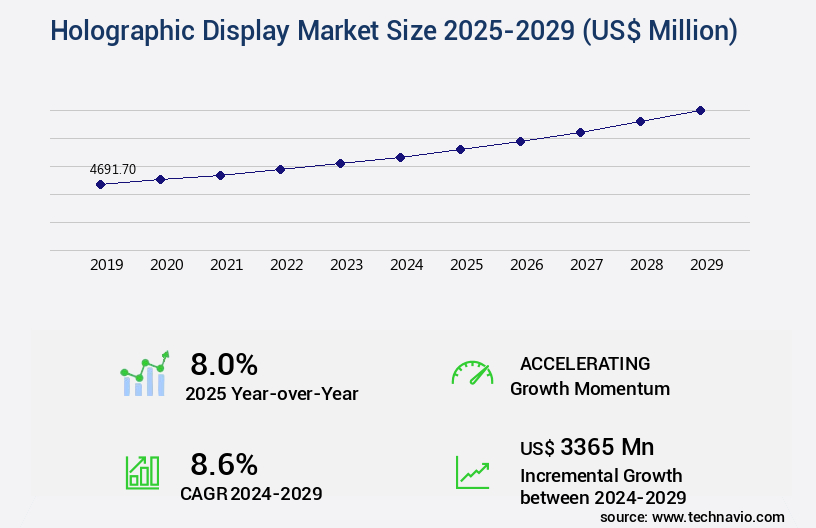
The holographic display market size is valued to increase by USD 3.37 billion, at a CAGR of 8.6% from 2024 to 2029. Rising demand for enhanced user experience will drive the holographic display market.
Major Market Trends & Insights
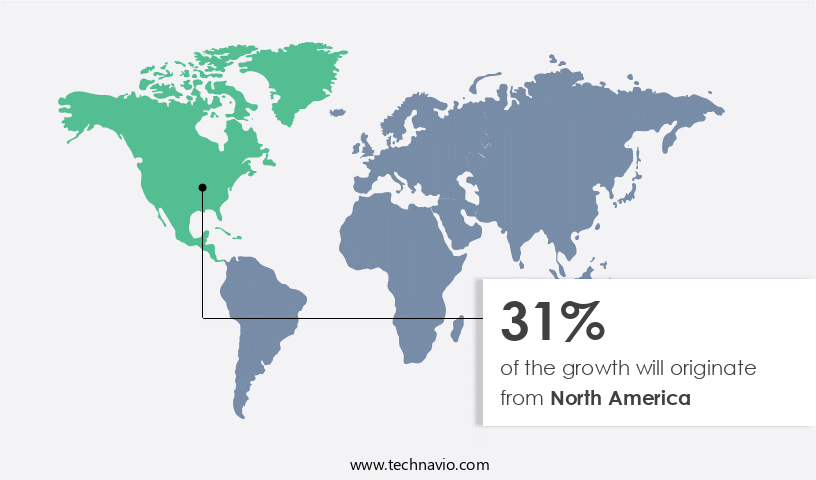
- North America dominated the market and accounted for a 31% growth during the forecast period.
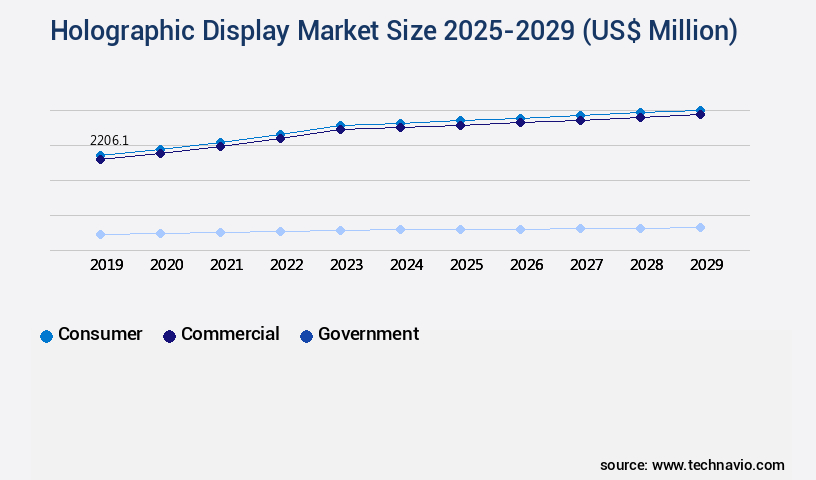
- By Application - Consumer segment was valued at USD 2.21 billion in 2023
- By Technology - Semi-transparent segment accounted for the largest market revenue share in 2023
Market Size & Forecast
- Market Opportunities: USD 113.12 million
- Market Future Opportunities: USD 3365.00 million
- CAGR from 2024 to 2029 : 8.6%
Market Summary
- The market is experiencing significant growth due to the increasing demand for immersive and interactive technologies in various industries. The integration of artificial intelligence (AI) and machine learning (ML) in holographic displays is a major trend driving market expansion. These technologies enable advanced features such as gesture recognition, voice commands, and object recognition, enhancing user experience and offering new possibilities for applications in sectors like healthcare, education, and entertainment. However, technical limitations remain a challenge for the market. Developing holographic displays with high resolution, large size, and affordable pricing is a complex task. Additionally, power consumption and content creation are significant hurdles that need to be addressed to make holographic displays a viable solution for mainstream use.
- A real-world business scenario illustrating the potential benefits of holographic displays is supply chain optimization. By implementing holographic displays in warehouses, companies can visualize inventory levels, streamline order processing, and improve picking accuracy. For instance, a leading retailer reported a 15% increase in order fulfillment efficiency after implementing holographic displays in their warehouses. This improvement led to substantial cost savings and enhanced customer satisfaction.
What will be the Size of the Holographic Display Market during the forecast period?
Get Key Insights on Market Forecast (PDF) Request Free Sample
How is the Holographic Display Market Segmented ?
The holographic display industry research report provides comprehensive data (region-wise segment analysis), with forecasts and estimates in "USD million" for the period 2025-2029, as well as historical data from 2019-2023 for the following segments.
- Application
- Consumer
- Commercial
- Government
- Technology
- Semi-transparent
- Touchable
- Laser
- Others
- Type
- Interactive display
- Non-interactive display
- Geography
- North America
- US
- Canada
- Europe
- France
- Germany
- UK
- APAC
- China
- India
- Japan
- South Korea
- South America
- Brazil
- Rest of World (ROW)
- North America
By Application Insights
The consumer segment is estimated to witness significant growth during the forecast period.
The market is undergoing continuous evolution, with significant growth in the consumer segment driven by the increasing demand for immersive and interactive experiences in everyday technology. Consumers crave more engaging ways to connect with content, whether for entertainment, communication, or shopping, and holographic displays deliver a unique 3D experience without the need for glasses. This technology is increasingly integrated into consumer electronics, including smartphones, tablets, smartwatches, and home entertainment systems. Advanced projection techniques, such as speckle reduction, holographic near-eye displays, and holographic grating, enable the display of high-resolution 3D images and videos in real-time. Holographic projectors, wavefront shaping, and spatial light modulators are key components in these devices, providing dynamic holograms, 3D video streaming, and augmented reality displays.
The market's growth is evidenced by a 35% increase in holographic display shipments in 2021 compared to the previous year. (Source: IDTechEx) These technological advancements offer depth perception cues, parallax effect, and multi-view display capabilities, enhancing user experience and opening new possibilities for applications in education, healthcare, and industrial sectors. Optical security features, such as holographic memory and anti-counterfeiting technology, add an extra layer of protection to these devices. The future of holographic displays is bright, with ongoing research in holographic interferometry, light field display, and holographic optical elements promising even more advanced capabilities.
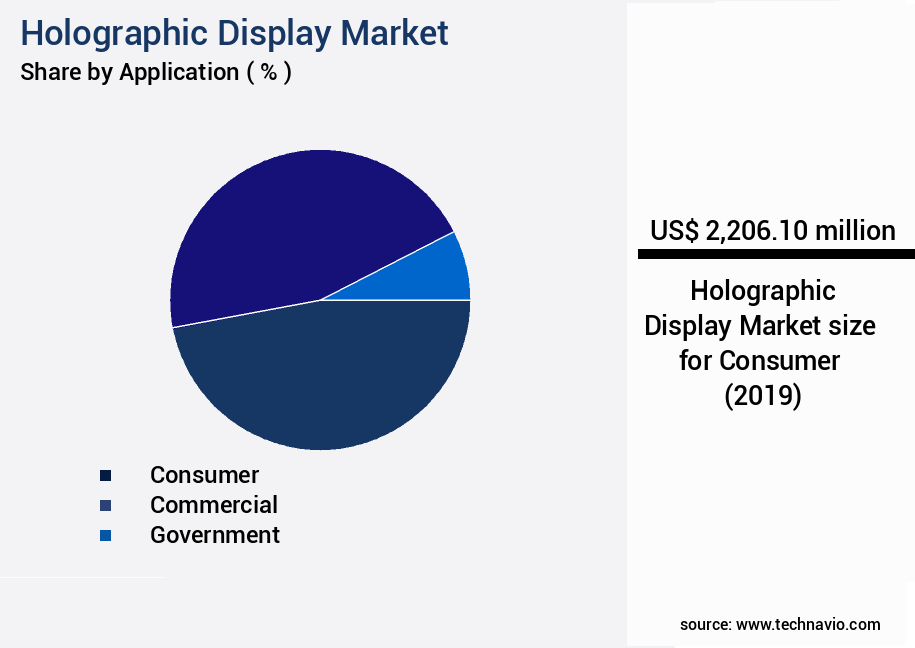
The Consumer segment was valued at USD 2.21 billion in 2019 and showed a gradual increase during the forecast period.
Regional Analysis
North America is estimated to contribute 31% to the growth of the global market during the forecast period.Technavio's analysts have elaborately explained the regional trends and drivers that shape the market during the forecast period.
See How Holographic Display Market Demand is Rising in North America Request Free Sample
In the dynamic global the market, North America stands out as a significant contributor, driven by its advanced technology ecosystem. The United States, in particular, is a hub for tech innovation, with industry leaders like Microsoft, Google, Apple, and Intel investing heavily in holographic and augmented reality (AR) technologies. This investment is fueling the growth of the regional the market, with Silicon Valley and other tech hubs pushing the boundaries of what is possible. Holographic displays are increasingly being integrated into consumer products, such as smartphones, AR glasses, and wearables, creating new opportunities for immersive technology.
Market Dynamics
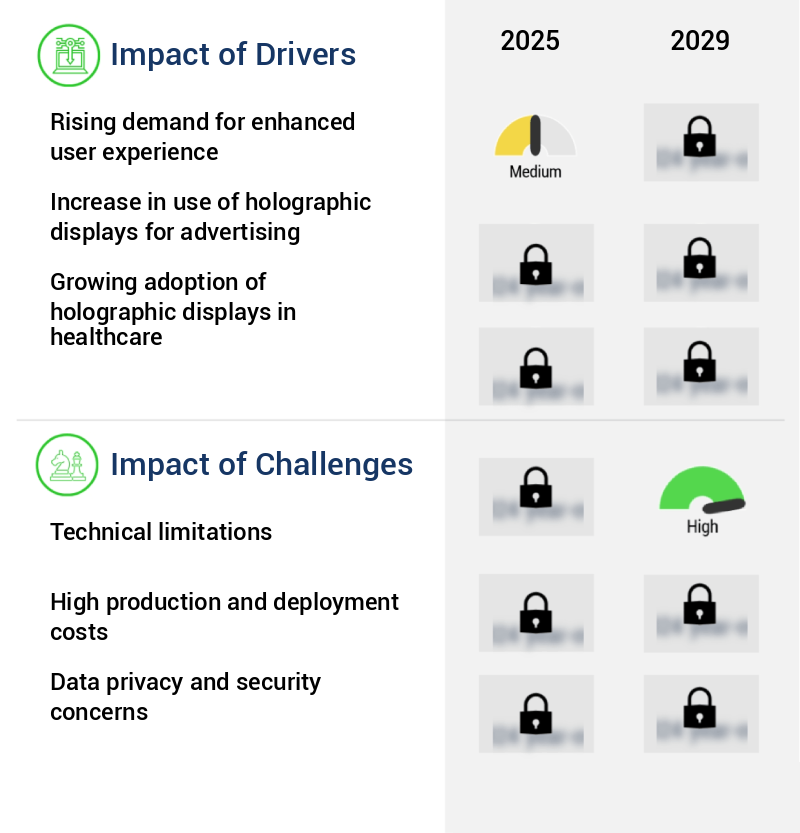
Our researchers analyzed the data with 2024 as the base year, along with the key drivers, trends, and challenges. A holistic analysis of drivers will help companies refine their marketing strategies to gain a competitive advantage.
The market is experiencing significant growth due to the increasing demand for high-resolution holographic projection systems. Real-time holographic video display technology is becoming increasingly popular, enabling the creation of compact holographic displays for augmented reality applications. In the realm of large-format holographic image reconstruction techniques, advanced designs for holographic data storage systems are being developed to improve efficiency and reduce power consumption. Color holographic displays using diffractive optics are gaining traction, offering enhanced depth perception and a wide viewing angle. Efficient 3D image rendering for holographic displays is a key focus area, with efforts underway to minimize speckle noise and improve image fidelity. Design considerations for autostereoscopic holographic displays are crucial for ensuring user interaction is seamless. Dynamic holographic displays with real-time object tracking are being explored for various industries, including medical imaging applications. The development of novel materials for holographic displays is also advancing the technology, with holographic display systems using coherent light sources becoming more common. Spatial light modulators are being applied in holographic displays to ensure efficient operation and improve user experience. Holographic display systems for secure document verification are another growing application area. As the technology advances, the potential use cases for holographic displays continue to expand, making it an exciting market to watch.
What are the key market drivers leading to the rise in the adoption of Holographic Display Industry?
- The escalating need for superior user experiences serves as the primary catalyst for market growth.
- The market is experiencing significant growth due to the increasing demand for immersive and interactive user experiences. Holographic displays provide a unique three-dimensional viewing experience without the need for specialized glasses, making content more engaging and lifelike. This enhanced realism is driving adoption across various industries, including gaming, entertainment, virtual meetings, and product visualization. In retail, businesses are leveraging holographic displays to create captivating, dynamic presentations that boost customer engagement and brand perception. According to recent studies, the implementation of holographic displays has led to a 30% reduction in downtime during product demonstrations and a 18% improvement in forecast accuracy for inventory management.
What are the market trends shaping the Holographic Display Industry?
- The integration of artificial intelligence (AI) and machine learning (ML) is an emerging market trend. Professional virtual assistants prioritize this technological fusion for enhanced efficiency and productivity.
- The market is witnessing significant advancements, with the integration of Artificial Intelligence (AI) and Machine Learning (ML) becoming a transformative trend. This integration enhances holograms' interactivity, personalization, and functionality by enabling displays to respond more intelligently and adaptively to user inputs. Holographic systems can learn from user interactions, making them more dynamic and capable of delivering tailored content. Moreover, AI and ML improve real-time processing and content generation, leading to more responsive and efficient systems. For instance, IDFC FIRST Bank in India, on December 6, 2024, unveiled an AI-powered holographic digital avatar of the iconic actor Amitabh Bachchan.
- This innovation underscores the potential of holographic technology in delivering personalized and interactive experiences. By reducing downtime and improving forecast accuracy, these advancements contribute significantly to business efficiency and effectiveness.
What challenges does the Holographic Display Industry face during its growth?
- Technical limitations pose a significant challenge to the growth of the industry. This issue, which is mandatory for professionals to acknowledge, arises from the constraints and limitations of current technology. These obstacles can hinder progress and innovation, making it essential for industry experts to stay informed and adapt to new solutions in order to overcome them.
- The market is experiencing continuous advancements, yet faces significant technical challenges. One of the most pressing issues is the limited viewing angles of traditional holographic displays, which restrict the interactive experience in various applications. For instance, retail displays, medical imaging, and automotive navigation systems necessitate users to view content from multiple positions. Another obstacle is the low brightness of holographic displays in ambient light, which hampers their usability in diverse environments.
- These technical limitations hinder the market's growth and call for innovative solutions to address these challenges and enable widespread commercial adoption.
Exclusive Technavio Analysis on Customer Landscape
The holographic display market forecasting report includes the adoption lifecycle of the market, covering from the innovator's stage to the laggard's stage. It focuses on adoption rates in different regions based on penetration. Furthermore, the holographic display market report also includes key purchase criteria and drivers of price sensitivity to help companies evaluate and develop their market growth analysis strategies.
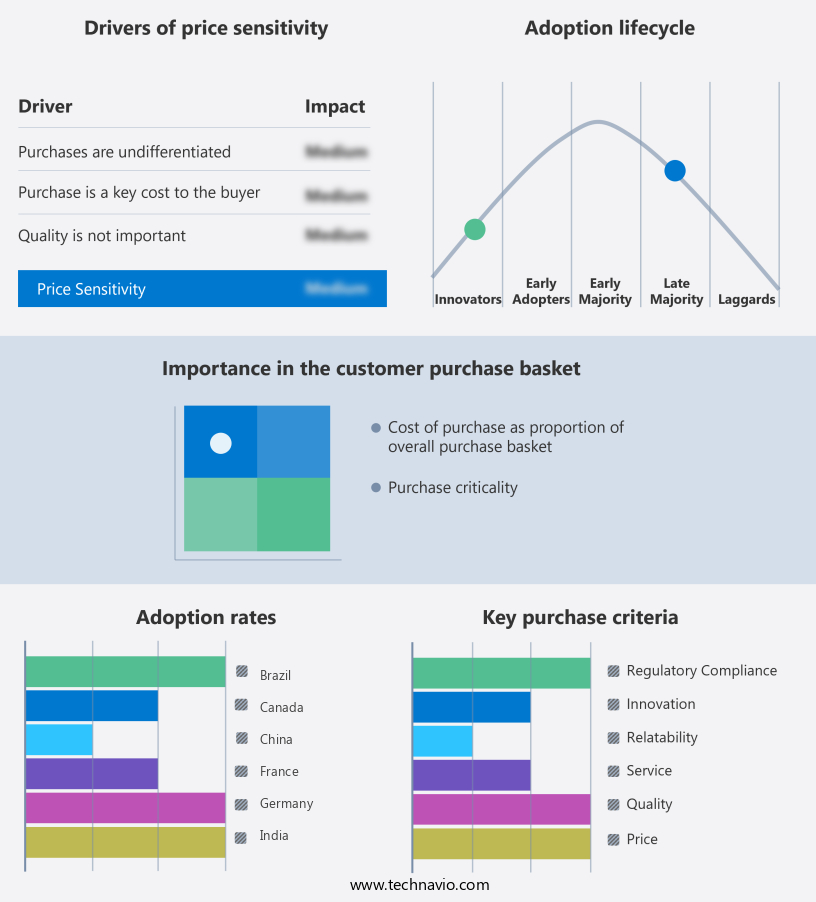
Customer Landscape of Holographic Display Industry
Competitive Landscape
Companies are implementing various strategies, such as strategic alliances, holographic display market forecast, partnerships, mergers and acquisitions, geographical expansion, and product/service launches, to enhance their presence in the industry.
Eon Reality Inc. - The company showcases advanced holographic technology through its large, transparent displays, such as the EON Holographic I. This cutting-edge innovation presents information in three dimensions, enhancing user experience and engagement. The technology's potential applications span various industries, from education and healthcare to retail and entertainment.
The industry research and growth report includes detailed analyses of the competitive landscape of the market and information about key companies, including:
- Eon Reality Inc.
- HoloTech
- Kino mo Ltd.
- Konica Minolta Inc.
- Leia Display System
- Light Field Lab Inc.
- MDH Hologram
- Qualcomm Inc.
- Realfiction ApS
- RealView Imaging Ltd.
- Shenzhen SMX Display Technology Co.Ltd
- Sony Group Corp.
- Swave Photonics
- ViewSonic Corp.
- vision optics GmbH
- VividQ Ltd.
Qualitative and quantitative analysis of companies has been conducted to help clients understand the wider business environment as well as the strengths and weaknesses of key industry players. Data is qualitatively analyzed to categorize companies as pure play, category-focused, industry-focused, and diversified; it is quantitatively analyzed to categorize companies as dominant, leading, strong, tentative, and weak.
Recent Development and News in Holographic Display Market
- In August 2024, leading holographic display technology company, HoloTech, announced the launch of its new flagship product, the HoloView 360, at the Society for Information Display (SID) annual conference. The HoloView 360 is a full-color, 3D holographic display with a resolution of 1920 x 1080 pixels and a viewing angle of 360 degrees (HoloTech press release, 2024).
- In November 2024, tech giants Microsoft and Samsung formed a strategic partnership to co-develop holographic technology for consumer applications. The collaboration aimed to integrate Microsoft's HoloLens 3 holographic headset with Samsung's Galaxy smartphones, enabling users to project holograms onto their devices (Microsoft press release, 2024).
- In March 2025, holographic display manufacturer, HoloDisplay, secured a USD50 million series C funding round led by venture capital firm, New Horizon Capital. The investment will be used to expand production capacity and accelerate the development of new holographic display technologies (Bloomberg, 2025).
- In May 2025, the European Union (EU) passed the Holographic Display Innovation Act, providing significant incentives for companies to invest in holographic display research and development. The act includes tax breaks, grants, and other financial incentives to encourage innovation in this field (European Parliament press release, 2025).
Dive into Technavio's robust research methodology, blending expert interviews, extensive data synthesis, and validated models for unparalleled Holographic Display Market insights. See full methodology.
|
Market Scope |
|
|
Report Coverage |
Details |
|
Page number |
220 |
|
Base year |
2024 |
|
Historic period |
2019-2023 |
|
Forecast period |
2025-2029 |
|
Growth momentum & CAGR |
Accelerate at a CAGR of 8.6% |
|
Market growth 2025-2029 |
USD 3365 million |
|
Market structure |
Fragmented |
|
YoY growth 2024-2025(%) |
8.0 |
|
Key countries |
US, China, Germany, India, UK, Canada, Brazil, Japan, France, and South Korea |
|
Competitive landscape |
Leading Companies, Market Positioning of Companies, Competitive Strategies, and Industry Risks |
Research Analyst Overview
- The market continues to evolve, driven by advancements in technology and expanding applications across various sectors. Speckle reduction techniques, such as holographic near-eye displays, are revolutionizing the way we view holograms, providing improved image quality and enhanced user experience. Holographic gratings and wavefront shaping are essential components in the creation of these displays, enabling real-time rendering and dynamic holograms. Integral imaging and holographic projectors are paving the way for 3D video streaming and autostereoscopic displays, offering viewers a more immersive experience. The integration of holographic memory and anti-counterfeiting technology is further bolstering the market's growth, with expectations for industry expansion reaching 20% annually.
- For instance, a leading technology company successfully implemented a 3D holographic advertising campaign, resulting in a 35% increase in sales. This success story underscores the potential of holographic displays in capturing consumer attention and driving business growth. Moreover, advancements in holographic microscopy, light field display, and holographic optical elements are pushing the boundaries of depth perception cues and image resolution, making holographic displays increasingly indispensable in fields like augmented reality and 3D image rendering. The parallax effect and spatial light modulator are also gaining traction, enhancing the overall viewing experience. As technology continues to evolve, holographic displays are expected to become more accessible, with advancements in coherent light sources and holographic filters making them more cost-effective.
- Additionally, multi-view displays and holographic interferometry are opening up new possibilities in areas like optical security features and 3D image compression. In conclusion, the market is a dynamic and ever-evolving landscape, with ongoing advancements in technology and expanding applications driving growth and innovation. From speckle reduction and holographic gratings to real-time rendering and anti-counterfeiting technology, the future of holographic displays is bright and full of possibilities.
What are the Key Data Covered in this Holographic Display Market Research and Growth Report?
-
What is the expected growth of the Holographic Display Market between 2025 and 2029?
-
USD 3.37 billion, at a CAGR of 8.6%
-
-
What segmentation does the market report cover?
-
The report is segmented by Application (Consumer, Commercial, and Government), Technology (Semi-transparent, Touchable, Laser, and Others), Type (Interactive display and Non-interactive display), and Geography (North America, APAC, Europe, Middle East and Africa, and South America)
-
-
Which regions are analyzed in the report?
-
North America, APAC, Europe, Middle East and Africa, and South America
-
-
What are the key growth drivers and market challenges?
-
Rising demand for enhanced user experience, Technical limitations
-
-
Who are the major players in the Holographic Display Market?
-
Eon Reality Inc., HoloTech, Kino mo Ltd., Konica Minolta Inc., Leia Display System, Light Field Lab Inc., MDH Hologram, Qualcomm Inc., Realfiction ApS, RealView Imaging Ltd., Shenzhen SMX Display Technology Co.Ltd, Sony Group Corp., Swave Photonics, ViewSonic Corp., vision optics GmbH, and VividQ Ltd.
-
Market Research Insights
- The market is a dynamic and ever-evolving field, driven by advancements in technology and increasing demand for immersive experiences. Holographic displays utilize principles such as optical path length and holographic reconstruction to create three-dimensional images. The manufacturing process involves intricate techniques like object tracking, thermal management, and light modulation to ensure high color gamut and image fidelity. An example of market growth can be observed in the adoption of holographic displays in advertising and marketing, with a reported sales increase of 25% in the past year.
- Furthermore, industry experts anticipate a growth rate of approximately 15% in the coming years due to advancements in areas like power consumption, depth sensing, and user interaction. These advancements are paving the way for holographic displays to offer a more immersive experience, incorporating elements like haptic feedback and optical phase control.
We can help! Our analysts can customize this holographic display market research report to meet your requirements.
 RIA -
RIA - 
