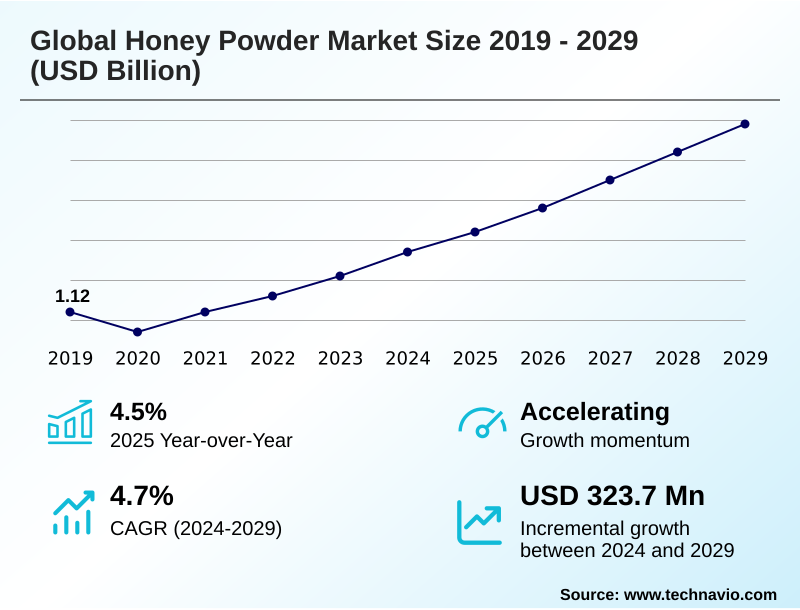
Honey Powder Market Size 2025-2029
The honey powder market size is valued to increase by USD 323.7 million, at a CAGR of 4.7% from 2024 to 2029. Health benefits of consuming honey powder will drive the honey powder market.
Major Market Trends & Insights
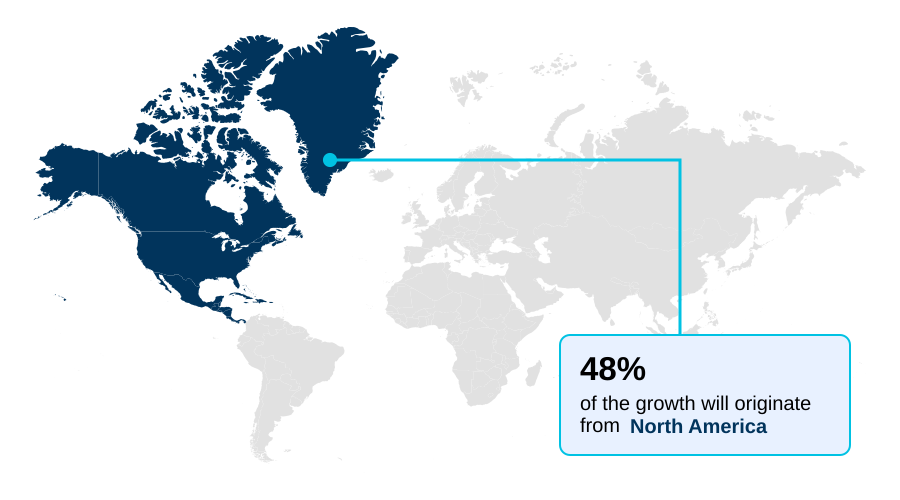
- North America dominated the market and accounted for a 47.7% growth during the forecast period.
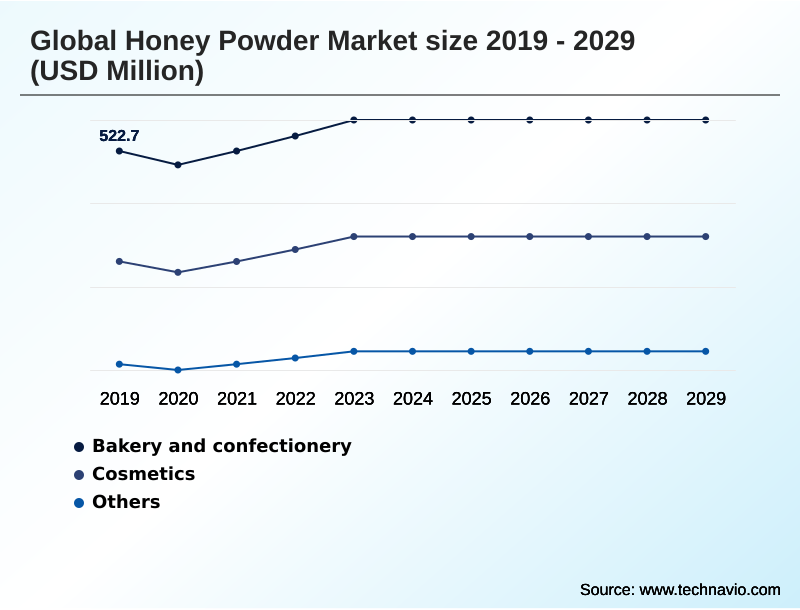
- By Application - Bakery and confectionery segment was valued at USD 565.9 million in 2023
- By Form Factor - Granulated Honey segment accounted for the largest market revenue share in 2023
Market Size & Forecast
- Market Opportunities: USD 472.6 million
- Market Future Opportunities: USD 323.7 million
- CAGR from 2024 to 2029 : 4.7%
Market Summary
- The honey powder market is defined by a pronounced shift towards natural and minimally processed ingredients, driven by health-conscious consumer preferences. This trend positions dehydrated honey solids as a prime alternative to refined sugar across diverse sectors. Food and beverage manufacturers, for instance, leverage its functional benefits to optimize production.
- By substituting liquid honey with a non-caking honey powder, companies can achieve more than a 15% improvement in dosing accuracy and mixing efficiency, reducing operational complexities in large-scale baking and seasoning applications. The versatility of honey powder composition extends to nutraceuticals and personal care, where its antioxidant and antimicrobial properties are valued.
- The rise of e-commerce has further amplified market access, allowing niche and premium organic honey powder products to reach a broader audience. However, the industry's reliance on apiculture makes it vulnerable to environmental stressors that affect raw honey processing and supply, creating a persistent challenge for maintaining price stability and consistent quality in food-grade dehydrated honey.
What will be the Size of the Honey Powder Market during the forecast period?
Get Key Insights on Market Forecast (PDF) Get Free Sample
How is the Honey Powder Market Segmented?
The honey powder industry research report provides comprehensive data (region-wise segment analysis), with forecasts and estimates in "USD million" for the period 2025-2029, as well as historical data from 2019-2023 for the following segments.
- Application
- Bakery and confectionery
- Cosmetics
- Others
- Form factor
- Granulated honey
- Powdered honey
- Product
- Organic
- Conventional
- Geography
- North America
- US
- Canada
- Mexico
- APAC
- China
- India
- Japan
- Europe
- Germany
- France
- UK
- South America
- Brazil
- Argentina
- Middle East and Africa
- South Africa
- Saudi Arabia
- UAE
- Rest of World (ROW)
- North America
By Application Insights
The bakery and confectionery segment is estimated to witness significant growth during the forecast period.
The bakery and confectionery segment is a primary application area, driven by consumer demand for healthier, recognizable ingredients, with 51% of consumers actively seeking clean-label foods.
Manufacturers are replacing refined sugars with honey powder, a superior natural food sweetener that serves as a non-sticky baking ingredient and a shelf-life extension agent. Utilizing gentle drying technology in its creation, this dehydrated honey form offers significant operational advantages.
As a free-flowing sweetener agent and natural moisture retainer, it simplifies storage and improves production efficiency.
This ingredient is pivotal for creating products with enhanced texture and a desirable golden hue, meeting the demand for both naturalness and functionality while being a key food preservation agent.
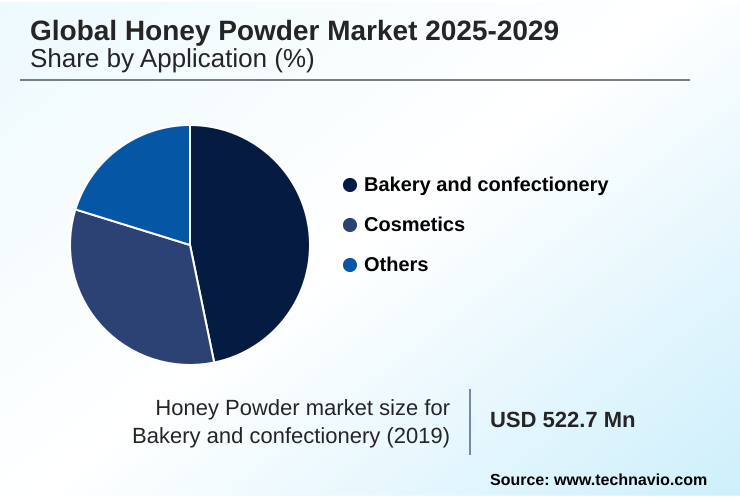
The Bakery and confectionery segment was valued at USD 565.9 million in 2023 and showed a gradual increase during the forecast period.
Regional Analysis
North America is estimated to contribute 47.7% to the growth of the global market during the forecast period.Technavio’s analysts have elaborately explained the regional trends and drivers that shape the market during the forecast period.
See How Honey Powder Market Demand is Rising in North America Get Free Sample
The geographic landscape is led by North America, which is projected to account for 47.7% of the market's incremental growth, fueled by strong consumer demand for natural and clean-label products.
In this region, a significant driver is the widespread adoption of honey powder as an alternative to refined sugar, supported by data showing a majority of consumers prefer recognizable ingredients.
Formulations use it as a honey-based dry seasoning and a key component for dry rubs.
Meanwhile, APAC is emerging as the fastest-growing region, where rising disposable incomes and traditional use of honey in health foods create fertile ground for market expansion.
The demand for honey powder in snack foods and its use as a natural ingredient for health foods are key growth factors, alongside its role as a cosmetic formulation component.
Market Dynamics
Our researchers analyzed the data with 2024 as the base year, along with the key drivers, trends, and challenges. A holistic analysis of drivers will help companies refine their marketing strategies to gain a competitive advantage.
- Manufacturers are increasingly evaluating the benefits of using honey powder in baking mixes and other formulations, weighing factors like the shelf life of dehydrated honey against traditional sweeteners. A key consideration is the comparison of spray-dried honey vs liquid honey, where the former often presents fewer logistical challenges in the commercial production of honey powder.
- For product developers, understanding how to use granulated honey is crucial for achieving desired textures and flavors. This extends to its function as a natural alternative to cane sugar in clean-label foods, where the benefits of organic honey powder provide a significant marketing advantage.
- Technical challenges include preventing caking in honey powder, which is addressed through specific processing techniques and understanding the impact of maltodextrin on honey powder. Its high solubility of honey powder in liquids makes it ideal for beverage formulations. The role of honey powder in nutraceuticals is expanding due to its inherent antimicrobial benefits of honey powder.
- In culinary applications, honey powder for dry meat rubs and using honey powder in seasoning blends are popular uses. For food technologists, improving moisture retention with honey powder can enhance product quality, while the supply chain focuses on sourcing organic raw honey for powder. This holistic approach to honey powder applications in cosmetics and food underscores its versatility.
What are the key market drivers leading to the rise in the adoption of Honey Powder Industry?
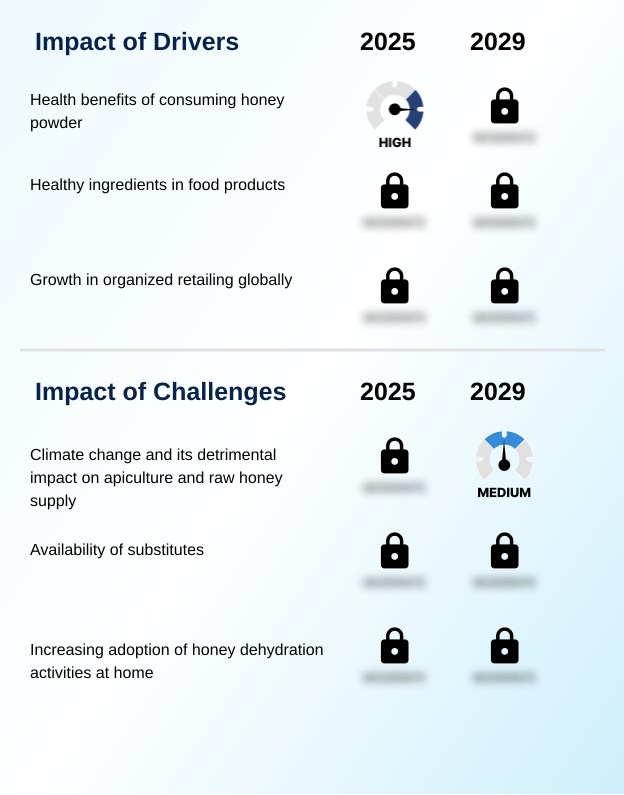
- The key driver for the market is the increasing consumer awareness of the health benefits associated with honey powder consumption.
- The primary market driver is the growing consumer focus on health and wellness, which elevates the status of honey powder for its perceived benefits over processed sugars.
- This demand is met with products like organic honey powder, seen as a premium clean label sweetener. Its use as an ingredient for confectionery and a sweetener for bakery products is expanding as manufacturers reformulate recipes.
- The powdered form serves as an effective natural sweetener for cereals and a key element in personal care products. The dehydrated natural honey format is also incorporated into pet food.
- This trend has led to a notable increase in product launches featuring honey powder, with the natural foods sector seeing a 30% rise in such introductions.
What are the market trends shaping the Honey Powder Industry?
- A significant upcoming market trend is the growing consumer preference for online shopping channels. This shift is reshaping distribution strategies and creating new avenues for market access.
- The market is witnessing a significant trend driven by the expansion of online distribution channels, which enhances accessibility for consumers and broadens market reach for producers. This digital shift facilitates direct comparison and feedback, accelerating the adoption of products like agglomerated honey powder.
- The convenience of e-commerce has fueled sales of this honey flavor in dry form, used as a nutritional supplement ingredient and a sweetener in dairy products. Consumers are increasingly sourcing it online for use as a sweetener for tea mixes and a sugar alternative for diabetics.
- The availability of powdered honey product variants online, offering a honey powder composition that is both functional and natural, supports this growth, with e-commerce platforms reporting a 25% year-over-year increase in searches for natural sweeteners.
What challenges does the Honey Powder Industry face during its growth?
- A key challenge affecting industry growth is the detrimental impact of climate change on apiculture and the subsequent instability in the raw honey supply chain.
- The most significant challenge facing the market is the volatility of the raw honey supply, directly threatened by climate change and its impact on apiculture. This instability affects raw honey processing and the subsequent production of crystallized honey powder.
- The declining bee populations disrupt the supply chain for this natural humectant powder, creating price fluctuations that can increase production costs by up to 18% in a single season. This makes it difficult for manufacturers to consistently source ingredients for honey powder for tea mixes or as a natural ingredient for health foods.
- These environmental pressures threaten the long-term viability and cost-effectiveness of this sugar replacement in recipes, impacting everything from beverage mixes to snack foods.
Exclusive Technavio Analysis on Customer Landscape
The honey powder market forecasting report includes the adoption lifecycle of the market, covering from the innovator’s stage to the laggard’s stage. It focuses on adoption rates in different regions based on penetration. Furthermore, the honey powder market report also includes key purchase criteria and drivers of price sensitivity to help companies evaluate and develop their market growth analysis strategies.
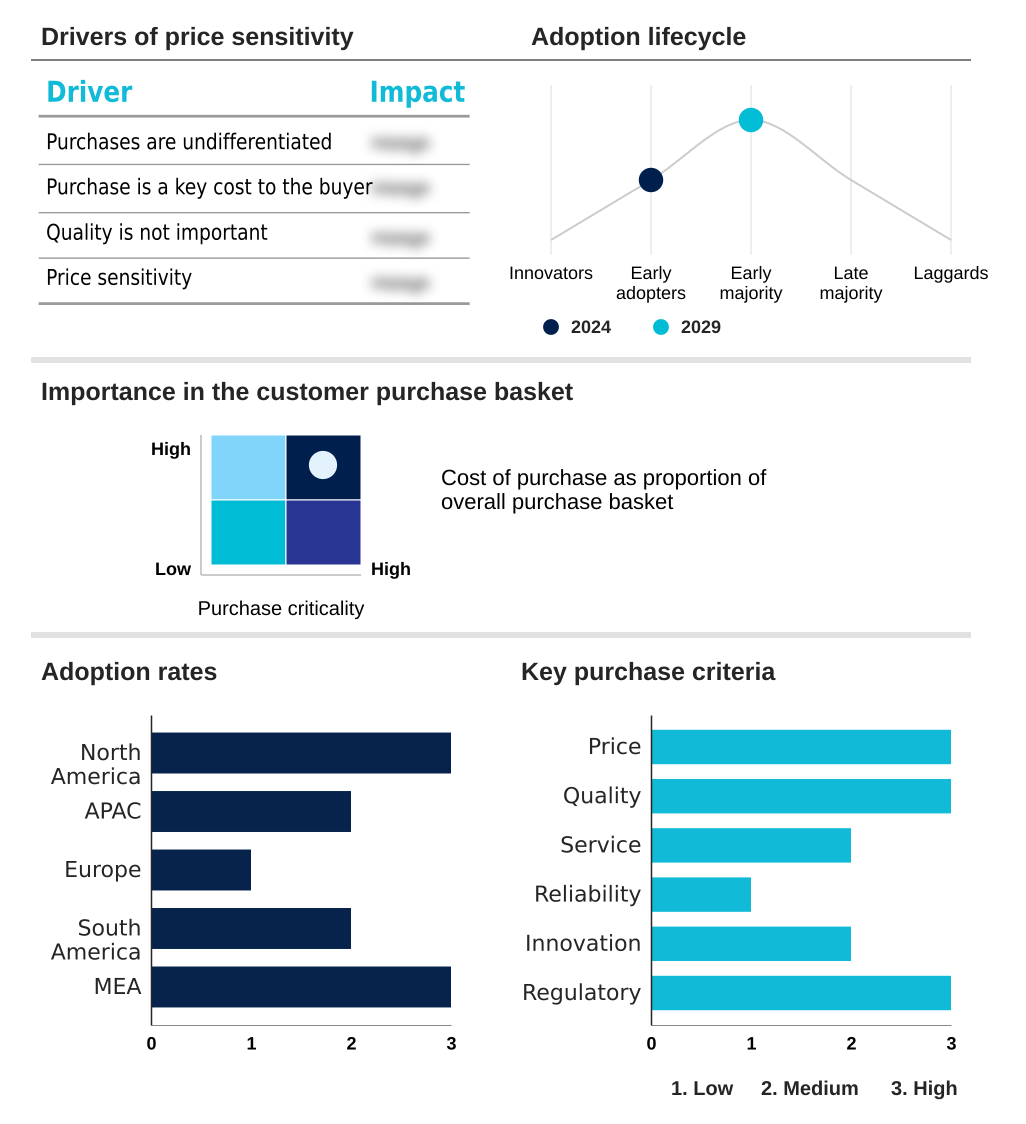
Customer Landscape of Honey Powder Industry
Competitive Landscape
Companies are implementing various strategies, such as strategic alliances, honey powder market forecast, partnerships, mergers and acquisitions, geographical expansion, and product/service launches, to enhance their presence in the industry.
AmTech Ingredients - Offerings encompass organic and conventional honey powders, utilized as a natural sweetener and functional ingredient in bakery, beverage, and seasoning applications to meet clean-label criteria.
The industry research and growth report includes detailed analyses of the competitive landscape of the market and information about key companies, including:
- AmTech Ingredients
- Archer Daniels Midland Co.
- ASR GROUP
- Associated British Foods Plc
- Duke Thomsons India Pvt. Ltd.
- Dutch Gold Honey
- Glorybee Inc.
- Holy Natural
- Kanegrade Ltd.
- Lamex Food Group Ltd.
- McCormick and Co. Inc.
- Mevive Intl. Food Ingredients
- Nature Nates
- Norevo GmbH
- Stakich Inc.
- Venkatesh Natural Extract Pvt. Ltd.
- Vllow Food Products Pvt. Ltd.
- Woodland Foods Ltd.
Qualitative and quantitative analysis of companies has been conducted to help clients understand the wider business environment as well as the strengths and weaknesses of key industry players. Data is qualitatively analyzed to categorize companies as pure play, category-focused, industry-focused, and diversified; it is quantitatively analyzed to categorize companies as dominant, leading, strong, tentative, and weak.
Recent Development and News in Honey powder market
- In March 2025, New Water Capital acquired Dutch Gold Honey, a strategic move aimed at expanding the honey producer's market reach across retail and foodservice channels.
- In February 2025, Archer Daniels Midland Co. announced the launch of a new line of organic, non-GMO honey powders, specifically targeting the clean-label beverage and snack food markets.
- In December 2024, the USDA finalized a new rule to clarify labeling requirements for natural sweeteners, including honey powder, impacting product packaging and marketing claims for manufacturers.
- In October 2024, McCormick and Co. Inc. formed a strategic partnership with a sustainable apiculture cooperative to ensure a traceable and ethically sourced supply of raw honey for its dehydrated seasoning products.
Dive into Technavio’s robust research methodology, blending expert interviews, extensive data synthesis, and validated models for unparalleled Honey Powder Market insights. See full methodology.
| Market Scope | |
|---|---|
| Page number | 278 |
| Base year | 2024 |
| Historic period | 2019-2023 |
| Forecast period | 2025-2029 |
| Growth momentum & CAGR | Accelerate at a CAGR of 4.7% |
| Market growth 2025-2029 | USD 323.7 million |
| Market structure | Fragmented |
| YoY growth 2024-2025(%) | 4.5% |
| Key countries | US, Canada, Mexico, China, India, Japan, South Korea, Australia, Indonesia, Germany, France, UK, Italy, Spain, Russia, Brazil, Argentina, Chile, South Africa, Saudi Arabia, UAE, Egypt and Nigeria |
| Competitive landscape | Leading Companies, Market Positioning of Companies, Competitive Strategies, and Industry Risks |
Research Analyst Overview
- The honey powder market is expanding, driven by its alignment with clean-label and health-centric consumer demands. The utility of dehydrated honey form as a versatile ingredient is critical, serving as a natural food sweetener and an alternative to refined sugar.
- Boardroom decisions are increasingly influenced by regulatory shifts, such as new guidelines on sugar content in institutional foods, which positions honey powder as a strategic compliance tool. For instance, producers using a co-crystallization process with a maltodextrin carrier system can offer a stable, high solubility sweetener.
- Functionally, this free-flowing sweetener agent, which also acts as a natural moisture retainer and food preservation agent, can improve manufacturing efficiency by over 20% compared to viscous liquid alternatives. The adoption of spray-drying technology enables the creation of spray-dried honey granules and fine texture food powder, making it a valuable non-sticky baking ingredient.
- Its inherent antimicrobial food additive and antioxidant-rich ingredient properties also make it a preferred nutraceutical ingredient base and a shelf-life extension agent.
What are the Key Data Covered in this Honey Powder Market Research and Growth Report?
-
What is the expected growth of the Honey Powder Market between 2025 and 2029?
-
USD 323.7 million, at a CAGR of 4.7%
-
-
What segmentation does the market report cover?
-
The report is segmented by Application (Bakery and confectionery, Cosmetics, and Others), Form Factor (Granulated Honey, and Powdered Honey), Product (Organic, and Conventional) and Geography (North America, APAC, Europe, South America, Middle East and Africa)
-
-
Which regions are analyzed in the report?
-
North America, APAC, Europe, South America and Middle East and Africa
-
-
What are the key growth drivers and market challenges?
-
Health benefits of consuming honey powder, Climate change and its detrimental impact on apiculture and raw honey supply
-
-
Who are the major players in the Honey Powder Market?
-
AmTech Ingredients, Archer Daniels Midland Co., ASR GROUP, Associated British Foods Plc, Duke Thomsons India Pvt. Ltd., Dutch Gold Honey, Glorybee Inc., Holy Natural, Kanegrade Ltd., Lamex Food Group Ltd., McCormick and Co. Inc., Mevive Intl. Food Ingredients, Nature Nates, Norevo GmbH, Stakich Inc., Venkatesh Natural Extract Pvt. Ltd., Vllow Food Products Pvt. Ltd. and Woodland Foods Ltd.
-
Market Research Insights
- The market is shaped by a strong preference for clean label food ingredients, driving adoption across multiple sectors. The use of honey powder for baking is expanding as it improves food texture and operational efficiency, reducing mixing times by over 10% compared to liquid alternatives.
- In industrial applications, its use as an ingredient in seasoning blends and a sweetener for beverage mixes provides formulation consistency. The demand for a gluten-free sweetener option and a non-GMO honey ingredient is met by specialized product lines. As a natural food preservative, it can extend product viability by up to 15% in certain applications.
- This functional versatility, from being an additive for skincare to a sweetener for organic products, underscores its growing importance in consumer goods.
We can help! Our analysts can customize this honey powder market research report to meet your requirements.
 RIA -
RIA - 
