In Line Process Viscometer Market Size 2024-2028
The in line process viscometer market size is forecast to increase by USD 68.94 th at a CAGR of 5.8% between 2023 and 2028.
- The market is experiencing significant growth due to the increasing demand for real-time process monitoring in various industries, including food and beverage, pharmaceuticals, and chemicals. This demand is driving the market as companies seek to improve production efficiency and product quality. Furthermore, new product launches in the market are expanding the product portfolio and catering to the diverse needs of customers. However, limitations in measurement accuracy remain a challenge for market players. As process viscometers are used to measure the flowability and consistency of fluids, precise and accurate measurements are crucial to ensure optimal production processes.
- Addressing this challenge through technological advancements and continuous research and development efforts will be essential for market participants to gain a competitive edge. Companies must focus on improving measurement accuracy while maintaining cost-effectiveness to cater to the evolving needs of their customers and sustain growth in the market.
What will be the Size of the In Line Process Viscometer Market during the forecast period?

- The market continues to evolve, driven by the ever-changing dynamics of various industries. Quality assurance is a primary focus, with applications spanning ink manufacturing and chemical processing. Process control, pressure compensation, and regulatory compliance are integral elements, ensuring seamless integration with rheological properties and process validation. Viscosity measurement, cloud connectivity, and predictive analytics are transforming industries, from material science and polymer processing to batch processing and data logging. Advanced control systems, including temperature compensation and sensor calibration, are essential for viscosity control. In-line monitoring and real-time data enable predictive maintenance and process optimization. Safety and reliability are paramount, with continuous processing in the petrochemical industry and system integration crucial for product consistency.
- The food and beverage, paint and coatings, and active pharmaceutical manufacturing sectors also leverage in line process viscometers for quality control and flow rate measurement. The integration of digital twin technology, process simulation, and process stability enhances efficiency improvement and cost reduction. Machine learning and artificial intelligence enable remote monitoring and process automation, further advancing the industry.
How is this In Line Process Viscometer Industry segmented?
The in line process viscometer industry research report provides comprehensive data (region-wise segment analysis), with forecasts and estimates in "USD thousand" for the period 2024-2028, as well as historical data from 2018-2022 for the following segments.
- Technology
- Vibration
- Torsional oscillation
- Moving piston
- Acoustic wave
- Others
- End-user
- Petroleum
- Chemicals
- Pharmaceuticals
- Others
- Geography
- North America
- US
- Europe
- Germany
- UK
- APAC
- China
- India
- Japan
- Rest of World (ROW)
- North America
By Technology Insights
The vibration segment is estimated to witness significant growth during the forecast period.
The market encompasses various industries, including ink manufacturing, chemical processing, and food and beverage, among others. In this market, vibration-based measurement technologies hold significant sway. Vibration-based viscometers are instrumental in monitoring and controlling rheological properties, ensuring product consistency and process stability in real-time. These viscometers play a pivotal role in process integration and optimization, enabling advanced control and predictive maintenance. Vibration-based technologies offer numerous advantages, such as pressure compensation, temperature compensation, and sensor calibration. They contribute to regulatory compliance by ensuring accurate viscosity measurement and data logging. Furthermore, they facilitate process automation and continuous processing, allowing for efficient improvement and cost reduction.
In the petrochemical industry, these viscometers enable process validation and system integration, enhancing safety and reliability. Material science and polymer processing industries benefit from vibration-based viscometers, as they provide in-line monitoring and predictive analytics. These technologies enable process simulation and digital twin development, leading to optimized fluid properties and improved machine learning capabilities. In the pharmaceutical manufacturing sector, they ensure product quality control and process optimization, adhering to stringent regulatory requirements. Cloud connectivity and remote access further expand the potential of vibration-based viscometers, enabling real-time data analysis and predictive maintenance. This technology's integration with digital displays, artificial intelligence, and machine learning enhances its capabilities, providing valuable insights for process control and optimization. Overall, the market is a dynamic and evolving landscape, driven by the need for improved process control, regulatory compliance, and operational efficiency.
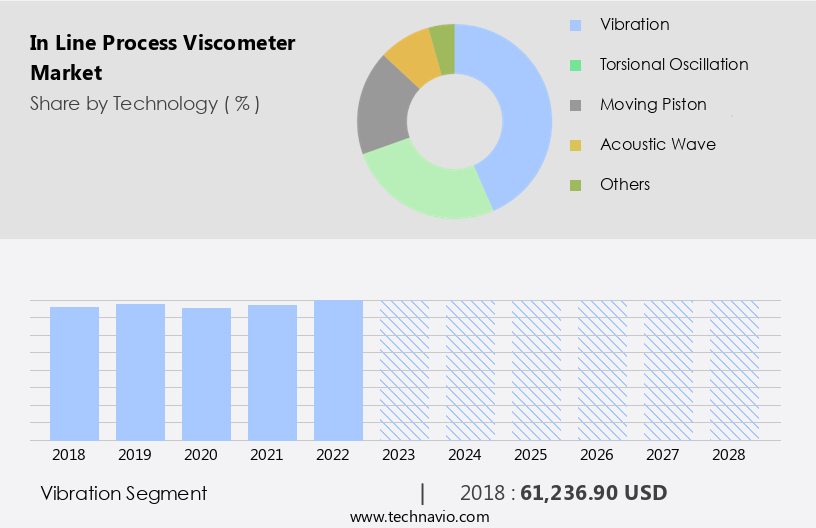
The Vibration segment was valued at USD 61236.90 th in 2018 and showed a gradual increase during the forecast period.
Regional Analysis
APAC is estimated to contribute 50% to the growth of the global market during the forecast period.Technavio's analysts have elaborately explained the regional trends and drivers that shape the market during the forecast period.
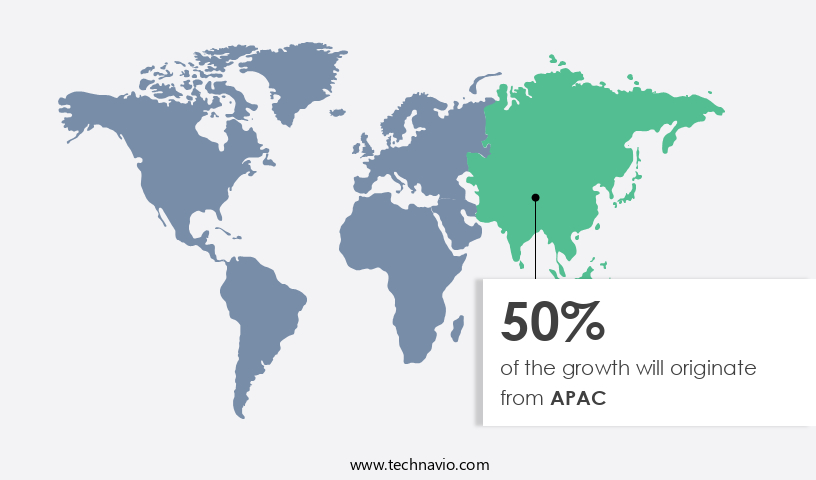
The in line process viscometer (ILPV) market experiences significant activity in the Asia-Pacific (APAC) region, particularly in the petroleum and petrochemical industries. In India, the refining sector's expansion is evident with 23 refineries, eight of which are integrated with petrochemical production, increasing the complexity of refining operations. The Ministry of Petroleum and Natural Gas reported a combined refining capacity of 248.9 million metric tons per annum (MMTPA) as of March 2023. Simultaneously, in China, crude oil processing reached an unprecedented high in 2023, averaging 14.8 million barrels per day (b/d), driven by economic growth and expanding refinery capacity following the COVID-19 pandemic.
In the chemical processing sector, ensuring product consistency and process stability are crucial. ILPVs play a vital role in this regard by providing real-time viscosity measurements and advanced control systems. Regulatory compliance is another significant factor, with ILPVs enabling temperature and pressure compensation to meet industry standards. Material science and polymer processing industries also rely on ILPVs for process optimization, continuous processing, and predictive maintenance. Predictive analytics and machine learning technologies integrated into ILPVs facilitate efficiency improvements and cost reduction. The food and beverage industry utilizes ILPVs for quality control and process automation, ensuring product safety and reliability.
In the paint and coatings sector, ILPVs are essential for flow rate measurement and viscosity control during manufacturing processes. Cloud connectivity and data logging features enable remote access and real-time data analysis, allowing for process optimization and predictive maintenance. Digital twin technology and advanced control systems further enhance the capabilities of ILPVs, providing valuable insights for research and development purposes. In the pharmaceutical manufacturing sector, ILPVs ensure regulatory compliance and process stability, contributing to the production of high-quality medicines. The integration of ILPVs into various industries underlines their importance in maintaining process control, improving efficiency, and ensuring product consistency.
Market Dynamics
Our researchers analyzed the data with 2023 as the base year, along with the key drivers, trends, and challenges. A holistic analysis of drivers will help companies refine their marketing strategies to gain a competitive advantage.
What are the key market drivers leading to the rise in the adoption of In Line Process Viscometer Industry?
- The significant demand for real-time monitoring is the primary catalyst fueling market growth.
- The market is experiencing significant growth due to the increasing demand for real-time process control and quality assurance in manufacturing industries. Ink manufacturing and chemical processing sectors, in particular, rely on these advanced measurement tools to maintain optimal process conditions and ensure product consistency. Robotic systems, which are increasingly being integrated into manufacturing processes, require accurate and timely data to function efficiently. Viscosity measurements, obtained through in line process viscometers, are essential in applications such as mixing, filling, and quality control. These devices provide continuous, real-time data on the viscosity of materials, enabling precise and consistent robotic operations.
- Regulatory compliance is another factor driving the market growth. Strict regulations in industries like pharmaceuticals and food and beverage necessitate stringent process control and quality assurance, making in line process viscometers indispensable. Moreover, the integration of cloud connectivity, predictive analytics, and pressure compensation technologies in ILPVs enhances their capabilities, offering benefits such as remote monitoring, real-time data analysis, and improved process efficiency. In conclusion, the market is poised for continued growth due to its ability to provide real-time, accurate viscosity measurements, ensuring process control, product quality, and regulatory compliance in various industries.
What are the market trends shaping the In Line Process Viscometer Industry?
- The trend in the market is toward new product launches. As a professional, I can provide you with up-to-date information on upcoming product releases.
- The market is experiencing significant growth due to the increasing demand for advanced measurement solutions in material science applications, particularly in polymer processing. This trend is reflected in the recent launch of the INVI viscometer by SOFRASER, which offers instantaneous and continuous measurements of both viscosity and temperature. This device, designed for direct mounting on small, flanged nozzles, facilitates seamless integration into various industrial processes. Its ability to maintain optimal process conditions is essential for ensuring product quality in industries such as food and beverage, paint and coatings, and other chemical processes.
- Sensor technology plays a crucial role in this market, enabling predictive maintenance and advanced control of fluid properties. Data logging is another important feature, allowing for thorough quality control and process optimization. Overall, the market is poised for continued growth as industries seek more efficient and precise methods for measuring and controlling viscosity and temperature.
What challenges does the In Line Process Viscometer Industry face during its growth?
- The limitation in measurement accuracy poses a significant challenge to the industry's growth trajectory. By addressing this issue, industries can enhance their productivity, improve product quality, and ultimately, foster sustainable growth.
- The market encounters substantial challenges in ensuring measurement accuracy, especially when dealing with intricate fluid behaviors. Conventional viscometers, such as rotational, vibrating, and capillary types, can experience performance issues in severe industrial conditions. These devices are susceptible to friction-loaded torque measurements, undefined shear rates, and density dependence, resulting in inaccurate viscosity readings. Furthermore, they exhibit poor sample replacement, limited penetration depth, and sensitivity to pressure, vibration, and flow rate variations, compromising their safety and reliability. A significant challenge arises when measuring thixotropic and shear-thinning fluids, which exhibit viscosity behaviors that fluctuate with shear rate and time. Most in line process viscometers are calibrated to determine an equivalent Newtonian viscosity, which fails to capture the genuine characteristics of non-Newtonian fluids.
- To address these challenges, ongoing research and development efforts focus on improving sensor calibration techniques, temperature compensation, and digital twin technology. Continuous processing applications in the petrochemical industry increasingly demand product consistency and process automation, necessitating real-time data and system integration for optimal performance. By prioritizing these advancements, the market can enhance safety, reliability, and overall efficiency in industrial applications.
Exclusive Customer Landscape
The in line process viscometer market forecasting report includes the adoption lifecycle of the market, covering from the innovator's stage to the laggard's stage. It focuses on adoption rates in different regions based on penetration. Furthermore, the in line process viscometer market report also includes key purchase criteria and drivers of price sensitivity to help companies evaluate and develop their market growth analysis strategies.

Customer Landscape
Key Companies & Market Insights
Companies are implementing various strategies, such as strategic alliances, in line process viscometer market forecast, partnerships, mergers and acquisitions, geographical expansion, and product/service launches, to enhance their presence in the industry.
Aalberts NV - This company introduces the ViscoQuick in-line process viscometer, boasting a compact design with an integrated PC and temperature control system. Engineered for precision and efficiency, the device ensures accurate measurement of fluid viscosity in real-time. Its advanced technology allows for seamless integration into various industrial processes, enhancing productivity and quality control. The system's user-friendly interface simplifies operation, while its robust construction guarantees durability and reliability. By implementing this cutting-edge technology, businesses can optimize their processes, reduce downtime, and improve overall performance.
The industry research and growth report includes detailed analyses of the competitive landscape of the market and information about key companies, including:
- Aalberts NV
- AMETEK Inc.
- Anton Paar GmbH
- BARTEC Top Holding GmbH
- Beacon Industrial Group
- Cambridge Viscosity Inc.
- Emerson Electric Co.
- Endress Hauser Group Services AG
- FUJI ULTRASONIC ENGINEERING Co. Ltd.
- Galvanic Applied Sciences Inc.
- Grace Instrument
- Hydramotion Ltd.
- JAINSONS India Regd.
- Lamy Rheology
- Marimex Industries GmbH & Co
- Rheonics GmbH
- Sofraser
Qualitative and quantitative analysis of companies has been conducted to help clients understand the wider business environment as well as the strengths and weaknesses of key industry players. Data is qualitatively analyzed to categorize companies as pure play, category-focused, industry-focused, and diversified; it is quantitatively analyzed to categorize companies as dominant, leading, strong, tentative, and weak.
Recent Development and News in In Line Process Viscometer Market
- In January 2024, Endress+Hauser, a leading process automation solutions provider, introduced the new Magnetic Viscosity Sensor VTb for their InLineSense product line. This innovation allows for non-contact, continuous measurement of viscosity in various applications, enhancing process efficiency and product quality (Endress+Hauser Press Release, 2024).
- In October 2025, Sensirion AG, a Swiss sensor manufacturer, announced a strategic partnership with Schneider Electric, a global energy management and automation company. This collaboration aims to integrate Sensirion's InLine viscometers into Schneider Electric's process automation solutions, expanding their market reach and offering enhanced process control capabilities (Schneider Electric Press Release, 2025).
- In March 2024, HBM Prenscia, a leading provider of testing, measurement, and sensor technology, completed the acquisition of ViscoTec, a German manufacturer of volumetric and gravimetric dispensing systems. This acquisition significantly expanded HBM Prenscia's portfolio in the field of process viscometry, enabling them to offer comprehensive solutions for various industries (HBM Prenscia Press Release, 2024).
- In July 2025, the European Union's REACH regulation imposed stricter guidelines on the use of certain chemicals in manufacturing processes. This led to increased demand for In Line Process Viscometers, as manufacturers sought to ensure compliance with the new regulations and maintain optimal process control (European Chemicals Agency, 2025).
Research Analyst Overview
The market encompasses a range of technologies used to measure the kinematic viscosity of fluids in industrial processes. Key instruments include process analyzers, falling ball viscometers, capillary viscometers, ultrasonic viscometers, and rotational viscometers. These devices employ various units, such as centistokes (cSt) and poise, to quantify viscosity. Data analytics software and process simulation tools play a crucial role in optimizing viscometer performance and integrating viscosity data into broader process control systems. Sensors, including temperature, pressure, humidity, pH, and conductivity sensors, are also integral to accurate viscosity measurement. Newtonian and non-Newtonian fluids, characterized by their shear rate and shear stress behavior, require specific viscometer calibration standards and viscosity index measurement methods.
The market also leverages advanced technologies like edge computing and cloud platforms for real-time data acquisition and analysis. Process modeling software, industrial cybersecurity, process safety management, and hazard analysis are essential considerations for implementing viscometer systems in industrial applications. Additional tools, such as particle size analyzers and mass spectrometers, further enhance process understanding and ensure viscosity measurement standards are met. Mpa.S and other viscosity measurement units facilitate seamless communication between various process components, enabling efficient and effective industrial operations.
Dive into Technavio's robust research methodology, blending expert interviews, extensive data synthesis, and validated models for unparalleled In Line Process Viscometer Market insights. See full methodology.
|
Market Scope |
|
|
Report Coverage |
Details |
|
Page number |
211 |
|
Base year |
2023 |
|
Historic period |
2018-2022 |
|
Forecast period |
2024-2028 |
|
Growth momentum & CAGR |
Accelerate at a CAGR of 5.8% |
|
Market growth 2024-2028 |
USD 68.94 thousand |
|
Market structure |
Fragmented |
|
YoY growth 2023-2024(%) |
4.5 |
|
Key countries |
China, US, Germany, India, UK, and Japan |
|
Competitive landscape |
Leading Companies, Market Positioning of Companies, Competitive Strategies, and Industry Risks |
What are the Key Data Covered in this In Line Process Viscometer Market Research and Growth Report?
- CAGR of the In Line Process Viscometer industry during the forecast period
- Detailed information on factors that will drive the growth and forecasting between 2024 and 2028
- Precise estimation of the size of the market and its contribution of the industry in focus to the parent market
- Accurate predictions about upcoming growth and trends and changes in consumer behaviour
- Growth of the market across APAC, North America, Europe, Middle East and Africa, and South America
- Thorough analysis of the market's competitive landscape and detailed information about companies
- Comprehensive analysis of factors that will challenge the in line process viscometer market growth of industry companies
We can help! Our analysts can customize this in line process viscometer market research report to meet your requirements.
 RIA -
RIA - 
