Paints And Coatings Market Size 2026-2030
The paints and coatings market size is valued to increase by USD 45.24 billion, at a CAGR of 4.4% from 2025 to 2030. Growth in construction and infrastructure development will drive the paints and coatings market.
Major Market Trends & Insights
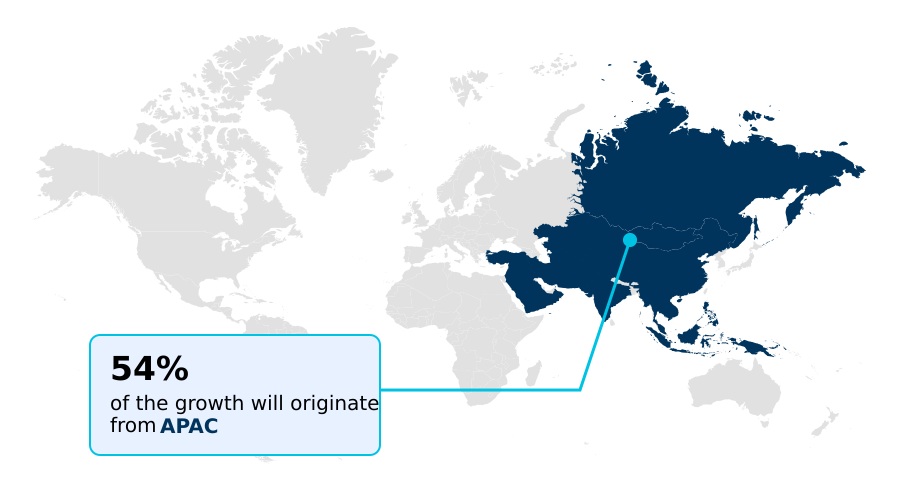
- APAC dominated the market and accounted for a 54.3% growth during the forecast period.
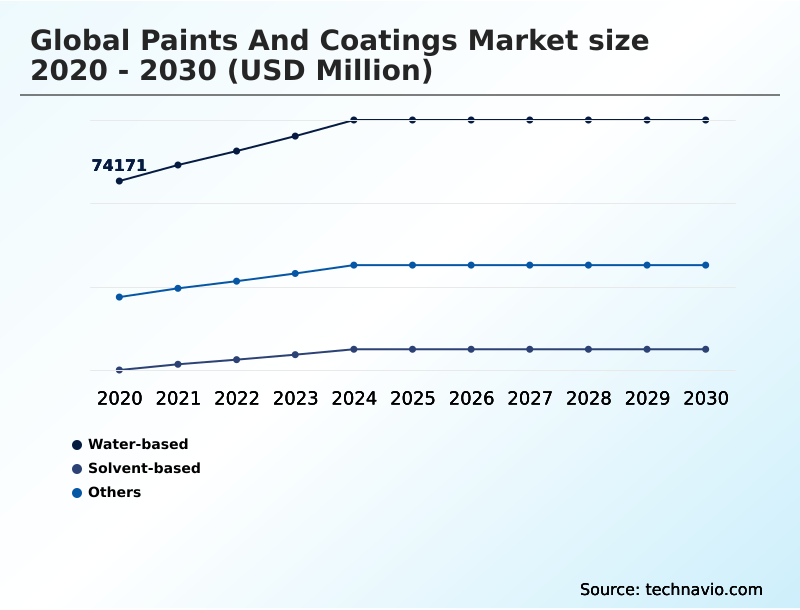
- By Technology - Water-based segment was valued at USD 87.17 billion in 2024
- By Resin Type - Acrylic resins segment accounted for the largest market revenue share in 2024
Market Size & Forecast
- Market Opportunities: USD 76.37 billion
- Market Future Opportunities: USD 45.24 billion
- CAGR from 2025 to 2030 : 4.4%
Market Summary
- The paints and coatings market is characterized by continuous innovation aimed at meeting rigorous performance and environmental standards across diverse sectors. Growth is supported by expanding infrastructure development and a robust automotive industry, which demand solutions that offer superior durability, aesthetic quality, and protection.
- A key trend shaping the industry is the shift toward sustainable products, including waterborne, low-VOC, and bio-based formulations, driven by stringent regulations and growing consumer preference for eco-friendly options. Digitalization is also transforming the sector, with advanced technologies like AI and data analytics optimizing formulation, manufacturing, and quality control.
- For instance, a manufacturer might use a digital platform to simulate coating performance under various environmental stressors, significantly reducing physical testing and accelerating product development. However, the market faces persistent challenges from raw material price volatility and supply chain disruptions, which impact profitability and operational stability.
- In response, companies are focusing on strategic consolidations and portfolio realignments to enhance efficiency, strengthen core competencies, and secure market position. This dynamic landscape fosters a competitive environment where success depends on balancing technological advancement, sustainability, and cost management.
What will be the Size of the Paints And Coatings Market during the forecast period?

Get Key Insights on Market Forecast (PDF) Get Free Sample
How is the Paints And Coatings Market Segmented?
The paints and coatings industry research report provides comprehensive data (region-wise segment analysis), with forecasts and estimates in "USD million" for the period 2026-2030, as well as historical data from 2020-2024 for the following segments.
- Technology
- Water-based
- Solvent-based
- Others
- Resin type
- Acrylic resins
- Epoxy resins
- Polyurethane resins
- Alkyd resins
- Others
- Application
- Architectural
- Industrial
- Automotive and transportation
- Wood
- Others
- Geography
- APAC
- China
- India
- Japan
- Europe
- Germany
- UK
- France
- North America
- US
- Canada
- Mexico
- Middle East and Africa
- Saudi Arabia
- UAE
- South Africa
- South America
- Brazil
- Argentina
- Rest of World (ROW)
- APAC
By Technology Insights
The water-based segment is estimated to witness significant growth during the forecast period.
The water-based segment is evolving as environmental standards and health awareness intensify. This segment is defined by water as the primary carrier for resins and pigments, significantly reducing volatile organic compound emissions.
Architectural coatings are the largest application, where low odor and toxicity are vital for healthy indoor air quality. Industrial coatings are also increasingly adopting this technology to reduce environmental footprints while maintaining high performance.
Advances in polymer chemistry, particularly for waterborne wood coating and decorative paint innovations, have enabled these low-voc formulations to match the durability and substrate adhesion of traditional products.
This shift is supported by innovations in pigment dispersion, which have improved the aesthetic quality of decorative finishes and driven environmental compliance, with some formulations achieving a 95% reduction in harmful emissions.
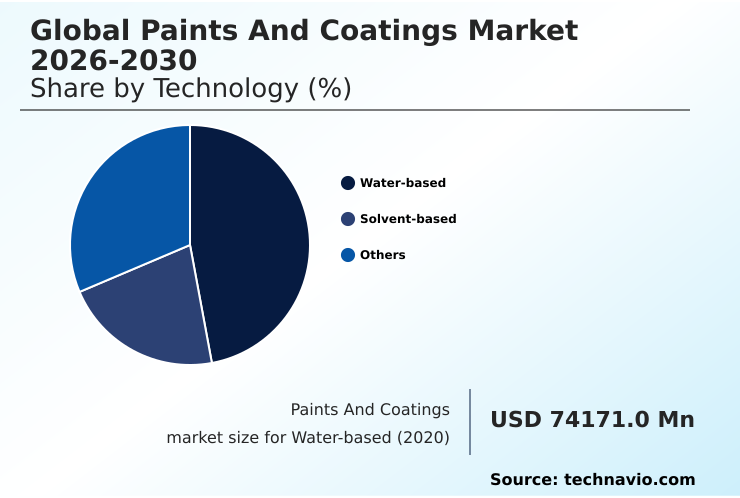
The Water-based segment was valued at USD 87.17 billion in 2024 and showed a gradual increase during the forecast period.
Regional Analysis
APAC is estimated to contribute 54.3% to the growth of the global market during the forecast period.Technavio’s analysts have elaborately explained the regional trends and drivers that shape the market during the forecast period.
See How Paints And Coatings Market Demand is Rising in APAC Get Free Sample
The geographic landscape is led by APAC, which accounts for over 54% of the market's incremental growth, driven by robust infrastructure projects and manufacturing activities. This region shows strong demand for acrylic dispersions and durable wood finishes and lacquers.
In contrast, Europe's mature market prioritizes sustainability, fostering innovation in bio-based coatings and advanced aerospace coatings. North America focuses on high-performance applications, including coatings for electric vehicles, where functional coatings offering thermal management are critical.
The demand for products with high abrasion resistance and longevity is universal.
Specialized materials like silicone resins, fluoropolymers, and vinyl resins are gaining traction for niche applications in extreme environments globally, with advanced formulations improving asset protection by up to 30% in harsh settings.
Market Dynamics
Our researchers analyzed the data with 2025 as the base year, along with the key drivers, trends, and challenges. A holistic analysis of drivers will help companies refine their marketing strategies to gain a competitive advantage.
- The market is witnessing a significant evolution toward specialized, high-performance solutions tailored for specific end-use requirements. The development of low-voc waterborne architectural paints is accelerating, driven by green building standards and the need for healthier indoor environments. In the industrial sector, high-solids epoxy floor coatings are gaining traction for their durability in high-traffic areas.
- The furniture industry is increasingly adopting uv-cured coatings for wood furniture, which offer rapid curing times and a superior finish, improving production efficiency. For the automotive sector, polyurethane automotive clearcoat technology is crucial for protecting vehicles, including electric models, from environmental damage.
- Similarly, the growth in powder coatings for metal substrates reflects a move toward solvent-free industrial coating systems that reduce environmental impact. In harsh environments, anti-corrosion marine protective coatings are essential for asset longevity. Innovation is also prominent in nanotechnology in self-cleaning coatings and thermal insulation coatings for buildings, which enhance functionality and energy efficiency.
- Digital color matching for refinish paints is revolutionizing the repair industry by improving accuracy and reducing waste. Companies are also focused on improving coating transfer efficiency and reducing carbon footprint in coating production to meet sustainability goals.
- The development of smart coatings with sensing capabilities and advanced coatings for electronic devices signifies the industry's expansion into high-tech applications, while antimicrobial coatings for healthcare address growing safety concerns.
- The development of exterior coatings with weather resistance for harsh climatic conditions is also a key area of focus, with some advanced systems demonstrating more than double the lifespan of conventional products.
What are the key market drivers leading to the rise in the adoption of Paints And Coatings Industry?
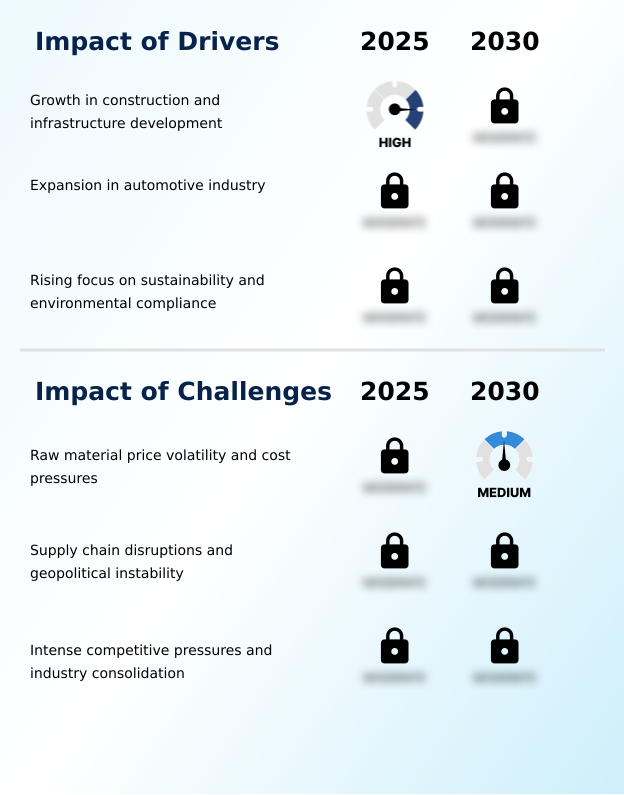
- Growth in construction and infrastructure development is a key driver for the paints and coatings market.
- Market growth is primarily propelled by robust demand from the construction and automotive sectors, where coatings are essential for asset protection and aesthetic appeal.
- In automotive OEM coatings and refinish products, there is a strong need for superior corrosion protection and UV resistance. Advanced film formation technologies ensure a flawless finish while specialty additives enhance performance.
- While traditional solvent-based exterior topcoat systems are still used, the trend is moving toward more sustainable options.
- In industrial applications, marine and protective coatings are critical for safeguarding infrastructure against environmental degradation, with high-performance systems reducing long-term maintenance costs by over 20%.
- This focus on durability and corrosion resistance directly supports the longevity of high-value assets, driving continuous innovation in coating formulations.
What are the market trends shaping the Paints And Coatings Industry?
- The adoption of powder coatings and high-performance technologies is an emerging trend. These advancements are driven by the demand for environmentally friendly and durable solutions.
- Key trends are reshaping the competitive landscape, with a strong emphasis on sustainable and efficient technologies. The adoption of powder coatings production is accelerating, offering a solvent-free alternative that minimizes waste and environmental impact. This trend is complemented by the growing use of high-solids coatings and radiation-cured systems, which enhance production throughput and finish quality.
- Innovations in nanotechnology coatings are creating surfaces with advanced functional properties. The use of high-performance finishes, often based on advanced polyester resins, is extending the lifespan of assets in industrial and architectural settings. Furthermore, digitalization is transforming manufacturing and customer service, with digital paint solutions enabling precise color matching and streamlined coating application technology.
- These integrated systems can improve first-pass yield by up to 15% and reduce setup times by 25%.
What challenges does the Paints And Coatings Industry face during its growth?
- Raw material price volatility and associated cost pressures present a key challenge affecting industry growth.
- The primary challenge confronting the industry is the persistent volatility of coating raw material prices, which directly impacts profitability. Fluctuations in the cost of feedstocks for epoxy resins and alkyd resins create significant margin pressure, compelling manufacturers to optimize formulations and explore alternative materials.
- Ensuring a stable cross-linked network for performance becomes difficult when supply chains for key inputs like aliphatic isocyanates are disrupted. These disruptions, which have increased lead times by up to 50% for some chemicals, complicate production planning and inventory management. Additionally, the complexity of surface preparation and the need for specialized surface treatment chemicals add to operational costs.
- Companies are increasingly focused on sustainable coating formulations and comprehensive coating lifecycle assessment to mitigate these pressures and improve cost predictability.
Exclusive Technavio Analysis on Customer Landscape
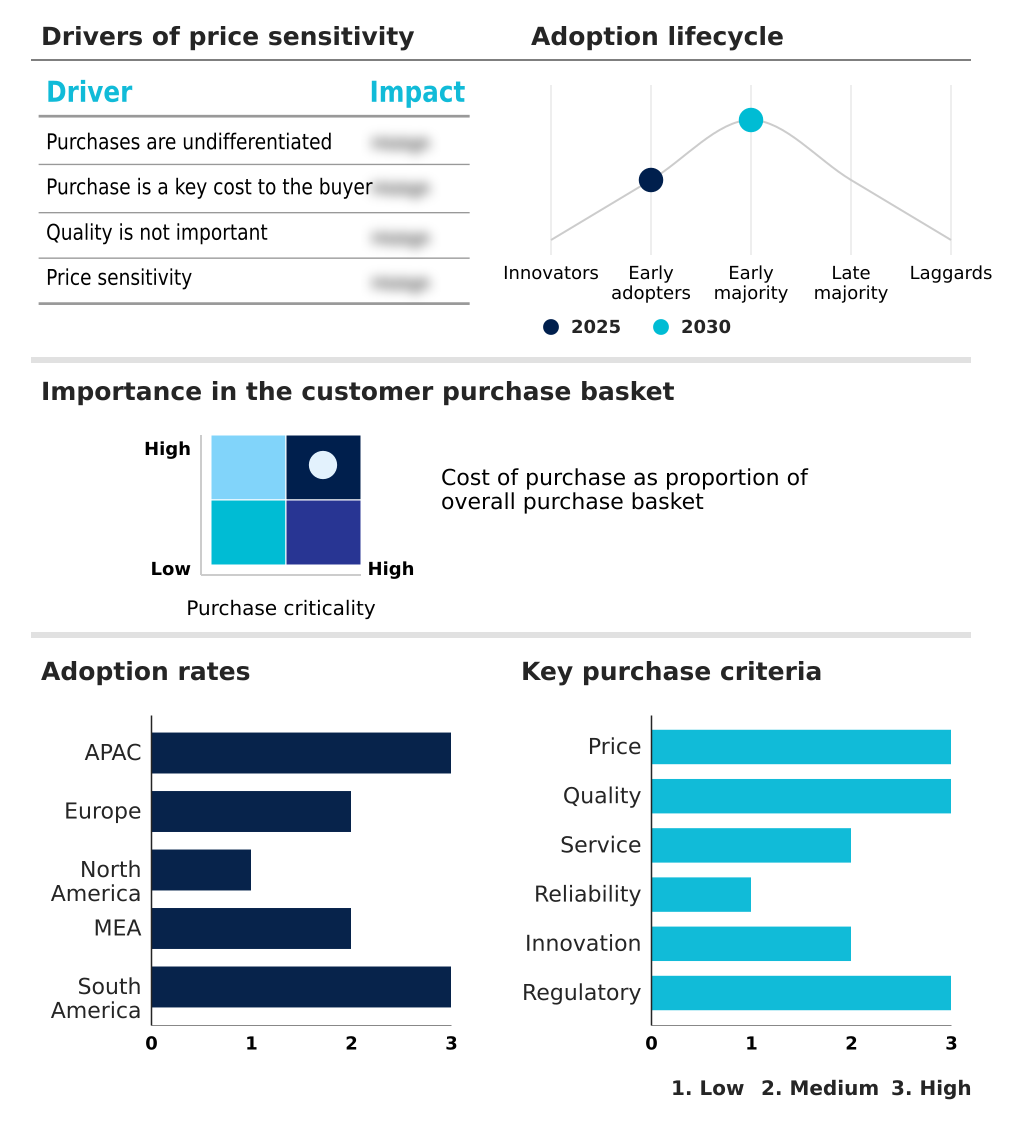
The paints and coatings market forecasting report includes the adoption lifecycle of the market, covering from the innovator’s stage to the laggard’s stage. It focuses on adoption rates in different regions based on penetration. Furthermore, the paints and coatings market report also includes key purchase criteria and drivers of price sensitivity to help companies evaluate and develop their market growth analysis strategies.
Customer Landscape of Paints And Coatings Industry
Competitive Landscape
Companies are implementing various strategies, such as strategic alliances, paints and coatings market forecast, partnerships, mergers and acquisitions, geographical expansion, and product/service launches, to enhance their presence in the industry.
Akzo Nobel NV - Provides advanced decorative, marine, and performance coatings, engineered to enhance surface durability and sustainability across diverse applications.
The industry research and growth report includes detailed analyses of the competitive landscape of the market and information about key companies, including:
- Akzo Nobel NV
- Asian Paints Ltd.
- Axalta Coating Systems Ltd.
- BASF SE
- Beckers Group
- Behr Process LLC
- Benjamin Moore and Co.
- Berger Paints India Ltd.
- Chugoku Marine Paints Ltd.
- DAW SE
- Diamond Vogel
- Hempel AS
- Jotun AS
- Kansai Paint Co. Ltd.
- KCC Co. Ltd.
- Nippon Paint Holdings Co Ltd.
- PPG Industries Inc.
- RPM International Inc.
- Sika AG
- The Sherwin Williams Co.
Qualitative and quantitative analysis of companies has been conducted to help clients understand the wider business environment as well as the strengths and weaknesses of key industry players. Data is qualitatively analyzed to categorize companies as pure play, category-focused, industry-focused, and diversified; it is quantitatively analyzed to categorize companies as dominant, leading, strong, tentative, and weak.
Recent Development and News in Paints and coatings market
- In November 2025, AkzoNobel and Axalta Coating Systems announced an all-stock merger of equals, creating a global entity with enhanced capabilities across powder, refinish, industrial, marine, protective, and decorative coatings.
- In October 2025, BASF entered a binding agreement to divest its automotive original equipment manufacturer, refinish, and surface treatment businesses to private equity firm Carlyle and the Qatar Investment Authority.
- In August 2025, AkzoNobel launched its Interpon D2525 Structura powder coating collection in the South Asian architectural market, offering enhanced durability and textured finishes tailored for regional climate challenges.
- In January 2025, Axalta Coating Systems partnered with Dürr Systems AG to commercialize digital paint solutions, integrating precision application technology with advanced robotics to improve efficiency for automotive OEMs.
Dive into Technavio’s robust research methodology, blending expert interviews, extensive data synthesis, and validated models for unparalleled Paints And Coatings Market insights. See full methodology.
| Market Scope | |
|---|---|
| Page number | 320 |
| Base year | 2025 |
| Historic period | 2020-2024 |
| Forecast period | 2026-2030 |
| Growth momentum & CAGR | Accelerate at a CAGR of 4.4% |
| Market growth 2026-2030 | USD 45239.3 million |
| Market structure | Fragmented |
| YoY growth 2025-2026(%) | 4.0% |
| Key countries | China, India, Japan, South Korea, Australia, Indonesia, Germany, UK, France, Italy, Spain, The Netherlands, US, Canada, Mexico, Saudi Arabia, UAE, South Africa, Turkey, Israel, Brazil, Argentina and Chile |
| Competitive landscape | Leading Companies, Market Positioning of Companies, Competitive Strategies, and Industry Risks |
Research Analyst Overview
- The paints and coatings market is undergoing a fundamental transformation driven by the dual pressures of sustainability and performance. Boardroom decisions are increasingly centered on aligning R&D budgets with the development of low-VOC formulations and bio-based coatings to meet stringent global regulations.
- The integration of nanotechnology coatings is creating surfaces with novel properties, while the demand for superior corrosion protection and abrasion resistance continues to drive innovation in industrial applications. The shift away from traditional solvent-based exterior topcoat systems toward advanced waterborne wood coating alternatives reflects this new paradigm.
- Formulations based on polyurethane topcoats and acrylic dispersions are being refined for better film formation and substrate adhesion. This focus on advanced materials, including polyester resins and specialty additives, is critical for achieving differentiation.
- For instance, firms adopting digital quality control for pigment dispersion report up to a 20% improvement in color consistency, directly impacting brand reputation and reducing rework costs. This strategic pivot requires a holistic approach to innovation, from raw material sourcing to final application.
What are the Key Data Covered in this Paints And Coatings Market Research and Growth Report?
-
What is the expected growth of the Paints And Coatings Market between 2026 and 2030?
-
USD 45.24 billion, at a CAGR of 4.4%
-
-
What segmentation does the market report cover?
-
The report is segmented by Technology (Water-based, Solvent-based, and Others), Resin Type (Acrylic resins, Epoxy resins, Polyurethane resins, Alkyd resins, and Others), Application (Architectural, Industrial, Automotive and transportation, Wood, and Others) and Geography (APAC, Europe, North America, Middle East and Africa, South America)
-
-
Which regions are analyzed in the report?
-
APAC, Europe, North America, Middle East and Africa and South America
-
-
What are the key growth drivers and market challenges?
-
Growth in construction and infrastructure development, Raw material price volatility and cost pressures
-
-
Who are the major players in the Paints And Coatings Market?
-
Akzo Nobel NV, Asian Paints Ltd., Axalta Coating Systems Ltd., BASF SE, Beckers Group, Behr Process LLC, Benjamin Moore and Co., Berger Paints India Ltd., Chugoku Marine Paints Ltd., DAW SE, Diamond Vogel, Hempel AS, Jotun AS, Kansai Paint Co. Ltd., KCC Co. Ltd., Nippon Paint Holdings Co Ltd., PPG Industries Inc., RPM International Inc., Sika AG and The Sherwin Williams Co.
-
Market Research Insights
- Market dynamics are increasingly shaped by the push for sustainable coating formulations and operational efficiency. The integration of digital paint solutions is transforming coating application technology, with some automotive OEM coatings facilities reporting a 15% reduction in material waste.
- As environmental compliance becomes more stringent, the focus on coating lifecycle assessment intensifies, driving demand for high-performance finishes that extend asset protection and reduce maintenance cycles. The emphasis on improved color matching and surface preparation has led to digital tools that enhance accuracy by over 20%.
- This pivot toward smarter, more sustainable systems is evident across architectural, industrial, and marine and protective coatings segments, where performance and regulatory alignment are paramount.
We can help! Our analysts can customize this paints and coatings market research report to meet your requirements.
 RIA -
RIA - 
