Bio-Pharma Market Analysis, Size, and Forecast 2025-2029: North America (US and Canada), Europe (France, Germany, and UK), APAC (China, India, Japan, and South Korea), South America (Brazil), and Rest of World (ROW)

Bio-Pharma Market Analysis, Size, and Forecast 2025-2029:
North America (US and Canada), Europe (France, Germany, and UK), APAC (China, India, Japan, and South Korea), South America (Brazil), and Rest of World (ROW)

Published: Jun 2025 229 Pages SKU: IRTNTR77011

Market Overview at a Glance

$311.8 B
Market Opportunity
9%
CAGR
8.0
YoY growth 2024-2025(%)

Bio-Pharma Market Size 2025-2029

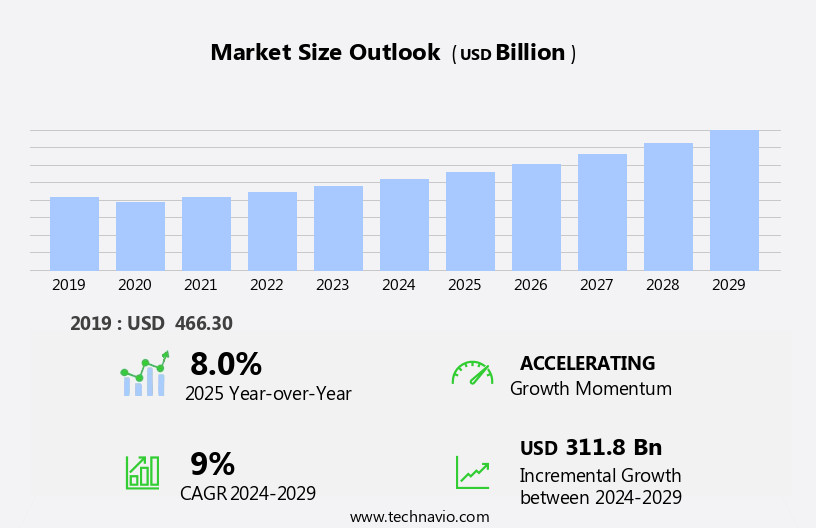
The bio-pharma market size is forecast to increase by USD 311.8 billion at a CAGR of 9% between 2024 and 2029.

  • The market is witnessing significant growth, driven by the increasing prevalence of health disorders and the rise in the production of vaccines. Biopharmaceuticals address a broad spectrum of diseases, such as cancer, diabetes, psoriasis, rheumatoid arthritis, genetic mutations, and various other conditions. The global health landscape is shifting, with an increasing focus on preventive healthcare and the development of innovative treatments. This trend is particularly pronounced in the Bio-Pharma sector, where the production of vaccines and specialized therapies is at an all-time high. However, the market also faces challenges, including the high cost of bio-pharmaceuticals. This cost burden can limit access to essential treatments for many patients, particularly in developing countries.
  • To succeed, they must focus on cost reduction strategies, such as process optimization and supply chain efficiencies, while also investing in research and development to bring innovative, cost-effective treatments to market. By addressing these challenges and leveraging the market's growth drivers, Bio-Pharma companies can position themselves for long-term success. The global population is aging, leading to an increase in chronic diseases such as cancer, type 2 diabetes, and cardiovascular diseases. Companies operating in this space must navigate these challenges while capitalizing on the market's opportunities.

What will be the Size of the Bio-Pharma Market during the forecast period?

Bio-Pharma Market Size

 Explore in-depth regional segment analysis with market size data - historical 2019-2023 and forecasts 2025-2029 - in the full report.  
Request Free Sample

  • The market is experiencing significant trends and potential for growth, driven by the value proposition they offer in terms of cost savings and increased patient access to biologic therapies. The biosimilar market landscape is shaped by various factors, including patent expirations, regulatory approvals, and competition. Biosimilar analytical methods play a crucial role in demonstrating similarity between the reference biologic and the biosimilar, ensuring comparable bioavailability, pharmacodynamics, and pharmacokinetics. Clinical trials are essential to prove biosimilar efficacy, safety, and interchangeability, while regulatory agencies assess the quality attributes and manufacturing capabilities of biosimilars. The biosimilar patent landscape is complex, with numerous patents expiring and new ones being granted, impacting market share and competition.
  • The pricing of biosimilars is a critical consideration, with potential for significant cost savings for healthcare systems and patients. Biosimilar substitution and interchangeability are key aspects of market adoption, with regulatory approvals enabling automatic substitution in some cases. Safety and immunogenicity are essential considerations, as biosimilars may have unique risks compared to their reference biologics. Despite these challenges, the biosimilar market offers significant investment opportunities, as the demand for affordable biologic therapies continues to grow. The regulatory landscape is evolving, with a focus on streamlining approval processes and increasing transparency. Litigation is an ongoing concern, with patent disputes and regulatory challenges impacting market dynamics. The key driver for the market is the production of vaccines, which has gained significant momentum in recent years due to the ongoing COVID-19 pandemic.

How is this Bio-Pharma Industry segmented?

The bio-pharma industry research report provides comprehensive data (region-wise segment analysis), with forecasts and estimates in "USD billion" for the period 2025-2029, as well as historical data from 2019-2023 for the following segments.

  • Product
    • Monoclonal antibodies
    • Recombinant growth factors
    • Vaccines
    • Recombinant hormones
    • Others
  • Application
    • Oncology
    • Autoimmune disorder
    • Metabolic disorder
    • Hormonal disorder
    • Others
  • Drug Class
    • Proprietary biologics
    • Biosimilars
  • Geography
    • North America
      • US
      • Canada
    • Europe
      • France
      • Germany
      • UK
    • APAC
      • China
      • India
      • Japan
      • South Korea
    • South America
      • Brazil
    • Rest of World (ROW)

By Product Insights

The monoclonal antibodies segment is estimated to witness significant growth during the forecast period. Monoclonal antibodies, a segment of high-priced yet life-saving biologic drugs, hold a significant share in the market. Despite having lower sales volumes compared to other pharmaceutical products, the revenues generated from monoclonal antibodies are substantial due to their high price point. This market segment is poised for growth during the forecast period, with numerous companies investing heavily in the research and development of biologic drugs. Monoclonal antibodies represent the largest share among these investments. The bio-pharmaceutical industry is focused on expanding its domain, and this trend is particularly evident in the development of monoclonal antibodies. Contract manufacturing organizations play a crucial role in the production of these complex drugs, ensuring quality and efficiency in the supply chain.

Regulatory compliance is paramount, with market authorization a necessary step for bringing new monoclonal antibodies to market. Clinical trials are essential for testing the safety and efficacy of these drugs, with clinical data management systems facilitating the collection and analysis of critical information. Artificial intelligence and machine learning are revolutionizing the bio-pharma industry, from drug discovery and development to manufacturing and quality control. Precision medicine and personalized treatment plans are increasingly important, requiring advanced data analytics and real-world evidence to inform patient care. Intellectual property protection is essential, with biopharmaceutical patents playing a critical role in ensuring a return on investment for research and development efforts.

Cell therapy, gene therapy, and recombinant proteins are other emerging areas of focus within the bio-pharma industry. The market encompasses a diverse range of therapeutic modalities, including monoclonal antibodies, recombinant growth factors, purified proteins, recombinant enzymes, vaccines, recombinant hormones, cell therapies, gene therapies, synthetic immunomodulators, and various other living organisms derived from bacteria, yeast, and mammalian cells. Downstream processing, drug delivery, and quality assurance are essential components of the manufacturing process, ensuring the production of safe and effective drugs. The biopharmaceutical industry's regulatory landscape is complex, with regulatory compliance a top priority for companies. Pricing strategies are under constant scrutiny, with healthcare systems and patients seeking affordable access to these life-saving treatments. Distribution networks are also critical, ensuring the timely and efficient delivery of these complex drugs to patients.

Bio-Pharma Market Size

 Download Free Sample Report

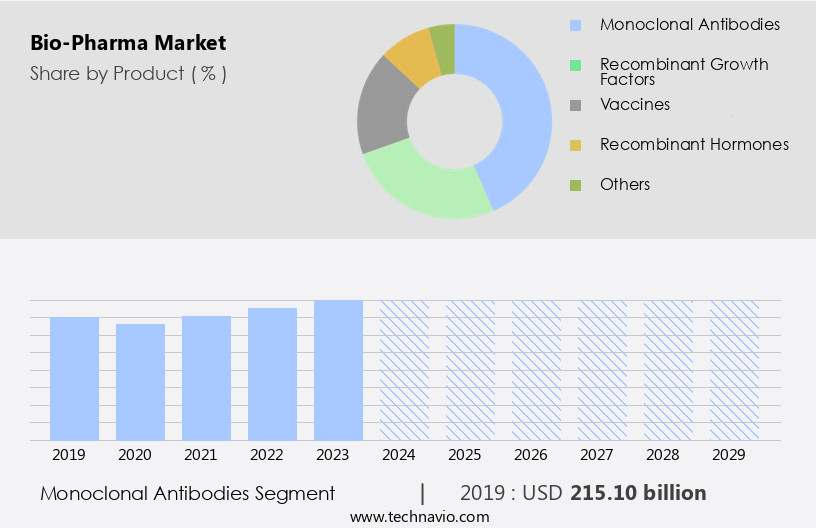
The Monoclonal antibodies segment was valued at USD 215.10 billion in 2019 and showed a gradual increase during the forecast period.

The Bio-Pharma Market is rapidly evolving with increasing focus on biosimilar interchangeability, ensuring seamless substitution without compromising efficacy. Competitive biosimilar pricing and growing biosimilar competition influence biosimilar market share, driving biosimilar adoption and enhancing biosimilar access for patients. The biosimilar regulatory landscape navigates challenges like biosimilar litigation, balancing innovation and compliance. Enhanced biosimilar manufacturing capabilities ensure superior biosimilar quality attributes, reinforcing biosimilar safety and addressing biosimilar immunogenicity concerns. Detailed evaluations of biosimilar pharmacokinetics, biosimilar pharmacodynamics, and biosimilar bioavailability through biosimilar clinical trials improve biosimilar patient outcomes. The biosimilar value proposition strengthens biosimilar market potential, fueling biosimilar growth prospects and attracting biosimilar investment opportunities. Emerging biosimilar market trends define future advancements, ensuring sustainable innovations in bio-pharma.

Regional Analysis

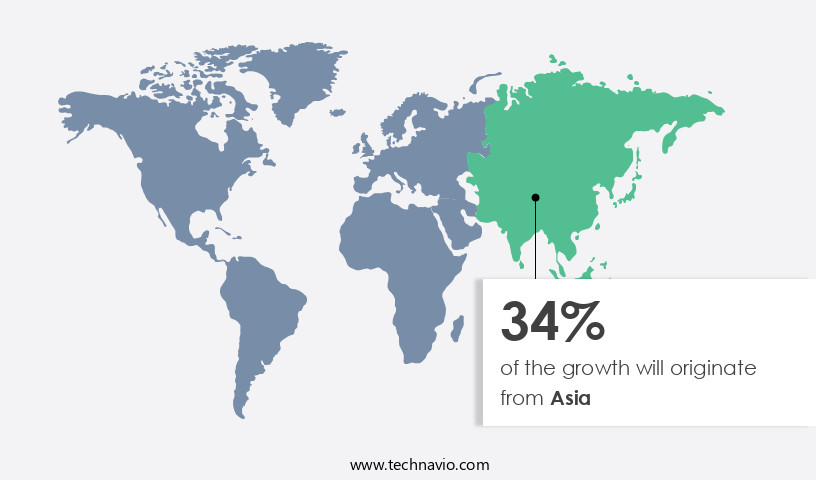
Asia is estimated to contribute 34% to the growth of the global market during the forecast period. Technavio's analysts have elaborately explained the regional trends and drivers that shape the market during the forecast period.

Bio-Pharma Market Share by Geography

View Free PDF Sample

The market in North America experiences significant growth, with the US being a major contributor due to increased investment in treating patients with disorders such as oncology, autoimmune, hormonal, and metabolic conditions. For instance, autoimmune diseases, which affect over 50 million Americans annually, are a leading cause of chronic illness and the second-leading cause of death for women under 65. Despite this, autoimmune diseases remain poorly understood compared to heart disease and cancer. In the bio-pharma industry, supply chain management plays a crucial role in ensuring the timely delivery of high-quality products. Contract manufacturing organizations (CMOs) support pharmaceutical companies in managing their production, reducing costs, and improving efficiency. Biotechnological processes, including high throughput screening, combinatorial chemistry, computational modeling, genomics, next-generation sequencing, and gene editing techniques, have accelerated the discovery and development of new biopharmaceuticals.

Market authorization, a critical process in bringing new drugs to market, is facilitated through rigorous clinical trials. Advancements in technology, such as artificial intelligence (AI) and machine learning, are revolutionizing the industry. AI is used in drug discovery and development, while machine learning aids in data analytics and personalized medicine. Cell therapy, gene therapy, and recombinant proteins are key areas of focus, with downstream and upstream processing essential for their production. Regulatory compliance is a significant challenge, requiring robust quality assurance and quality control processes. Intellectual property protection is essential for biopharmaceutical patents, and pricing strategies must balance affordability with innovation.

Real-world evidence and distribution networks further complicate the market landscape. Biopharmaceutical manufacturing processes involve several stages, including drug development, clinical trials, regulatory approval, and commercialization. Precision medicine and patient access are increasingly important considerations, as treatments are tailored to individual patients. Therapeutic antibodies and drug delivery systems are essential components of these personalized treatments. In the complex and evolving bio-pharma landscape, understanding these trends and patterns is crucial for success. From clinical trials and regulatory compliance to intellectual property and market authorization, the industry requires a multifaceted approach. The integration of AI, cell therapy, and other advanced technologies is transforming the industry, while the focus on personalized medicine and patient access continues to grow.

Market Dynamics

Our researchers analyzed the data with 2024 as the base year, along with the key drivers, trends, and challenges. A holistic analysis of drivers will help companies refine their marketing strategies to gain a competitive advantage.

What are the Bio-Pharma market drivers leading to the rise in the adoption of Industry?

  • The escalating incidence of health disorders serves as the primary catalyst for market growth. The market is witnessing significant growth due to the increasing prevalence of various health disorders, particularly in the areas of oncology, metabolism, hormonal, and autoimmune diseases. According to recent research, nearly 4% of the world's population was affected by over 80 different autoimmune diseases in 2023. These diseases, which include type 1 diabetes, multiple sclerosis, rheumatoid arthritis, lupus, Crohn's disease, psoriasis, and scleroderma, are caused by genetic defects, low immune defense, obesity, and inactivity. The market dynamics are influenced by several factors, including the approval of biosimilars and the increasing focus on supply chain management and contract manufacturing in the healthcare systems.
  • Clinical trials for anticancer drugs and cell therapy are also driving market growth. Moreover, the integration of artificial intelligence (AI) in the Bio-Pharma industry is expected to revolutionize drug discovery and development processes. Effective supply chain management and contract manufacturing are crucial in the Bio-Pharma industry, as they help ensure the timely delivery of high-quality products. The approval of biosimilars, which are less expensive alternatives to original biologic drugs, is also contributing to market growth. Clinical trials for anticancer drugs and cell therapy are ongoing, and the integration of AI in the Bio-Pharma industry is expected to significantly impact drug discovery and development processes.

What are the Bio-Pharma market trends shaping the Industry?

  • The production of vaccines is experiencing a significant increase, representing a notable market trend in the healthcare industry. This upward trend reflects advancements in technology and research, positioning vaccine manufacturing as a key area of growth. The market encompasses various sectors, including cell culture, therapeutic antibodies, drug delivery, clinical data management, intellectual property, pharmaceutical research, and drug discovery. Quality assurance and biosimilar development are crucial aspects of this industry. The market's growth is driven by several factors, such as advancements in technology leading to improved production methods and increased focus on research and development.
  • To address this issue, initiatives like the World Health Organization's National Immunization Program aim to provide vaccinations against diseases and prevent related deaths and disabilities. Enhanced awareness about immunization and technological advancements are expected to fuel market growth in the coming years. Intellectual property protection and regulatory compliance are essential for market entry and sustenance. The global immunization landscape is a significant area of application for the market. Despite the success of vaccines in preventing diseases like diphtheria, Hepatitis B, and measles, around 15%-20% of infants remain unimmunized, leading to unnecessary deaths, primarily in developing regions.

How does Bio-Pharma market face challenges during its growth?

  • The escalating costs of producing bio-pharmaceuticals represent a significant challenge that could potentially hinder the industry's growth trajectory. Bio-pharmaceuticals, which utilize living organisms for the production of therapeutic proteins such as recombinant proteins and monoclonal antibodies, have revolutionized healthcare by offering targeted treatments with minimal side effects for various health conditions, including oncology and autoimmune disorders. However, the high manufacturing costs and clinical trial expenses have resulted in substantial price tags for these therapies, posing a significant challenge to patient access. The production process of bio-pharmaceuticals involves upstream processing, which includes the cultivation of cells, and downstream processing, which involves purification and formulation. Monoclonal antibodies, a type of bio-pharmaceutical, require more complex and expensive production methods than bacterial systems.
  • To address the affordability issue, advancements in technology, such as machine learning and precision medicine, are being integrated into the manufacturing process to improve efficiency and reduce costs. Biopharmaceutical patents play a crucial role in protecting intellectual property and incentivizing innovation. Quality control is a critical aspect of bio-pharmaceutical manufacturing, ensuring the consistency and safety of the final product. The bio-pharmaceutical industry continues to evolve, with a focus on improving production processes, reducing costs, and increasing patient access to these life-changing therapies. The integration of technology and precision medicine, along with robust quality control measures, will contribute to the growth and success of this sector.

Exclusive Customer Landscape

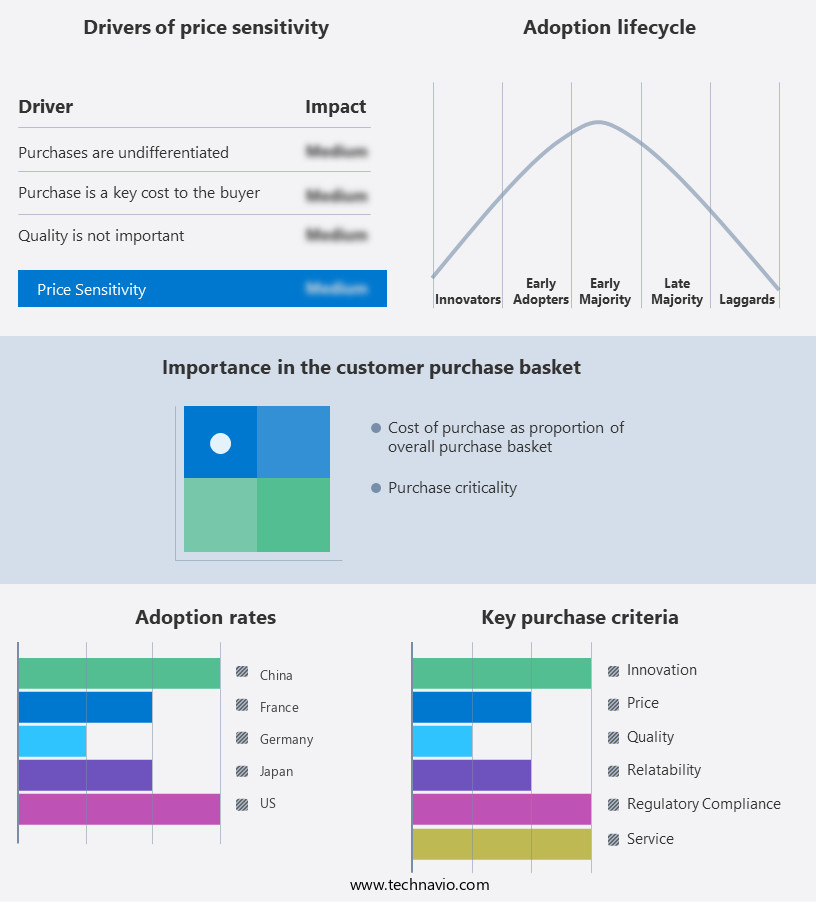
The bio-pharma market forecasting report includes the adoption lifecycle of the market, covering from the innovator's stage to the laggard's stage. It focuses on adoption rates in different regions based on penetration. Furthermore, the bio-pharma market report also includes key purchase criteria and drivers of price sensitivity to help companies evaluate and develop their market growth analysis strategies.

Bio-Pharma Market Share by Geography

 Customer Landscape

Key Companies & Market Insights

Companies are implementing various strategies, such as strategic alliances, bio-pharma market forecast, partnerships, mergers and acquisitions, geographical expansion, and product/service launches, to enhance their presence in the industry.

AbbVie Inc. - The company specializes in the development and commercialization of bio-pharmaceutical products, including Actigall, Actonell, and Acular LS.

The industry research and growth report includes detailed analyses of the competitive landscape of the market and information about key companies, including:

  • AbbVie Inc.
  • Amgen Inc.
  • Angelini S.p.a.
  • Astellas Pharma Inc.
  • AstraZeneca Plc
  • Bayer AG
  • Biogen Inc.
  • Bristol Myers Squibb Co.
  • Eli Lilly and Co.
  • F. Hoffmann La Roche Ltd.
  • Ipsen Pharma
  • Johnson and Johnson Services Inc.
  • Merck KGaA
  • Novartis AG
  • Novo Nordisk AS
  • Pfizer Inc.
  • Sanofi SA
  • Takeda Pharmaceutical Co. Ltd.
  • Vertex Pharmaceuticals Inc.

Qualitative and quantitative analysis of companies has been conducted to help clients understand the wider business environment as well as the strengths and weaknesses of key industry players. Data is qualitatively analyzed to categorize companies as pure play, category-focused, industry-focused, and diversified; it is quantitatively analyzed to categorize companies as dominant, leading, strong, tentative, and weak.

Recent Development and News in Bio-Pharma Market

  • In February 2024, Moderna Therapeutics, a leading mRNA technology company, announced the U.S. Food and Drug Administration (FDA) granted Emergency Use Authorization (EUA) for its Omicron-specific COVID-19 booster, mRNA-1273.529, showcasing the rapid response of the bio-pharma sector to emerging health threats (Moderna Press Release, 2024).
  • In June 2024, Merck KGaA and Pfizer entered into a strategic collaboration to co-develop and commercialize potential oncology therapies, combining their complementary expertise and resources to address unmet patient needs (Merck KGaA Press Release, 2024).
  • In October 2024, the European Investment Bank (EIB) approved a €1.5 billion loan to support the expansion of Novo Nordisk's production capacity for insulin and other diabetes treatments, underscoring the European Union's commitment to strengthening its bio-pharma sector (European Investment Bank Press Release, 2024).
  • In March 2025, Gilead Sciences and Galapagos NV announced the FDA approval of filgotinib for the treatment of rheumatoid arthritis, marking a significant advancement in the development of targeted therapies for autoimmune diseases (Gilead Sciences Press Release, 2025).

Research Analyst Overview

The market continues to evolve, driven by advancements in technology and research across various sectors. Cell culture techniques, such as suspension and adherent, enable the production of therapeutic antibodies and recombinant proteins, including anticancer drugs. Drug delivery systems, from oral to injectable, facilitate patient access to these treatments. Clinical data management ensures regulatory compliance and real-world evidence collection. Intellectual property rights safeguard innovations in pharmaceutical research and drug discovery. Biosimilar development continues to gain momentum, challenging market authorization and pricing strategies. Healthcare systems adapt to personalized and precision medicine, requiring seamless integration of upstream and downstream processing. Quality assurance remains paramount, with machine learning and data analytics enhancing biopharmaceutical manufacturing.

Regulatory bodies and healthcare systems navigate the complexities of biopharmaceutical patents and pricing strategies. Gene therapy and therapeutic antibodies are reshaping the industry, with ongoing clinical trials and regulatory approvals. The biopharmaceutical industry's continuous dynamism underscores the importance of staying informed and adaptive to market activities and evolving patterns. Furthermore, these advanced technologies enable researchers to identify genetic mutations and Biomarkers associated with various diseases, leading to the development of personalized medicines for rare diseases and orphan drugs.

Dive into Technavio's robust research methodology, blending expert interviews, extensive data synthesis, and validated models for unparalleled Bio-Pharma Market insights. See full methodology.

Market Scope

Report Coverage

Details

Page number

229

Base year

2024

Historic period

2019-2023

Forecast period

2025-2029

Growth momentum & CAGR

Accelerate at a CAGR of 9%

Market growth 2025-2029

USD 311.8 billion

Market structure

Fragmented

YoY growth 2024-2025(%)

8.0

Key countries

US, China, Germany, Japan, France, UK, Brazil, Canada, South Korea, and India

Competitive landscape

Leading Companies, Market Positioning of Companies, Competitive Strategies, and Industry Risks

Request Free Sample

What are the Key Data Covered in this Bio-Pharma Market Research and Growth Report?

  • CAGR of the Bio-Pharma industry during the forecast period
  • Detailed information on factors that will drive the growth and forecasting between 2025 and 2029
  • Precise estimation of the size of the market and its contribution of the industry in focus to the parent market
  • Accurate predictions about upcoming growth and trends and changes in consumer behaviour
  • Growth of the market across North America, Europe, Asia, and Rest of World (ROW)
  • Thorough analysis of the market's competitive landscape and detailed information about companies
  • Comprehensive analysis of factors that will challenge the bio-pharma market growth of industry companies

We can help! Our analysts can customize this bio-pharma market research report to meet your requirements.

Get in touch

1 Executive Summary

  • 1.1 Market overview
    • Executive Summary - Chart on Market Overview
    • Executive Summary - Data Table on Market Overview
    • Executive Summary - Chart on Global Market Characteristics
    • Executive Summary - Chart on Market by Geography
    • Executive Summary - Chart on Market Segmentation by Product
    • Executive Summary - Chart on Market Segmentation by Application
    • Executive Summary - Chart on Market Segmentation by Drug Class
    • Executive Summary - Chart on Incremental Growth
    • Executive Summary - Data Table on Incremental Growth
    • Executive Summary - Chart on Company Market Positioning

2 Technavio Analysis

  • 2.1 Analysis of price sensitivity, lifecycle, customer purchase basket, adoption rates, and purchase criteria
    • Analysis of price sensitivity, lifecycle, customer purchase basket, adoption rates, and purchase criteria
  • 2.2 Criticality of inputs and Factors of differentiation
    • Overview on criticality of inputs and factors of differentiation
  • 2.3 Factors of disruption
    • Overview on factors of disruption
  • 2.4 Impact of drivers and challenges
    • Impact of drivers and challenges in 2024 and 2029

3 Market Landscape

  • 3.1 Market ecosystem
    • Parent Market
    • Data Table on - Parent Market
  • 3.2 Market characteristics
    • Market characteristics analysis
  • 3.3 Value chain analysis
    • Value chain analysis

4 Market Sizing

  • 4.1 Market definition
    • Offerings of companies included in the market definition
  • 4.2 Market segment analysis
    • Market segments
  • 4.3 Market size 2024
    • 4.4 Market outlook: Forecast for 2024-2029
      • Chart on Global - Market size and forecast 2024-2029 ($ billion)
      • Data Table on Global - Market size and forecast 2024-2029 ($ billion)
      • Chart on Global Market: Year-over-year growth 2024-2029 (%)
      • Data Table on Global Market: Year-over-year growth 2024-2029 (%)

    5 Historic Market Size

    • 5.1 Global Bio-Pharma Market 2019 - 2023
      • Historic Market Size - Data Table on Global Bio-Pharma Market 2019 - 2023 ($ billion)
    • 5.2 Product segment analysis 2019 - 2023
      • Historic Market Size - Product Segment 2019 - 2023 ($ billion)
    • 5.3 Application segment analysis 2019 - 2023
      • Historic Market Size - Application Segment 2019 - 2023 ($ billion)
    • 5.4 Drug Class segment analysis 2019 - 2023
      • Historic Market Size - Drug Class Segment 2019 - 2023 ($ billion)
    • 5.5 Geography segment analysis 2019 - 2023
      • Historic Market Size - Geography Segment 2019 - 2023 ($ billion)
    • 5.6 Country segment analysis 2019 - 2023
      • Historic Market Size - Country Segment 2019 - 2023 ($ billion)

    6 Qualitative Analysis

    • 6.1 The impact of AI in the global bio-pharma market

      7 Five Forces Analysis

      • 7.1 Five forces summary
        • Five forces analysis - Comparison between 2024 and 2029
      • 7.2 Bargaining power of buyers
        • Bargaining power of buyers - Impact of key factors 2024 and 2029
      • 7.3 Bargaining power of suppliers
        • Bargaining power of suppliers - Impact of key factors in 2024 and 2029
      • 7.4 Threat of new entrants
        • Threat of new entrants - Impact of key factors in 2024 and 2029
      • 7.5 Threat of substitutes
        • Threat of substitutes - Impact of key factors in 2024 and 2029
      • 7.6 Threat of rivalry
        • Threat of rivalry - Impact of key factors in 2024 and 2029
      • 7.7 Market condition
        • Chart on Market condition - Five forces 2024 and 2029

      8 Market Segmentation by Product

      • 8.1 Market segments
        • Chart on Product - Market share 2024-2029 (%)
        • Data Table on Product - Market share 2024-2029 (%)
      • 8.2 Comparison by Product
        • Chart on Comparison by Product
        • Data Table on Comparison by Product
      • 8.3 Monoclonal antibodies - Market size and forecast 2024-2029
        • Chart on Monoclonal antibodies - Market size and forecast 2024-2029 ($ billion)
        • Data Table on Monoclonal antibodies - Market size and forecast 2024-2029 ($ billion)
        • Chart on Monoclonal antibodies - Year-over-year growth 2024-2029 (%)
        • Data Table on Monoclonal antibodies - Year-over-year growth 2024-2029 (%)
      • 8.4 Recombinant growth factors - Market size and forecast 2024-2029
        • Chart on Recombinant growth factors - Market size and forecast 2024-2029 ($ billion)
        • Data Table on Recombinant growth factors - Market size and forecast 2024-2029 ($ billion)
        • Chart on Recombinant growth factors - Year-over-year growth 2024-2029 (%)
        • Data Table on Recombinant growth factors - Year-over-year growth 2024-2029 (%)
      • 8.5 Vaccines - Market size and forecast 2024-2029
        • Chart on Vaccines - Market size and forecast 2024-2029 ($ billion)
        • Data Table on Vaccines - Market size and forecast 2024-2029 ($ billion)
        • Chart on Vaccines - Year-over-year growth 2024-2029 (%)
        • Data Table on Vaccines - Year-over-year growth 2024-2029 (%)
      • 8.6 Recombinant hormones - Market size and forecast 2024-2029
        • Chart on Recombinant hormones - Market size and forecast 2024-2029 ($ billion)
        • Data Table on Recombinant hormones - Market size and forecast 2024-2029 ($ billion)
        • Chart on Recombinant hormones - Year-over-year growth 2024-2029 (%)
        • Data Table on Recombinant hormones - Year-over-year growth 2024-2029 (%)
      • 8.7 Others - Market size and forecast 2024-2029
        • Chart on Others - Market size and forecast 2024-2029 ($ billion)
        • Data Table on Others - Market size and forecast 2024-2029 ($ billion)
        • Chart on Others - Year-over-year growth 2024-2029 (%)
        • Data Table on Others - Year-over-year growth 2024-2029 (%)
      • 8.8 Market opportunity by Product
        • Market opportunity by Product ($ billion)
        • Data Table on Market opportunity by Product ($ billion)

      9 Market Segmentation by Application

      • 9.1 Market segments
        • Chart on Application - Market share 2024-2029 (%)
        • Data Table on Application - Market share 2024-2029 (%)
      • 9.2 Comparison by Application
        • Chart on Comparison by Application
        • Data Table on Comparison by Application
      • 9.3 Oncology - Market size and forecast 2024-2029
        • Chart on Oncology - Market size and forecast 2024-2029 ($ billion)
        • Data Table on Oncology - Market size and forecast 2024-2029 ($ billion)
        • Chart on Oncology - Year-over-year growth 2024-2029 (%)
        • Data Table on Oncology - Year-over-year growth 2024-2029 (%)
      • 9.4 Autoimmune disorder - Market size and forecast 2024-2029
        • Chart on Autoimmune disorder - Market size and forecast 2024-2029 ($ billion)
        • Data Table on Autoimmune disorder - Market size and forecast 2024-2029 ($ billion)
        • Chart on Autoimmune disorder - Year-over-year growth 2024-2029 (%)
        • Data Table on Autoimmune disorder - Year-over-year growth 2024-2029 (%)
      • 9.5 Metabolic disorder - Market size and forecast 2024-2029
        • Chart on Metabolic disorder - Market size and forecast 2024-2029 ($ billion)
        • Data Table on Metabolic disorder - Market size and forecast 2024-2029 ($ billion)
        • Chart on Metabolic disorder - Year-over-year growth 2024-2029 (%)
        • Data Table on Metabolic disorder - Year-over-year growth 2024-2029 (%)
      • 9.6 Hormonal disorder - Market size and forecast 2024-2029
        • Chart on Hormonal disorder - Market size and forecast 2024-2029 ($ billion)
        • Data Table on Hormonal disorder - Market size and forecast 2024-2029 ($ billion)
        • Chart on Hormonal disorder - Year-over-year growth 2024-2029 (%)
        • Data Table on Hormonal disorder - Year-over-year growth 2024-2029 (%)
      • 9.7 Others - Market size and forecast 2024-2029
        • Chart on Others - Market size and forecast 2024-2029 ($ billion)
        • Data Table on Others - Market size and forecast 2024-2029 ($ billion)
        • Chart on Others - Year-over-year growth 2024-2029 (%)
        • Data Table on Others - Year-over-year growth 2024-2029 (%)
      • 9.8 Market opportunity by Application
        • Market opportunity by Application ($ billion)
        • Data Table on Market opportunity by Application ($ billion)

      10 Market Segmentation by Drug Class

      • 10.1 Market segments
        • Chart on Drug Class - Market share 2024-2029 (%)
        • Data Table on Drug Class - Market share 2024-2029 (%)
      • 10.2 Comparison by Drug Class
        • Chart on Comparison by Drug Class
        • Data Table on Comparison by Drug Class
      • 10.3 Proprietary biologics - Market size and forecast 2024-2029
        • Chart on Proprietary biologics - Market size and forecast 2024-2029 ($ billion)
        • Data Table on Proprietary biologics - Market size and forecast 2024-2029 ($ billion)
        • Chart on Proprietary biologics - Year-over-year growth 2024-2029 (%)
        • Data Table on Proprietary biologics - Year-over-year growth 2024-2029 (%)
      • 10.4 Biosimilars - Market size and forecast 2024-2029
        • Chart on Biosimilars - Market size and forecast 2024-2029 ($ billion)
        • Data Table on Biosimilars - Market size and forecast 2024-2029 ($ billion)
        • Chart on Biosimilars - Year-over-year growth 2024-2029 (%)
        • Data Table on Biosimilars - Year-over-year growth 2024-2029 (%)
      • 10.5 Market opportunity by Drug Class
        • Market opportunity by Drug Class ($ billion)
        • Data Table on Market opportunity by Drug Class ($ billion)

      11 Customer Landscape

      • 11.1 Customer landscape overview
        • Analysis of price sensitivity, lifecycle, customer purchase basket, adoption rates, and purchase criteria

      12 Geographic Landscape

      • 12.1 Geographic segmentation
        • Chart on Market share by geography 2024-2029 (%)
        • Data Table on Market share by geography 2024-2029 (%)
      • 12.2 Geographic comparison
        • Chart on Geographic comparison
        • Data Table on Geographic comparison
      • 12.3 North America - Market size and forecast 2024-2029
        • Chart on North America - Market size and forecast 2024-2029 ($ billion)
        • Data Table on North America - Market size and forecast 2024-2029 ($ billion)
        • Chart on North America - Year-over-year growth 2024-2029 (%)
        • Data Table on North America - Year-over-year growth 2024-2029 (%)
      • 12.4 Europe - Market size and forecast 2024-2029
        • Chart on Europe - Market size and forecast 2024-2029 ($ billion)
        • Data Table on Europe - Market size and forecast 2024-2029 ($ billion)
        • Chart on Europe - Year-over-year growth 2024-2029 (%)
        • Data Table on Europe - Year-over-year growth 2024-2029 (%)
      • 12.5 Asia - Market size and forecast 2024-2029
        • Chart on Asia - Market size and forecast 2024-2029 ($ billion)
        • Data Table on Asia - Market size and forecast 2024-2029 ($ billion)
        • Chart on Asia - Year-over-year growth 2024-2029 (%)
        • Data Table on Asia - Year-over-year growth 2024-2029 (%)
      • 12.6 Rest of World (ROW) - Market size and forecast 2024-2029
        • Chart on Rest of World (ROW) - Market size and forecast 2024-2029 ($ billion)
        • Data Table on Rest of World (ROW) - Market size and forecast 2024-2029 ($ billion)
        • Chart on Rest of World (ROW) - Year-over-year growth 2024-2029 (%)
        • Data Table on Rest of World (ROW) - Year-over-year growth 2024-2029 (%)
      • 12.7 US - Market size and forecast 2024-2029
        • Chart on US - Market size and forecast 2024-2029 ($ billion)
        • Data Table on US - Market size and forecast 2024-2029 ($ billion)
        • Chart on US - Year-over-year growth 2024-2029 (%)
        • Data Table on US - Year-over-year growth 2024-2029 (%)
      • 12.8 China - Market size and forecast 2024-2029
        • Chart on China - Market size and forecast 2024-2029 ($ billion)
        • Data Table on China - Market size and forecast 2024-2029 ($ billion)
        • Chart on China - Year-over-year growth 2024-2029 (%)
        • Data Table on China - Year-over-year growth 2024-2029 (%)
      • 12.9 Germany - Market size and forecast 2024-2029
        • Chart on Germany - Market size and forecast 2024-2029 ($ billion)
        • Data Table on Germany - Market size and forecast 2024-2029 ($ billion)
        • Chart on Germany - Year-over-year growth 2024-2029 (%)
        • Data Table on Germany - Year-over-year growth 2024-2029 (%)
      • 12.10 Japan - Market size and forecast 2024-2029
        • Chart on Japan - Market size and forecast 2024-2029 ($ billion)
        • Data Table on Japan - Market size and forecast 2024-2029 ($ billion)
        • Chart on Japan - Year-over-year growth 2024-2029 (%)
        • Data Table on Japan - Year-over-year growth 2024-2029 (%)
      • 12.11 France - Market size and forecast 2024-2029
        • Chart on France - Market size and forecast 2024-2029 ($ billion)
        • Data Table on France - Market size and forecast 2024-2029 ($ billion)
        • Chart on France - Year-over-year growth 2024-2029 (%)
        • Data Table on France - Year-over-year growth 2024-2029 (%)
      • 12.12 Brazil - Market size and forecast 2024-2029
        • Chart on Brazil - Market size and forecast 2024-2029 ($ billion)
        • Data Table on Brazil - Market size and forecast 2024-2029 ($ billion)
        • Chart on Brazil - Year-over-year growth 2024-2029 (%)
        • Data Table on Brazil - Year-over-year growth 2024-2029 (%)
      • 12.13 UK - Market size and forecast 2024-2029
        • Chart on UK - Market size and forecast 2024-2029 ($ billion)
        • Data Table on UK - Market size and forecast 2024-2029 ($ billion)
        • Chart on UK - Year-over-year growth 2024-2029 (%)
        • Data Table on UK - Year-over-year growth 2024-2029 (%)
      • 12.14 Canada - Market size and forecast 2024-2029
        • Chart on Canada - Market size and forecast 2024-2029 ($ billion)
        • Data Table on Canada - Market size and forecast 2024-2029 ($ billion)
        • Chart on Canada - Year-over-year growth 2024-2029 (%)
        • Data Table on Canada - Year-over-year growth 2024-2029 (%)
      • 12.15 India - Market size and forecast 2024-2029
        • Chart on India - Market size and forecast 2024-2029 ($ billion)
        • Data Table on India - Market size and forecast 2024-2029 ($ billion)
        • Chart on India - Year-over-year growth 2024-2029 (%)
        • Data Table on India - Year-over-year growth 2024-2029 (%)
      • 12.16 South Korea - Market size and forecast 2024-2029
        • Chart on South Korea - Market size and forecast 2024-2029 ($ billion)
        • Data Table on South Korea - Market size and forecast 2024-2029 ($ billion)
        • Chart on South Korea - Year-over-year growth 2024-2029 (%)
        • Data Table on South Korea - Year-over-year growth 2024-2029 (%)
      • 12.17 Market opportunity by geography
        • Market opportunity by geography ($ billion)
        • Data Tables on Market opportunity by geography ($ billion)

      13 Drivers, Challenges, and Opportunity/Restraints

      • 13.1 Market drivers
        • 13.2 Market challenges
          • 13.3 Impact of drivers and challenges
            • Impact of drivers and challenges in 2024 and 2029
          • 13.4 Market opportunities/restraints

            14 Competitive Landscape

            • 14.1 Overview
              • 14.2 Competitive Landscape
                • Overview on criticality of inputs and factors of differentiation
              • 14.3 Landscape disruption
                • Overview on factors of disruption
              • 14.4 Industry risks
                • Impact of key risks on business

              15 Competitive Analysis

              • 15.1 Companies profiled
                • Companies covered
              • 15.2 Company ranking index
                • Company ranking index
              • 15.3 Market positioning of companies
                • Matrix on companies position and classification
              • 15.4 AbbVie Inc.
                • AbbVie Inc. - Overview
                • AbbVie Inc. - Product / Service
                • AbbVie Inc. - Key news
                • AbbVie Inc. - Key offerings
                • SWOT
              • 15.5 Amgen Inc.
                • Amgen Inc. - Overview
                • Amgen Inc. - Product / Service
                • Amgen Inc. - Key news
                • Amgen Inc. - Key offerings
                • SWOT
              • 15.6 Astellas Pharma Inc.
                • Astellas Pharma Inc. - Overview
                • Astellas Pharma Inc. - Product / Service
                • Astellas Pharma Inc. - Key offerings
                • SWOT
              • 15.7 AstraZeneca Plc
                • AstraZeneca Plc - Overview
                • AstraZeneca Plc - Product / Service
                • AstraZeneca Plc - Key news
                • AstraZeneca Plc - Key offerings
                • SWOT
              • 15.8 Bayer AG
                • Bayer AG - Overview
                • Bayer AG - Business segments
                • Bayer AG - Key news
                • Bayer AG - Key offerings
                • Bayer AG - Segment focus
                • SWOT
              • 15.9 Biogen Inc.
                • Biogen Inc. - Overview
                • Biogen Inc. - Product / Service
                • Biogen Inc. - Key offerings
                • SWOT
              • 15.10 Bristol Myers Squibb Co.
                • Bristol Myers Squibb Co. - Overview
                • Bristol Myers Squibb Co. - Product / Service
                • Bristol Myers Squibb Co. - Key news
                • Bristol Myers Squibb Co. - Key offerings
                • SWOT
              • 15.11 Eli Lilly and Co.
                • Eli Lilly and Co. - Overview
                • Eli Lilly and Co. - Product / Service
                • Eli Lilly and Co. - Key offerings
                • SWOT
              • 15.12 F. Hoffmann La Roche Ltd.
                • F. Hoffmann La Roche Ltd. - Overview
                • F. Hoffmann La Roche Ltd. - Business segments
                • F. Hoffmann La Roche Ltd. - Key news
                • F. Hoffmann La Roche Ltd. - Key offerings
                • F. Hoffmann La Roche Ltd. - Segment focus
                • SWOT
              • 15.13 Johnson and Johnson Services Inc.
                • Johnson and Johnson Services Inc. - Overview
                • Johnson and Johnson Services Inc. - Business segments
                • Johnson and Johnson Services Inc. - Key news
                • Johnson and Johnson Services Inc. - Key offerings
                • Johnson and Johnson Services Inc. - Segment focus
                • SWOT
              • 15.14 Novartis AG
                • Novartis AG - Overview
                • Novartis AG - Business segments
                • Novartis AG - Key news
                • Novartis AG - Key offerings
                • Novartis AG - Segment focus
                • SWOT
              • 15.15 Novo Nordisk AS
                • Novo Nordisk AS - Overview
                • Novo Nordisk AS - Business segments
                • Novo Nordisk AS - Key offerings
                • Novo Nordisk AS - Segment focus
                • SWOT
              • 15.16 Pfizer Inc.
                • Pfizer Inc. - Overview
                • Pfizer Inc. - Product / Service
                • Pfizer Inc. - Key news
                • Pfizer Inc. - Key offerings
                • SWOT
              • 15.17 Sanofi SA
                • Sanofi SA - Overview
                • Sanofi SA - Business segments
                • Sanofi SA - Key news
                • Sanofi SA - Key offerings
                • Sanofi SA - Segment focus
                • SWOT
              • 15.18 Takeda Pharmaceutical Co. Ltd.
                • Takeda Pharmaceutical Co. Ltd. - Overview
                • Takeda Pharmaceutical Co. Ltd. - Product / Service
                • Takeda Pharmaceutical Co. Ltd. - Key news
                • Takeda Pharmaceutical Co. Ltd. - Key offerings
                • SWOT

              16 Appendix

              • 16.1 Scope of the report
                • 16.2 Inclusions and exclusions checklist
                  • Inclusions checklist
                  • Exclusions checklist
                • 16.3 Currency conversion rates for US$
                  • Currency conversion rates for US$
                • 16.4 Research methodology
                  • Research methodology
                • 16.5 Data procurement
                  • Information sources
                • 16.6 Data validation
                  • Data validation
                • 16.7 Validation techniques employed for market sizing
                  • Validation techniques employed for market sizing
                • 16.8 Data synthesis
                  • Data synthesis
                • 16.9 360 degree market analysis
                  • 360 degree market analysis
                • 16.10 List of abbreviations
                  • List of abbreviations

                Research Methodology

                Technavio presents a detailed picture of the market by way of study, synthesis, and summation of data from multiple sources. The analysts have presented the various facets of the market with a particular focus on identifying the key industry influencers. The data thus presented is comprehensive, reliable, and the result of extensive research, both primary and secondary.

                INFORMATION SOURCES

                Primary sources

                • Manufacturers and suppliers
                • Channel partners
                • Industry experts
                • Strategic decision makers

                Secondary sources

                • Industry journals and periodicals
                • Government data
                • Financial reports of key industry players
                • Historical data
                • Press releases

                DATA ANALYSIS

                Data Synthesis

                • Collation of data
                • Estimation of key figures
                • Analysis of derived insights

                Data Validation

                • Triangulation with data models
                • Reference against proprietary databases
                • Corroboration with industry experts

                REPORT WRITING

                Qualitative

                • Market drivers
                • Market challenges
                • Market trends
                • Five forces analysis

                Quantitative

                • Market size and forecast
                • Market segmentation
                • Geographical insights
                • Competitive landscape

                Interested in this report?

                Get your sample now to see our research methodology and insights!

                Download Now

                Frequently Asked Questions

                Bio-Pharma market growth will increase by $ 311.8 bn during 2025-2029 .

                The Bio-Pharma market is expected to grow at a CAGR of 9% during 2025-2029 .

                Bio-Pharma market is segmented by Product( Monoclonal antibodies, Recombinant growth factors, Vaccines, Recombinant hormones, Others) Application( Oncology, Autoimmune disorder, Metabolic disorder, Hormonal disorder, Others) Drug Class( Proprietary biologics, Biosimilars, Asia, Rest of World (ROW))

                AbbVie Inc., Amgen Inc., Angelini S.p.a., Astellas Pharma Inc., AstraZeneca Plc, Bayer AG, Biogen Inc., Bristol Myers Squibb Co., Eli Lilly and Co., F. Hoffmann La Roche Ltd., Ipsen Pharma, Johnson and Johnson Services Inc., Merck KGaA, Novartis AG, Novo Nordisk AS, Pfizer Inc., Sanofi SA, Takeda Pharmaceutical Co. Ltd., Vertex Pharmaceuticals Inc. are a few of the key vendors in the Bio-Pharma market.

                Asia will register the highest growth rate of 34% among the other regions. Therefore, the Bio-Pharma market in Asia is expected to garner significant business opportunities for the vendors during the forecast period.

                US, China, Germany, Japan, France, UK, Brazil, Canada, South Korea, India

                • Increasing prevalence of health disordersThe prevalence of health disorders is the driving factor this market.
                • including oncology is the driving factor this market.
                • metabolism is the driving factor this market.
                • hormonal is the driving factor this market.
                • and autoimmune is the driving factor this market.
                • is significantly increasing worldwide. For instance is the driving factor this market.
                • in 2023 is the driving factor this market.
                • nearly 4% of the worlds population was affected by one of more than 80 different autoimmune diseases is the driving factor this market.
                • the most common of which include type 1 diabetes is the driving factor this market.
                • multiple sclerosis is the driving factor this market.
                • rheumatoid arthritis is the driving factor this market.
                • lupus is the driving factor this market.
                • Crohns disease is the driving factor this market.
                • psoriasis is the driving factor this market.
                • and scleroderma is the driving factor this market.
                • according to National Stem Cell Foundation. These are caused due to genetic defects is the driving factor this market.
                • low immune defense is the driving factor this market.
                • overweight is the driving factor this market.
                • obesity and inactivity. The prevalence rate of health disorders is higher in people with diabetes mellitus is the driving factor this market.
                • obesity is the driving factor this market.
                • high blood pressure is the driving factor this market.
                • hypertension is the driving factor this market.
                • and people addicted to smoking; the number of such people is also increasing significantly. The increasing prevalence of health disorders will increase demand for such treatment is the driving factor this market.
                • which is the driving factor this market.
                • in turn is the driving factor this market.
                • is anticipated to increase the adoption of bio-pharmaceuticals is the driving factor this market.
                • which will thereby drive the growth of the global bio-pharma market during the forecast period. is the driving factor this market.

                The Bio-Pharma market vendors should focus on grabbing business opportunities from the Monoclonal antibodies segment as it accounted for the largest market share in the base year.