Industrial Boiler Market Analysis, Size, and Forecast 2026-2030: APAC (China, India, and Japan), Europe (Germany, UK, and France), North America (US, Canada, and Mexico), Middle East and Africa (Saudi Arabia, UAE, and South Africa), South America (Brazil, Argentina, and Chile), and Rest of World (ROW)

Industrial Boiler Market Analysis, Size, and Forecast 2026-2030:
APAC (China, India, and Japan), Europe (Germany, UK, and France), North America (US, Canada, and Mexico), Middle East and Africa (Saudi Arabia, UAE, and South Africa), South America (Brazil, Argentina, and Chile), and Rest of World (ROW)

Published: May 2026 328 Pages SKU: IRTNTR70192

Market Overview at a Glance

$3.30 B
Market Opportunity
3.6%
CAGR 2025 - 2030
39.8%
APAC Growth
$5.60 B
Gas fired boiler segment 2024

Industrial Boiler Market Size 2026-2030

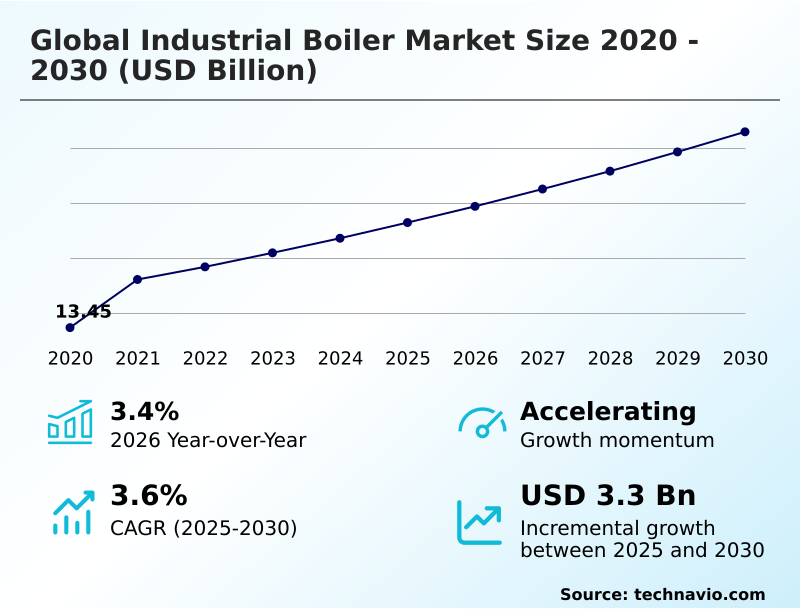
The industrial boiler market size is valued to increase by USD 3.30 billion, at a CAGR of 3.6% from 2025 to 2030. Global industrialization and capacity expansion in energy-intensive sectors will drive the industrial boiler market.

Major Market Trends & Insights

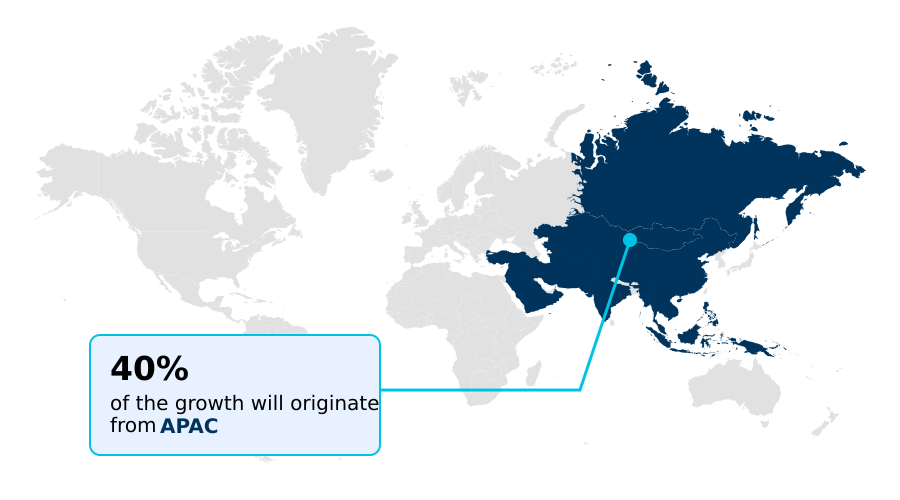
  • APAC dominated the market and accounted for a 39.8% growth during the forecast period.
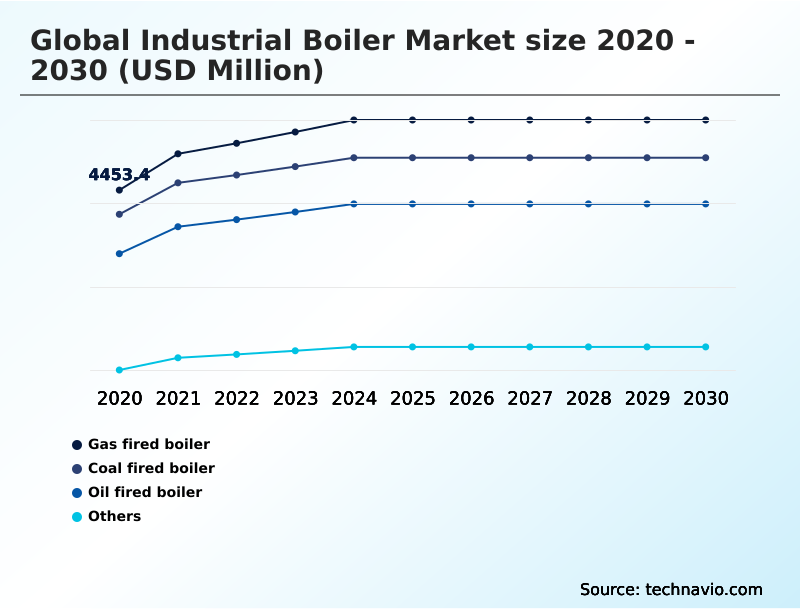
  • By Source - Gas fired boiler segment was valued at USD 5.60 billion in 2024
  • By End-user - Chemicals and petrochemicals segment accounted for the largest market revenue share in 2024

Market Size & Forecast

  • Market Opportunities: USD 7.12 billion
  • Market Future Opportunities: USD 3.30 billion
  • CAGR from 2025 to 2030 : 3.6%

Market Summary

  • The Industrial Boiler Market exhibits robust demand driven by the continuous expansion of heavy manufacturing and the modernization of thermal energy generation infrastructure. Heavy industries increasingly rely on continuous, high-pressure steam for core operational processes, directly accelerating the replacement of structurally degraded units.
  • For instance, in chemical manufacturing, facility operators are replacing legacy systems with modern multi pass configurations and digital monitoring interfaces, which has successfully reduced total energy use by 12% during peak production cycles. The overarching drive toward localized captive power generation acts as a primary catalyst, allowing facilities to maintain uninterrupted operations and secure energy independence.
  • Conversely, the market faces significant hurdles due to the high capital expenditures required for engineering validation and site modification. These financial constraints frequently force mid-sized enterprises to prolong the lifespan of inefficient legacy machinery, thereby delaying comprehensive infrastructural upgrades.
  • As international environmental standards evolve, the integration of advanced emission control technologies remains essential for maintaining strict regulatory compliance across the dynamic industrial landscape.

What will be the Size of the Industrial Boiler Market during the forecast period?

Get Key Insights on Market Forecast (PDF) Get Free Sample

How is the Industrial Boiler Market Segmented?

The industrial boiler industry research report provides comprehensive data (region-wise segment analysis), with forecasts and estimates in "USD million" for the period 2026-2030, as well as historical data from 2020-2024 for the following segments.

  • Source
    • Gas fired boiler
    • Coal fired boiler
    • Oil fired boiler
    • Others
  • End-user
    • Chemicals and petrochemicals
    • Food processing
    • Paper and pulp
    • Power generation
    • Others
  • Type
    • Fire-tube boilers
    • Water-tube boilers
  • Power rating
    • 10-150 BHP
    • 51-300 BHP
    • 301-600 BHP
  • Geography
    • APAC
      • China
      • India
      • Japan
      • South Korea
      • Australia
      • Indonesia
    • Europe
      • Germany
      • UK
      • France
      • Italy
      • Spain
      • The Netherlands
    • North America
      • US
      • Canada
      • Mexico
    • Middle East and Africa
      • Saudi Arabia
      • UAE
      • South Africa
      • Egypt
    • South America
      • Brazil
      • Argentina
      • Chile

By Source Insights

The gas fired boiler segment is estimated to witness significant growth during the forecast period.

The gas fired boiler segment functions as a critical asset within the Industrial Boiler sector, delivering rapid thermal energy generation and precise temperature modulation for complex manufacturing processes.

Unlike solid fuel alternatives, gas fired systems offer a superior combustion profile, significantly reducing the necessity for extensive emission control add-ons like electrostatic precipitators or flue gas desulfurization units.

This streamlined operational footprint enables facilities to lower their maintenance costs and extend mechanical lifespans.

Modern gas fired units are increasingly integrated with digital twin technology and advanced predictive maintenance protocols, a shift that has improved overall thermal efficiency by 18% in monitored installations.

By relying on established pipeline infrastructure rather than on-site storage, facility managers secure continuous steam production, thereby minimizing unplanned downtime and maximizing the financial return on high-capacity thermal investments.

Get Free Sample

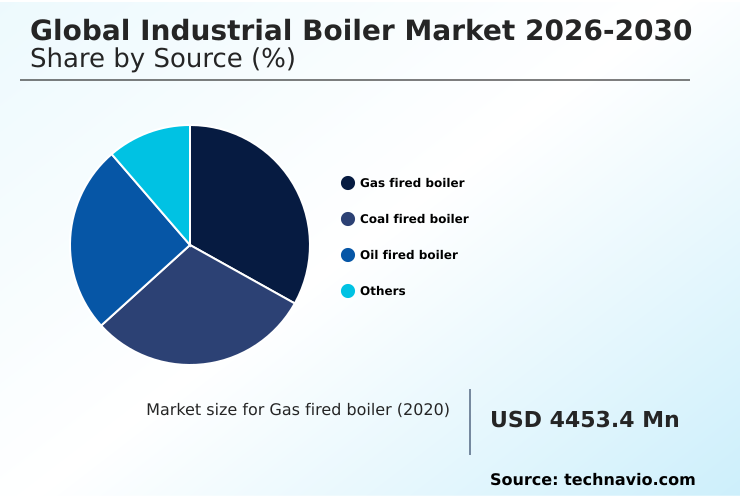
The Gas fired boiler segment was valued at USD 5.60 billion in 2024 and showed a gradual increase during the forecast period.

Get Free Sample

Regional Analysis

APAC is estimated to contribute 39.8% to the growth of the global market during the forecast period.Technavio’s analysts have elaborately explained the regional trends and drivers that shape the market during the forecast period.

See How Industrial Boiler Market Demand is Rising in APAC Get Free Sample

The geographic landscape of the Global Industrial Boiler Market 2026-2030 highlights a stark contrast in technological adoption between the APAC and Europe regions.

In Europe, strict decarbonization mandates have accelerated the transition toward hydrogen ready industrial boilers and high-capacity electric boilers, resulting in a 25% reduction in localized carbon emissions for compliant chemical facilities.

Conversely, rapid manufacturing expansion in APAC drives the aggressive deployment of autonomous multi fuel systems, which provides crucial operational flexibility in areas with fluctuating fuel availability.

Integrating the internet of things and artificial intelligence algorithms into thermal infrastructure has improved overall combustion efficiency by 18% in modernized European plants compared to legacy setups in developing zones.

These distinct regional strategies demonstrate how facility managers adapt their procurement protocols to overcome specific supply chain constraints and localized environmental regulations.

Market Dynamics

Our researchers analyzed the data with 2025 as the base year, along with the key drivers, trends, and challenges. A holistic analysis of drivers will help companies refine their marketing strategies to gain a competitive advantage.

  • The continuous evolution of the Global Industrial Boiler Market 2026-2030 is fundamentally shaped by shifting regulatory frameworks and the increasing need for operational self-sufficiency across heavy industries. To meet stringent environmental mandates, facility managers are investing heavily in advanced industrial boiler emission control systems, which effectively neutralize airborne pollutants before they exit the exhaust stack.
  • Simultaneously, regions with abundant agricultural residues are seeing a massive transition toward biomass fired thermal generation equipment, allowing agricultural and paper processing plants to convert organic waste into usable energy. This localized approach has effectively decreased reliance on imported fossil fuels by nearly 30% for participating rural cooperatives.
  • Furthermore, as major industrial conglomerates aggressively pursue zero-carbon initiatives, the procurement of hydrogen ready thermal energy solutions has become a strategic priority, ensuring long-term compliance without sacrificing thermal output. Heavy manufacturing complexes, particularly in the petrochemical and power generation sectors, continue to demand equipment with exceptional high pressure steam generation capacity to maintain uninterrupted, round-the-clock production cycles.
  • To maximize total facility efficiency, engineers are systematically integrating waste heat recovery steam generators into their existing exhaust networks. This strategic implementation captures secondary thermal energy, successfully lowering primary fuel consumption by 15% compared to facilities utilizing isolated heating units. Through these targeted infrastructure upgrades, multinational corporations seamlessly balance rigorous production demands with comprehensive corporate sustainability goals.

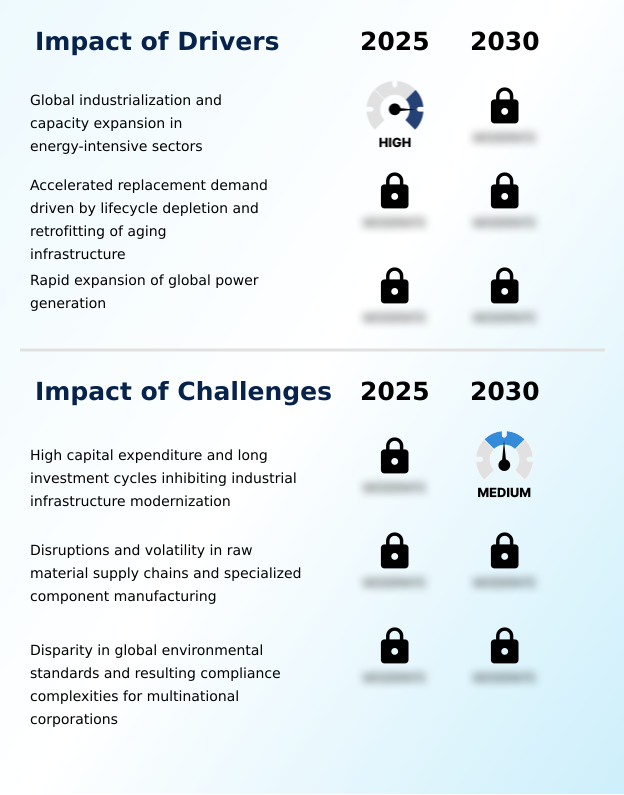
What are the key market drivers leading to the rise in the adoption of Industrial Boiler Industry?

  • The rapid pace of global industrialization, coupled with continuous capacity expansions across energy-intensive sectors, serves as the primary catalyst propelling market demand.

  • The expansive modernization of the paper and pulp processing sector acts as a massive driver propelling the Global Industrial Boiler Market 2026-2030.
  • Intensive manufacturing phases, such as chemical pulping and industrial bleaching, demand continuous high-pressure steam, forcing facility managers to upgrade structurally depleted infrastructure.
  • To optimize operational economics, mills are aggressively deploying highly specialized chemical recovery boilers engineered to cleanly combust black liquor byproducts. This closed-loop fuel utilization has successfully reduced external fuel dependency by 35% in integrated paper facilities.
  • Additionally, the strategic integration of supplemental industrial heat pumps and direct electrical heating systems has further improved thermal stability, lowering overall facility energy consumption by 15%.
  • This relentless pursuit of localized energy independence directly accelerates capital investments in advanced thermal generation technologies.

What are the market trends shaping the Industrial Boiler Industry?

  • The proliferation of digitalization and artificial intelligence-driven predictive maintenance systems represents a primary trend shaping the sector. These advanced analytics platforms optimize thermal infrastructure by enabling proactive lifecycle management and reducing unscheduled downtime.

  • A definitive trend redefining the Global Industrial Boiler Market 2026-2030 is the accelerated adoption of holistic lifecycle management strategies. Heavy manufacturing facilities are aggressively shifting away from reactive repairs to prevent unexpected metallurgical fatigue in their critical thermal systems. As corporate sustainability targets become increasingly rigid, forward-thinking operators are deploying high-capacity electric industrial boilers powered by dedicated on-site solar arrays.
  • This transition has successfully lowered operational carbon footprints by 40% across modernized industrial parks. Because these modern hardware integrated utility blocks are engineered to maintain maximum thermal output capacity without relying on volatile fossil fuel markets, supply chain resilience is vastly improved.
  • Consequently, industrial enterprises utilizing these advanced thermal architectures have reported a 28% reduction in total energy expenditure, ensuring uninterrupted production cycles while firmly aligning daily operations with rigorous international environmental compliance standards.

What challenges does the Industrial Boiler Industry face during its growth?

  • Substantial capital expenditure requirements and prolonged investment cycles heavily inhibit the timely modernization of industrial infrastructure, acting as a major macroeconomic restraint.

  • Systemic disruptions in raw material supply chains severely hinder the modernization of the Global Industrial Boiler Market 2026-2030. The fabrication of heavy-duty thermal systems requires immense volumes of specialized stainless steel alloys capable of resisting severe structural degradation under extreme pressure.
  • Recent volatility in global metallurgical commodity markets has directly increased manufacturing costs, forcing equipment providers to extend final delivery lead times by up to 25%. This bottleneck actively disrupts the implementation of digital control architectures and advanced hydrogen gas co firing systems within heavy manufacturing complexes.
  • To mitigate these extended delays, facility managers are increasingly pivoting toward highly standardized modular packaged boiler configurations, which offer faster installation timelines. Nevertheless, these persistent logistical constraints delay the transition to a closed carbon cycle, keeping operational downtime 12% higher in regions heavily reliant on imported mechanical components.

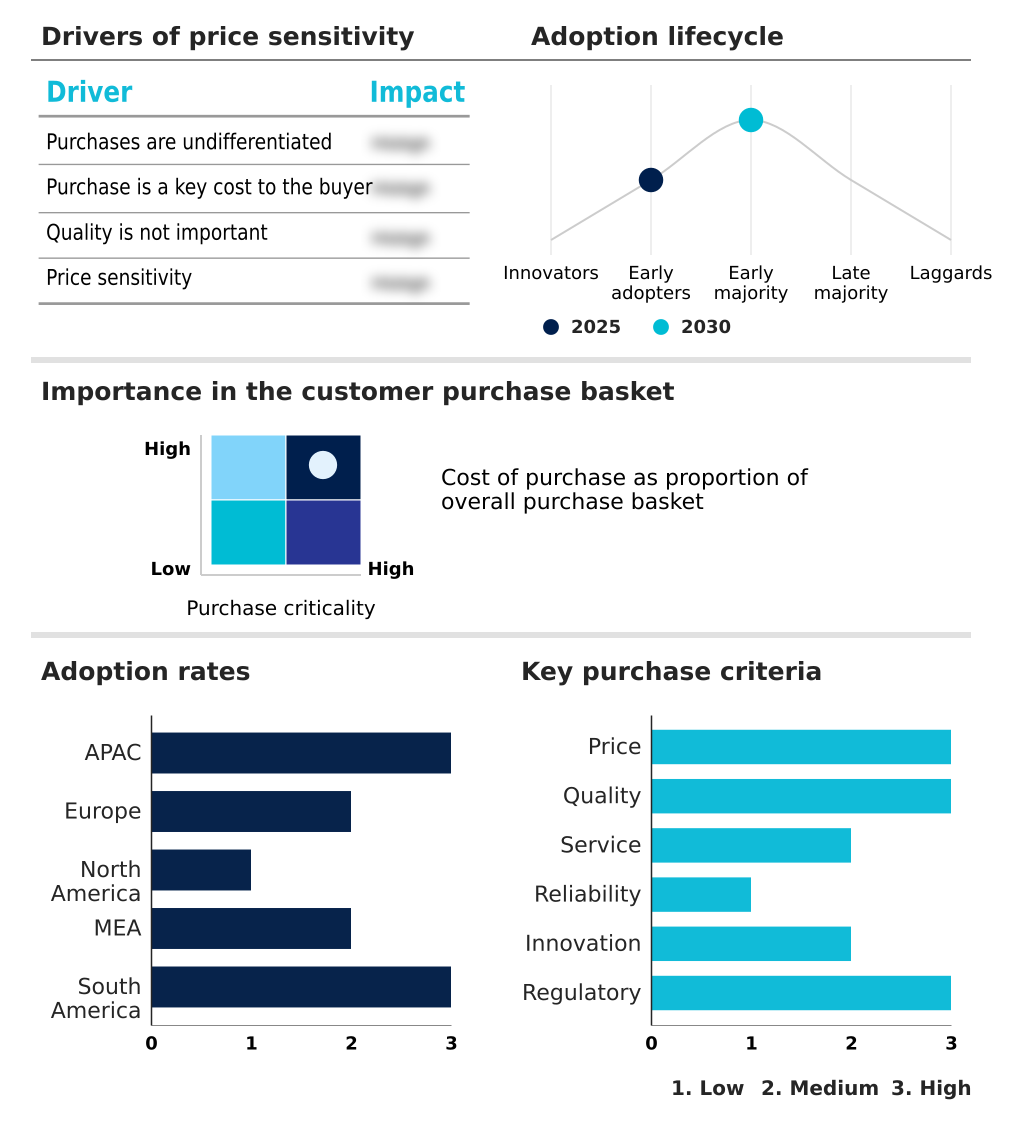
Exclusive Technavio Analysis on Customer Landscape

The industrial boiler market forecasting report includes the adoption lifecycle of the market, covering from the innovator’s stage to the laggard’s stage. It focuses on adoption rates in different regions based on penetration. Furthermore, the industrial boiler market report also includes key purchase criteria and drivers of price sensitivity to help companies evaluate and develop their market growth analysis strategies.

Customer Landscape of Industrial Boiler Industry

Competitive Landscape

Companies are implementing various strategies, such as strategic alliances, industrial boiler market forecast, partnerships, mergers and acquisitions, geographical expansion, and product/service launches, to enhance their presence in the industry.

Alfa Laval AB - The product portfolio includes advanced industrial boiler solutions specifically engineered for efficient thermal transfer, delivering reliable high-pressure steam and heating configurations optimized for rigorous commercial manufacturing applications.

The industry research and growth report includes detailed analyses of the competitive landscape of the market and information about key companies, including:

  • Alfa Laval AB
  • Andritz AG
  • Babcock and Wilcox
  • Bharat Heavy Electricals Ltd.
  • Byworth Boilers Ltd.
  • Cheema Boilers Ltd.
  • Clayton Industries.
  • Cochran Ltd.
  • Danstoker AS
  • Doosan Enerbility Co. Ltd.
  • Forbes Marshall Pvt. Ltd.
  • Hurst Boiler and Welding Co. Inc.
  • IHI Corp.
  • John Cockerill
  • Mitsubishi Heavy Industries
  • Rentech Boilers Systems Inc.
  • Robert Bosch GmbH
  • Superior Boiler
  • The Cleaver Brooks Co. Inc.
  • Thermax Ltd.

Qualitative and quantitative analysis of companies has been conducted to help clients understand the wider business environment as well as the strengths and weaknesses of key industry players. Data is qualitatively analyzed to categorize companies as pure play, category-focused, industry-focused, and diversified; it is quantitatively analyzed to categorize companies as dominant, leading, strong, tentative, and weak.

Recent Development and News in Industrial boiler market

  • In the Industrial Machinery and Supplies and Components industry, the widespread adoption of AI-driven autonomous multi fuel systems and automated factory architectures has increased the requirement for seamlessly integrated utility infrastructure, directly impacting Industrial Boiler demand by compelling operators to upgrade legacy thermal units to digitally compatible configurations.
  • The enforcement of stringent regional air quality mandates, such as the EU Industrial Emissions Directive, has forced process equipment manufacturers to redesign heavy-duty combustion chambers, thereby accelerating the replacement rate within the Industrial Boiler sector as facilities transition to low emission burners and advanced atomization systems.
  • Supply chain constraints involving specialized high-grade carbon steel and stainless steel alloys have restricted the production of high-pressure pressurized vessels, suppressing short-term Industrial Boiler capacity expansions while driving end-users toward modular packaged boiler configurations.
  • The strategic shift toward circular economy principles and industrial cogeneration within energy-intensive sectors like chemical pulping has elevated the deployment of waste heat recovery steam generators, boosting Industrial Boiler adoption by integrating thermal output capacity directly with localized electricity production.

Dive into Technavio’s robust research methodology, blending expert interviews, extensive data synthesis, and validated models for unparalleled Industrial Boiler Market insights. See full methodology.

Market Scope
Page number 328
Base year 2025
Historic period 2020-2024
Forecast period 2026-2030
Growth momentum & CAGR Accelerate at a CAGR of 3.6%
Market growth 2026-2030 USD 3299.4 million
Market structure Fragmented
YoY growth 2025-2026(%) 3.4%
Key countries China, India, Japan, South Korea, Australia, Indonesia, Germany, UK, France, Italy, Spain, The Netherlands, US, Canada, Mexico, Saudi Arabia, UAE, South Africa, Egypt, Algeria, Brazil, Argentina and Chile
Competitive landscape Leading Companies, Market Positioning of Companies, Competitive Strategies, and Industry Risks

Request Free Sample

Research Analyst Overview

  • The Global Industrial Boiler Market 2026-2030 is rapidly transitioning toward highly integrated thermal ecosystems capable of sustaining rigorous manufacturing workloads while minimizing carbon footprints. Strategic boardroom decisions now prioritize the implementation of industrial cogeneration frameworks, directing capital toward systems that produce both electricity and usable heat.
  • By coupling heavy-duty combustion chambers with mechanical steam turbines, heavy processing facilities capture and redirect low pressure exhaust steam back into the primary manufacturing line. This closed-loop configuration has generated a 35% improvement in overall thermodynamic efficiency compared to traditional standalone heating units.
  • Furthermore, the deployment of supercritical technologies and ultra supercritical technologies allows power generation hubs to extract maximum energy from their designated fuel sources. In highly regulated sectors such as pharmaceutical and food processing, executives are mandating the integration of specialized sanitary steam generators equipped with advanced heat recovery modules.
  • These investments directly address stringent public health compliance requirements, ensuring that localized thermal production aligns perfectly with long-term corporate sustainability and operational cost reduction mandates.

What are the Key Data Covered in this Industrial Boiler Market Research and Growth Report?

  • What is the expected growth of the Industrial Boiler Market between 2026 and 2030?

    • USD 3.30 billion, at a CAGR of 3.6%

  • What segmentation does the market report cover?

    • The report is segmented by Source (Gas fired boiler, Coal fired boiler, Oil fired boiler, and Others), End-user (Chemicals and petrochemicals, Food processing, Paper and pulp, Power generation, and Others), Type (Fire-tube boilers, and Water-tube boilers), Power Rating (10-150 BHP, 51-300 BHP, and 301-600 BHP) and Geography (APAC, Europe, North America, Middle East and Africa, South America)

  • Which regions are analyzed in the report?

    • APAC, Europe, North America, Middle East and Africa and South America

  • What are the key growth drivers and market challenges?

    • Global industrialization and capacity expansion in energy-intensive sectors, High capital expenditure and long investment cycles inhibiting industrial infrastructure modernization

  • Who are the major players in the Industrial Boiler Market?

    • Alfa Laval AB, Andritz AG, Babcock and Wilcox, Bharat Heavy Electricals Ltd., Byworth Boilers Ltd., Cheema Boilers Ltd., Clayton Industries., Cochran Ltd., Danstoker AS, Doosan Enerbility Co. Ltd., Forbes Marshall Pvt. Ltd., Hurst Boiler and Welding Co. Inc., IHI Corp., John Cockerill, Mitsubishi Heavy Industries, Rentech Boilers Systems Inc., Robert Bosch GmbH, Superior Boiler, The Cleaver Brooks Co. Inc. and Thermax Ltd.

Market Research Insights

  • The Global Industrial Boiler Market 2026-2030 is undergoing a rapid technological transformation centered around automated thermal management. Industrial operators are rapidly deploying smart boiler architectures equipped with advanced telemetry and sensor networks to monitor critical parameters like flame geometry and feed water chemistry in real time.
  • This operational pivot has directly enhanced combustion efficiency, lowering overall fuel waste by 14% across continuous manufacturing cycles. Furthermore, the precise tracking of flue gas temperatures has improved mechanical reliability, reducing unscheduled facility downtime by 22%.
  • By leveraging these digital innovations, large-scale industrial complexes ensure strict regulatory compliance and achieve significant cost reductions, firmly establishing automated thermal systems as a cornerstone of modern manufacturing infrastructure.

We can help! Our analysts can customize this industrial boiler market research report to meet your requirements.

Get in touch

1. Executive Summary

1.1 Market overview

Executive Summary - Chart on Market Overview
Executive Summary - Data Table on Market Overview
Executive Summary - Chart on Global Market Characteristics
Executive Summary - Chart on Market by Geography
Executive Summary - Chart on Market Segmentation by Source
Executive Summary - Chart on Market Segmentation by End-user
Executive Summary - Chart on Market Segmentation by Type
Executive Summary - Chart on Market Segmentation by Power Rating
Executive Summary - Chart on Incremental Growth
Executive Summary - Data Table on Incremental Growth
Executive Summary - Chart on Company Market Positioning

2. Technavio Analysis

2.1 Analysis of price sensitivity, lifecycle, customer purchase basket, adoption rates, and purchase criteria

2.2 Criticality of inputs and Factors of differentiation

Chart on Overview on criticality of inputs and factors of differentiation

2.3 Factors of disruption

Chart on Overview on factors of disruption

2.4 Impact of drivers and challenges

Chart on Impact of drivers and challenges in 2025 and 2030

3. Market Landscape

3.1 Market ecosystem

Chart on Parent Market
Data Table on - Parent Market

3.2 Market characteristics

Chart on Market characteristics analysis

3.3 Value chain analysis

Chart on Value chain analysis

4. Market Sizing

4.1 Market definition

Data Table on Offerings of companies included in the market definition

4.2 Market segment analysis

Market segments

4.3 Market size 2025

4.4 Market outlook: Forecast for 2025-2030

Chart on Global - Market size and forecast 2025-2030 ($ million)
Data Table on Global - Market size and forecast 2025-2030 ($ million)
Chart on Global Market: Year-over-year growth 2025-2030 (%)
Data Table on Global Market: Year-over-year growth 2025-2030 (%)

5. Historic Market Size

5.1 Global Industrial Boiler Market 2020 - 2024

Historic Market Size - Data Table on Global Industrial Boiler Market 2020 - 2024 ($ million)

5.2 Source segment analysis 2020 - 2024

Historic Market Size - Source Segment 2020 - 2024 ($ million)

5.3 End-user segment analysis 2020 - 2024

Historic Market Size - End-user Segment 2020 - 2024 ($ million)

5.4 Type segment analysis 2020 - 2024

Historic Market Size - Type Segment 2020 - 2024 ($ million)

5.5 Power Rating segment analysis 2020 - 2024

Historic Market Size - Power Rating Segment 2020 - 2024 ($ million)

5.6 Geography segment analysis 2020 - 2024

Historic Market Size - Geography Segment 2020 - 2024 ($ million)

5.7 Country segment analysis 2020 - 2024

Historic Market Size - Country Segment 2020 - 2024 ($ million)

6. Qualitative Analysis

6.1 Impact of AI on global industrial boiler market

6.2 Impact of geopolitical conflicts on global industrial boiler market

7. Five Forces Analysis

7.1 Five forces summary

Five forces analysis - Comparison between 2025 and 2030

7.2 Bargaining power of buyers

Bargaining power of buyers - Impact of key factors 2025 and 2030

7.3 Bargaining power of suppliers

Bargaining power of suppliers - Impact of key factors in 2025 and 2030

7.4 Threat of new entrants

Threat of new entrants - Impact of key factors in 2025 and 2030

7.5 Threat of substitutes

Threat of substitutes - Impact of key factors in 2025 and 2030

7.6 Threat of rivalry

Threat of rivalry - Impact of key factors in 2025 and 2030

7.7 Market condition

Chart on Market condition - Five forces 2025 and 2030

8. Market Segmentation by Source

8.1 Market segments

Chart on Source - Market share 2025-2030 (%)
Data Table on Source - Market share 2025-2030 (%)

8.2 Comparison by Source

Chart on Comparison by Source
Data Table on Comparison by Source

8.3 Gas fired boiler - Market size and forecast 2025-2030

Chart on Gas fired boiler - Market size and forecast 2025-2030 ($ million)
Data Table on Gas fired boiler - Market size and forecast 2025-2030 ($ million)
Chart on Gas fired boiler - Year-over-year growth 2025-2030 (%)
Data Table on Gas fired boiler - Year-over-year growth 2025-2030 (%)

8.4 Coal fired boiler - Market size and forecast 2025-2030

Chart on Coal fired boiler - Market size and forecast 2025-2030 ($ million)
Data Table on Coal fired boiler - Market size and forecast 2025-2030 ($ million)
Chart on Coal fired boiler - Year-over-year growth 2025-2030 (%)
Data Table on Coal fired boiler - Year-over-year growth 2025-2030 (%)

8.5 Oil fired boiler - Market size and forecast 2025-2030

Chart on Oil fired boiler - Market size and forecast 2025-2030 ($ million)
Data Table on Oil fired boiler - Market size and forecast 2025-2030 ($ million)
Chart on Oil fired boiler - Year-over-year growth 2025-2030 (%)
Data Table on Oil fired boiler - Year-over-year growth 2025-2030 (%)

8.6 Others - Market size and forecast 2025-2030

Chart on Others - Market size and forecast 2025-2030 ($ million)
Data Table on Others - Market size and forecast 2025-2030 ($ million)
Chart on Others - Year-over-year growth 2025-2030 (%)
Data Table on Others - Year-over-year growth 2025-2030 (%)

8.7 Market opportunity by Source

Market opportunity by Source ($ million)
Data Table on Market opportunity by Source ($ million)

9. Market Segmentation by End-user

9.1 Market segments

Chart on End-user - Market share 2025-2030 (%)
Data Table on End-user - Market share 2025-2030 (%)

9.2 Comparison by End-user

Chart on Comparison by End-user
Data Table on Comparison by End-user

9.3 Chemicals and petrochemicals - Market size and forecast 2025-2030

Chart on Chemicals and petrochemicals - Market size and forecast 2025-2030 ($ million)
Data Table on Chemicals and petrochemicals - Market size and forecast 2025-2030 ($ million)
Chart on Chemicals and petrochemicals - Year-over-year growth 2025-2030 (%)
Data Table on Chemicals and petrochemicals - Year-over-year growth 2025-2030 (%)

9.4 Food processing - Market size and forecast 2025-2030

Chart on Food processing - Market size and forecast 2025-2030 ($ million)
Data Table on Food processing - Market size and forecast 2025-2030 ($ million)
Chart on Food processing - Year-over-year growth 2025-2030 (%)
Data Table on Food processing - Year-over-year growth 2025-2030 (%)

9.5 Paper and pulp - Market size and forecast 2025-2030

Chart on Paper and pulp - Market size and forecast 2025-2030 ($ million)
Data Table on Paper and pulp - Market size and forecast 2025-2030 ($ million)
Chart on Paper and pulp - Year-over-year growth 2025-2030 (%)
Data Table on Paper and pulp - Year-over-year growth 2025-2030 (%)

9.6 Power generation - Market size and forecast 2025-2030

Chart on Power generation - Market size and forecast 2025-2030 ($ million)
Data Table on Power generation - Market size and forecast 2025-2030 ($ million)
Chart on Power generation - Year-over-year growth 2025-2030 (%)
Data Table on Power generation - Year-over-year growth 2025-2030 (%)

9.7 Others - Market size and forecast 2025-2030

Chart on Others - Market size and forecast 2025-2030 ($ million)
Data Table on Others - Market size and forecast 2025-2030 ($ million)
Chart on Others - Year-over-year growth 2025-2030 (%)
Data Table on Others - Year-over-year growth 2025-2030 (%)

9.8 Market opportunity by End-user

Market opportunity by End-user ($ million)
Data Table on Market opportunity by End-user ($ million)

10. Market Segmentation by Type

10.1 Market segments

Chart on Type - Market share 2025-2030 (%)
Data Table on Type - Market share 2025-2030 (%)

10.2 Comparison by Type

Chart on Comparison by Type
Data Table on Comparison by Type

10.3 Fire-tube boilers - Market size and forecast 2025-2030

Chart on Fire-tube boilers - Market size and forecast 2025-2030 ($ million)
Data Table on Fire-tube boilers - Market size and forecast 2025-2030 ($ million)
Chart on Fire-tube boilers - Year-over-year growth 2025-2030 (%)
Data Table on Fire-tube boilers - Year-over-year growth 2025-2030 (%)

10.4 Water-tube boilers - Market size and forecast 2025-2030

Chart on Water-tube boilers - Market size and forecast 2025-2030 ($ million)
Data Table on Water-tube boilers - Market size and forecast 2025-2030 ($ million)
Chart on Water-tube boilers - Year-over-year growth 2025-2030 (%)
Data Table on Water-tube boilers - Year-over-year growth 2025-2030 (%)

10.5 Market opportunity by Type

Market opportunity by Type ($ million)
Data Table on Market opportunity by Type ($ million)

11. Market Segmentation by Power Rating

11.1 Market segments

Chart on Power Rating - Market share 2025-2030 (%)
Data Table on Power Rating - Market share 2025-2030 (%)

11.2 Comparison by Power Rating

Chart on Comparison by Power Rating
Data Table on Comparison by Power Rating

11.3 10-150 BHP - Market size and forecast 2025-2030

Chart on 10-150 BHP - Market size and forecast 2025-2030 ($ million)
Data Table on 10-150 BHP - Market size and forecast 2025-2030 ($ million)
Chart on 10-150 BHP - Year-over-year growth 2025-2030 (%)
Data Table on 10-150 BHP - Year-over-year growth 2025-2030 (%)

11.4 51-300 BHP - Market size and forecast 2025-2030

Chart on 51-300 BHP - Market size and forecast 2025-2030 ($ million)
Data Table on 51-300 BHP - Market size and forecast 2025-2030 ($ million)
Chart on 51-300 BHP - Year-over-year growth 2025-2030 (%)
Data Table on 51-300 BHP - Year-over-year growth 2025-2030 (%)

11.5 301-600 BHP - Market size and forecast 2025-2030

Chart on 301-600 BHP - Market size and forecast 2025-2030 ($ million)
Data Table on 301-600 BHP - Market size and forecast 2025-2030 ($ million)
Chart on 301-600 BHP - Year-over-year growth 2025-2030 (%)
Data Table on 301-600 BHP - Year-over-year growth 2025-2030 (%)

11.6 Market opportunity by Power Rating

Market opportunity by Power Rating ($ million)
Data Table on Market opportunity by Power Rating ($ million)

12. Customer Landscape

12.1 Customer landscape overview

Analysis of price sensitivity, lifecycle, customer purchase basket, adoption rates, and purchase criteria

13. Geographic Landscape

13.1 Geographic segmentation

Chart on Market share by geography 2025-2030 (%)
Data Table on Market share by geography 2025-2030 (%)

13.2 Geographic comparison

Chart on Geographic comparison
Data Table on Geographic comparison

13.3 APAC - Market size and forecast 2025-2030

Chart on APAC - Market size and forecast 2025-2030 ($ million)
Data Table on APAC - Market size and forecast 2025-2030 ($ million)
Chart on APAC - Year-over-year growth 2025-2030 (%)
Data Table on APAC - Year-over-year growth 2025-2030 (%)
Chart on Regional Comparison - APAC
Data Table on Regional Comparison - APAC

13.3.1 China - Market size and forecast 2025-2030

Chart on China - Market size and forecast 2025-2030 ($ million)
Data Table on China - Market size and forecast 2025-2030 ($ million)
Chart on China - Year-over-year growth 2025-2030 (%)
Data Table on China - Year-over-year growth 2025-2030 (%)

13.3.2 India - Market size and forecast 2025-2030

Chart on India - Market size and forecast 2025-2030 ($ million)
Data Table on India - Market size and forecast 2025-2030 ($ million)
Chart on India - Year-over-year growth 2025-2030 (%)
Data Table on India - Year-over-year growth 2025-2030 (%)

13.3.3 Japan - Market size and forecast 2025-2030

Chart on Japan - Market size and forecast 2025-2030 ($ million)
Data Table on Japan - Market size and forecast 2025-2030 ($ million)
Chart on Japan - Year-over-year growth 2025-2030 (%)
Data Table on Japan - Year-over-year growth 2025-2030 (%)

13.3.4 South Korea - Market size and forecast 2025-2030

Chart on South Korea - Market size and forecast 2025-2030 ($ million)
Data Table on South Korea - Market size and forecast 2025-2030 ($ million)
Chart on South Korea - Year-over-year growth 2025-2030 (%)
Data Table on South Korea - Year-over-year growth 2025-2030 (%)

13.3.5 Australia - Market size and forecast 2025-2030

Chart on Australia - Market size and forecast 2025-2030 ($ million)
Data Table on Australia - Market size and forecast 2025-2030 ($ million)
Chart on Australia - Year-over-year growth 2025-2030 (%)
Data Table on Australia - Year-over-year growth 2025-2030 (%)

13.3.6 Indonesia - Market size and forecast 2025-2030

Chart on Indonesia - Market size and forecast 2025-2030 ($ million)
Data Table on Indonesia - Market size and forecast 2025-2030 ($ million)
Chart on Indonesia - Year-over-year growth 2025-2030 (%)
Data Table on Indonesia - Year-over-year growth 2025-2030 (%)

13.4 Europe - Market size and forecast 2025-2030

Chart on Europe - Market size and forecast 2025-2030 ($ million)
Data Table on Europe - Market size and forecast 2025-2030 ($ million)
Chart on Europe - Year-over-year growth 2025-2030 (%)
Data Table on Europe - Year-over-year growth 2025-2030 (%)
Chart on Regional Comparison - Europe
Data Table on Regional Comparison - Europe

13.4.1 Germany - Market size and forecast 2025-2030

Chart on Germany - Market size and forecast 2025-2030 ($ million)
Data Table on Germany - Market size and forecast 2025-2030 ($ million)
Chart on Germany - Year-over-year growth 2025-2030 (%)
Data Table on Germany - Year-over-year growth 2025-2030 (%)

13.4.2 UK - Market size and forecast 2025-2030

Chart on UK - Market size and forecast 2025-2030 ($ million)
Data Table on UK - Market size and forecast 2025-2030 ($ million)
Chart on UK - Year-over-year growth 2025-2030 (%)
Data Table on UK - Year-over-year growth 2025-2030 (%)

13.4.3 France - Market size and forecast 2025-2030

Chart on France - Market size and forecast 2025-2030 ($ million)
Data Table on France - Market size and forecast 2025-2030 ($ million)
Chart on France - Year-over-year growth 2025-2030 (%)
Data Table on France - Year-over-year growth 2025-2030 (%)

13.4.4 Italy - Market size and forecast 2025-2030

Chart on Italy - Market size and forecast 2025-2030 ($ million)
Data Table on Italy - Market size and forecast 2025-2030 ($ million)
Chart on Italy - Year-over-year growth 2025-2030 (%)
Data Table on Italy - Year-over-year growth 2025-2030 (%)

13.4.5 Spain - Market size and forecast 2025-2030

Chart on Spain - Market size and forecast 2025-2030 ($ million)
Data Table on Spain - Market size and forecast 2025-2030 ($ million)
Chart on Spain - Year-over-year growth 2025-2030 (%)
Data Table on Spain - Year-over-year growth 2025-2030 (%)

13.4.6 The Netherlands - Market size and forecast 2025-2030

Chart on The Netherlands - Market size and forecast 2025-2030 ($ million)
Data Table on The Netherlands - Market size and forecast 2025-2030 ($ million)
Chart on The Netherlands - Year-over-year growth 2025-2030 (%)
Data Table on The Netherlands - Year-over-year growth 2025-2030 (%)

13.5 North America - Market size and forecast 2025-2030

Chart on North America - Market size and forecast 2025-2030 ($ million)
Data Table on North America - Market size and forecast 2025-2030 ($ million)
Chart on North America - Year-over-year growth 2025-2030 (%)
Data Table on North America - Year-over-year growth 2025-2030 (%)
Chart on Regional Comparison - North America
Data Table on Regional Comparison - North America

13.5.1 US - Market size and forecast 2025-2030

Chart on US - Market size and forecast 2025-2030 ($ million)
Data Table on US - Market size and forecast 2025-2030 ($ million)
Chart on US - Year-over-year growth 2025-2030 (%)
Data Table on US - Year-over-year growth 2025-2030 (%)

13.5.2 Canada - Market size and forecast 2025-2030

Chart on Canada - Market size and forecast 2025-2030 ($ million)
Data Table on Canada - Market size and forecast 2025-2030 ($ million)
Chart on Canada - Year-over-year growth 2025-2030 (%)
Data Table on Canada - Year-over-year growth 2025-2030 (%)

13.5.3 Mexico - Market size and forecast 2025-2030

Chart on Mexico - Market size and forecast 2025-2030 ($ million)
Data Table on Mexico - Market size and forecast 2025-2030 ($ million)
Chart on Mexico - Year-over-year growth 2025-2030 (%)
Data Table on Mexico - Year-over-year growth 2025-2030 (%)

13.6 Middle East and Africa - Market size and forecast 2025-2030

Chart on Middle East and Africa - Market size and forecast 2025-2030 ($ million)
Data Table on Middle East and Africa - Market size and forecast 2025-2030 ($ million)
Chart on Middle East and Africa - Year-over-year growth 2025-2030 (%)
Data Table on Middle East and Africa - Year-over-year growth 2025-2030 (%)
Chart on Regional Comparison - Middle East and Africa
Data Table on Regional Comparison - Middle East and Africa

13.6.1 Saudi Arabia - Market size and forecast 2025-2030

Chart on Saudi Arabia - Market size and forecast 2025-2030 ($ million)
Data Table on Saudi Arabia - Market size and forecast 2025-2030 ($ million)
Chart on Saudi Arabia - Year-over-year growth 2025-2030 (%)
Data Table on Saudi Arabia - Year-over-year growth 2025-2030 (%)

13.6.2 UAE - Market size and forecast 2025-2030

Chart on UAE - Market size and forecast 2025-2030 ($ million)
Data Table on UAE - Market size and forecast 2025-2030 ($ million)
Chart on UAE - Year-over-year growth 2025-2030 (%)
Data Table on UAE - Year-over-year growth 2025-2030 (%)

13.6.3 South Africa - Market size and forecast 2025-2030

Chart on South Africa - Market size and forecast 2025-2030 ($ million)
Data Table on South Africa - Market size and forecast 2025-2030 ($ million)
Chart on South Africa - Year-over-year growth 2025-2030 (%)
Data Table on South Africa - Year-over-year growth 2025-2030 (%)

13.6.4 Egypt - Market size and forecast 2025-2030

Chart on Egypt - Market size and forecast 2025-2030 ($ million)
Data Table on Egypt - Market size and forecast 2025-2030 ($ million)
Chart on Egypt - Year-over-year growth 2025-2030 (%)
Data Table on Egypt - Year-over-year growth 2025-2030 (%)

13.6.5 Algeria - Market size and forecast 2025-2030

Chart on Algeria - Market size and forecast 2025-2030 ($ million)
Data Table on Algeria - Market size and forecast 2025-2030 ($ million)
Chart on Algeria - Year-over-year growth 2025-2030 (%)
Data Table on Algeria - Year-over-year growth 2025-2030 (%)

13.7 South America - Market size and forecast 2025-2030

Chart on South America - Market size and forecast 2025-2030 ($ million)
Data Table on South America - Market size and forecast 2025-2030 ($ million)
Chart on South America - Year-over-year growth 2025-2030 (%)
Data Table on South America - Year-over-year growth 2025-2030 (%)
Chart on Regional Comparison - South America
Data Table on Regional Comparison - South America

13.7.1 Brazil - Market size and forecast 2025-2030

Chart on Brazil - Market size and forecast 2025-2030 ($ million)
Data Table on Brazil - Market size and forecast 2025-2030 ($ million)
Chart on Brazil - Year-over-year growth 2025-2030 (%)
Data Table on Brazil - Year-over-year growth 2025-2030 (%)

13.7.2 Argentina - Market size and forecast 2025-2030

Chart on Argentina - Market size and forecast 2025-2030 ($ million)
Data Table on Argentina - Market size and forecast 2025-2030 ($ million)
Chart on Argentina - Year-over-year growth 2025-2030 (%)
Data Table on Argentina - Year-over-year growth 2025-2030 (%)

13.7.3 Chile - Market size and forecast 2025-2030

Chart on Chile - Market size and forecast 2025-2030 ($ million)
Data Table on Chile - Market size and forecast 2025-2030 ($ million)
Chart on Chile - Year-over-year growth 2025-2030 (%)
Data Table on Chile - Year-over-year growth 2025-2030 (%)

13.8 Market opportunity by geography

Market opportunity by geography ($ million)
Data Tables on Market opportunity by geography ($ million)

14. Drivers, Challenges, and Opportunity

14.1 Market drivers

Global industrialization and capacity expansion in energy-intensive sectors
Accelerated replacement demand driven by lifecycle depletion and retrofitting of aging infrastructure
Rapid expansion of global power generation

14.2 Market challenges

High capital expenditure and long investment cycles inhibiting industrial infrastructure modernization
Disruptions and volatility in raw material supply chains and specialized component manufacturing
Disparity in global environmental standards and resulting compliance complexities for multinational corporations

14.3 Impact of drivers and challenges

Impact of drivers and challenges in 2025 and 2030

14.4 Market opportunities

Proliferation of digitalization and artificial intelligence-driven predictive maintenance systems
Accelerated commercialization and integration of hydrogen-ready and dual-fuel combustion technologies
Rising procurement of modular, skid-mounted, and packaged boiler configurations

15. Competitive Landscape

15.1 Overview

15.2

Overview on criticality of inputs and factors of differentiation

15.3 Landscape disruption

Overview on factors of disruption

15.4 Industry risks

Impact of key risks on business

16. Competitive Analysis

16.1 Companies profiled

Companies covered

16.2 Company ranking index

16.3 Market positioning of companies

Matrix on companies position and classification

16.4 Alfa Laval AB

Alfa Laval AB - Overview
Alfa Laval AB - Business segments
Alfa Laval AB - Key offerings
Alfa Laval AB - Segment focus
SWOT

16.5 Andritz AG

Andritz AG - Overview
Andritz AG - Business segments
Andritz AG - Key offerings
Andritz AG - Segment focus
SWOT

16.6 Babcock and Wilcox

Babcock and Wilcox - Overview
Babcock and Wilcox - Business segments
Babcock and Wilcox - Key news
Babcock and Wilcox - Key offerings
Babcock and Wilcox - Segment focus
SWOT

16.7 Bharat Heavy Electricals Ltd.

Bharat Heavy Electricals Ltd. - Overview
Bharat Heavy Electricals Ltd. - Business segments
Bharat Heavy Electricals Ltd. - Key offerings
Bharat Heavy Electricals Ltd. - Segment focus
SWOT

16.8 Clayton Industries.

Clayton Industries. - Overview
Clayton Industries. - Product / Service
Clayton Industries. - Key offerings
SWOT

16.9 Danstoker AS

Danstoker AS - Overview
Danstoker AS - Product / Service
Danstoker AS - Key offerings
SWOT

16.10 Doosan Enerbility Co. Ltd.

Doosan Enerbility Co. Ltd. - Overview
Doosan Enerbility Co. Ltd. - Business segments
Doosan Enerbility Co. Ltd. - Key offerings
Doosan Enerbility Co. Ltd. - Segment focus
SWOT

16.11 Hurst Boiler and Welding Co. Inc.

Hurst Boiler and Welding Co. Inc. - Overview
Hurst Boiler and Welding Co. Inc. - Product / Service
Hurst Boiler and Welding Co. Inc. - Key offerings
SWOT

16.12 IHI Corp.

IHI Corp. - Overview
IHI Corp. - Business segments
IHI Corp. - Key offerings
IHI Corp. - Segment focus
SWOT

16.13 John Cockerill

John Cockerill - Overview
John Cockerill - Product / Service
John Cockerill - Key offerings
SWOT

16.14 Mitsubishi Heavy Industries

Mitsubishi Heavy Industries - Overview
Mitsubishi Heavy Industries - Business segments
Mitsubishi Heavy Industries - Key offerings
Mitsubishi Heavy Industries - Segment focus
SWOT

16.15 Rentech Boilers Systems Inc.

Rentech Boilers Systems Inc. - Overview
Rentech Boilers Systems Inc. - Product / Service
Rentech Boilers Systems Inc. - Key offerings
SWOT

16.16 Robert Bosch GmbH

Robert Bosch GmbH - Overview
Robert Bosch GmbH - Product / Service
Robert Bosch GmbH - Key offerings
SWOT

16.17 The Cleaver Brooks Co. Inc.

The Cleaver Brooks Co. Inc. - Overview
The Cleaver Brooks Co. Inc. - Product / Service
The Cleaver Brooks Co. Inc. - Key offerings
SWOT

16.18 Thermax Ltd.

Thermax Ltd. - Overview
Thermax Ltd. - Business segments
Thermax Ltd. - Key offerings
Thermax Ltd. - Segment focus
SWOT

17. Appendix

17.1 Scope of the report

Market definition
Objectives
Notes and caveats

17.2 Inclusions and exclusions checklist

Inclusions checklist
Exclusions checklist

17.3 Currency conversion rates for US$

17.4 Research methodology

17.5 Data procurement

Information sources

17.6 Data validation

17.7 Validation techniques employed for market sizing

17.8 Data synthesis

17.9 360 degree market analysis

17.10 List of abbreviations

Research Methodology

Technavio presents a detailed picture of the market by way of study, synthesis, and summation of data from multiple sources. The analysts have presented the various facets of the market with a particular focus on identifying the key industry influencers. The data thus presented is comprehensive, reliable, and the result of extensive research, both primary and secondary.

INFORMATION SOURCES

Primary sources

  • Manufacturers and suppliers
  • Channel partners
  • Industry experts
  • Strategic decision makers

Secondary sources

  • Industry journals and periodicals
  • Government data
  • Financial reports of key industry players
  • Historical data
  • Press releases

DATA ANALYSIS

Data Synthesis

  • Collation of data
  • Estimation of key figures
  • Analysis of derived insights

Data Validation

  • Triangulation with data models
  • Reference against proprietary databases
  • Corroboration with industry experts

REPORT WRITING

Qualitative

  • Market drivers
  • Market challenges
  • Market trends
  • Five forces analysis

Quantitative

  • Market size and forecast
  • Market segmentation
  • Geographical insights
  • Competitive landscape

Interested in this report?

Get your sample now to see our research methodology and insights!

Download Now

Frequently Asked Questions

Industrial Boiler market growth will increase by USD 3299.4 million during 2026-2030.

The Industrial Boiler market is expected to grow at a CAGR of 3.6% during 2026-2030.

Industrial Boiler market is segmented by Source (Gas fired boiler, Coal fired boiler, Oil fired boiler, Others) End-user (Chemicals and petrochemicals, Food processing, Paper and pulp, Power generation, Others) Type (Fire-tube boilers, Water-tube boilers) Power rating (10-150 BHP, 51-300 BHP, 301-600 BHP)

Alfa Laval AB, Andritz AG, Babcock and Wilcox, Bharat Heavy Electricals Ltd., Byworth Boilers Ltd., Cheema Boilers Ltd., Clayton Industries., Cochran Ltd., Danstoker AS, Doosan Enerbility Co. Ltd., Forbes Marshall Pvt. Ltd., Hurst Boiler and Welding Co. Inc., IHI Corp., John Cockerill, Mitsubishi Heavy Industries, Rentech Boilers Systems Inc., Robert Bosch GmbH, Superior Boiler, The Cleaver Brooks Co. Inc., Thermax Ltd. are a few of the key vendors in the Industrial Boiler market.

APAC will register the highest growth rate of 39.8% among the other regions. Therefore, the Industrial Boiler market in APAC is expected to garner significant business opportunities for the vendors during the forecast period.

China, India, Japan, South Korea, Australia, Indonesia, Germany, UK, France, Italy, Spain, The Netherlands, US, Canada, Mexico, Saudi Arabia, UAE, South Africa, Egypt, Algeria, Brazil, Argentina, Chile

  • Global industrialization and capacity expansion in energy-intensive sectors is the driving factor this market.

The Industrial Boiler market vendors should focus on grabbing business opportunities from the Source segment as it accounted for the largest market share in the base year.
RIA - Research AI Assistant
Ask RIA