
Industrial Cyber Physical Security Market Size and Growth Forecast 2026-2030
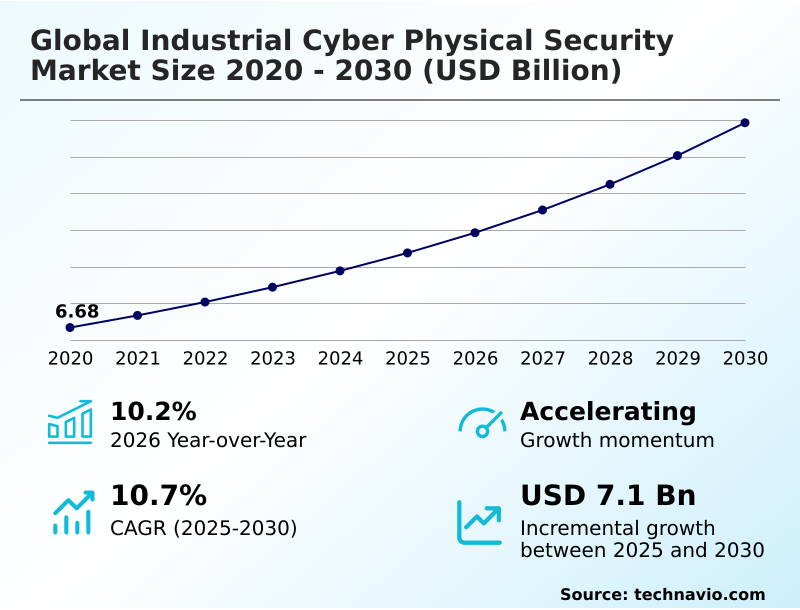
The Industrial Cyber Physical Security Market size was valued at USD 10.75 billion in 2025 growing at a CAGR of 10.7% during the forecast period 2026-2030.
North America accounts for 37.7% of incremental growth during the forecast period. The Software segment by Component was valued at USD 5.43 billion in 2024, while the Network security segment holds the largest revenue share by Type.
The market is projected to grow by USD 11.17 billion from 2020 to 2030, with USD 7.10 billion of the growth expected during the forecast period of 2025 to 2030.
Get Key Insights on Market Forecast (PDF) Request Free Sample
Industrial Cyber Physical Security Market Overview
The industrial cyber physical security market is expanding at a 10.2% year-over-year rate, driven by the escalating need to protect physical processes from digital threats. North America is a significant contributor, accounting for 37.7% of the market's incremental growth, largely due to stringent regulatory frameworks like NERC CIP. In practice, a modern automotive manufacturing plant leverages digital twin security testing to model the impact of a potential breach on its robotic assembly lines. By simulating attacks, engineers can refine HMI security controls and PLC security lifecycle management without interrupting production, ensuring operational resilience. This proactive approach, which incorporates OT asset visibility and comprehensive cyber-physical risk assessment, is becoming standard practice. Decision-makers are prioritizing investments in industrial incident response capabilities and solutions that ensure IEC 62443 compliance, recognizing that production continuity is directly linked to a robust defense-in-depth for ICS strategy.
Drivers, Trends, and Challenges in the Industrial Cyber Physical Security Market
A central challenge for procurement decision-makers is securing legacy industrial control systems, which often lack the capabilities for modern threat detection. This issue is amplified by regulations like the EU's Cyber-Physical Resilience Act, which mandates stringent security throughout a product's lifecycle. Consequently, many organizations are now focused on implementing zero trust in OT environments to mitigate risks.
For example, a petrochemical facility might deploy compensating controls and network micro-segmentation to manage vulnerabilities in industrial IoT devices connected to its legacy DCS. This strategy is essential for protecting PLCs from remote code execution, a common attack vector.
While such upgrades can increase operational expenses by nearly 25% for some operators, it is a necessary investment for OT incident response planning and drills.
The adoption of AI for predictive threat detection in ICS is also gaining ground, allowing for more proactive threat hunting in SCADA networks and creating a more resilient defense against sophisticated attacks on critical industrial assets.

Primary Growth Driver: The proliferation of Industry 4.0 and the Industrial Internet of Things (IIoT) is a key driver, expanding the attack surface as operational and information technologies converge.
The accelerating convergence of IT and OT systems under Industry 4.0 initiatives is a primary market driver, fueling a 10.2% year-over-year growth by expanding the industrial attack surface.
Escalating geopolitical tensions have intensified the focus on critical infrastructure protection, pushing organizations, particularly in North America which accounts for 37.7% of market growth, to bolster their defenses.
Furthermore, stringent regulatory mandates, such as the requirement for IEC 62443 compliance, are compelling industrial enterprises to invest in advanced security solutions.
This includes platforms capable of deep industrial protocol analysis and robust converged IT/OT security management, moving security from a cost center to a critical component of operational strategy.
Emerging Market Trend: A key trend is the advancement of artificial intelligence and machine learning in autonomous threat detection. These technologies enable a shift from reactive monitoring to predictive and self-healing security postures.
The market is advancing with the integration of AI and digital twins for proactive risk mitigation. This allows organizations to conduct digital twin security testing, simulating cyber-attacks on virtual replicas of physical assets to identify vulnerabilities before they can be exploited in the real world.
This trend is especially prominent in the fast-growing APAC market, which is expanding at 11.4%, as manufacturing hubs embrace these technologies. The use of behavioral anomaly detection and machine learning threat detection within these simulated environments helps refine security postures.
This enables a more effective OT zero trust implementation, ensuring IIoT device integrity and safeguarding hyper-connected industrial ecosystems against sophisticated threats.
Key Industry Challenge: The inherent complexity of integrating modern security protocols with aging legacy industrial systems presents a key challenge to market growth.
A significant market constraint is the difficulty of securing legacy industrial control systems, which often cannot support modern OT vulnerability management protocols. This technical gap is exacerbated by a severe talent shortage, with a documented 40% vacancy rate for security professionals who can perform effective cyber-physical risk assessment.
The high financial investment required for upgrades further impedes progress; some operators have reported that mandatory security enhancements increase total operational expenses by nearly 25%. This financial strain makes implementing a comprehensive defense-in-depth for ICS challenging, particularly for organizations managing disparate systems that require specialized secure remote OT access.
Explore Full Market Dynamics Analysis Request Free Sample
Industrial Cyber Physical Security Market Segmentation
The industrial cyber physical security industry research report provides comprehensive data including region-wise segment analysis, with forecasts and analysis for the period 2026-2030, as well as historical data from 2020-2024 for the following segments.
Component Segment Analysis
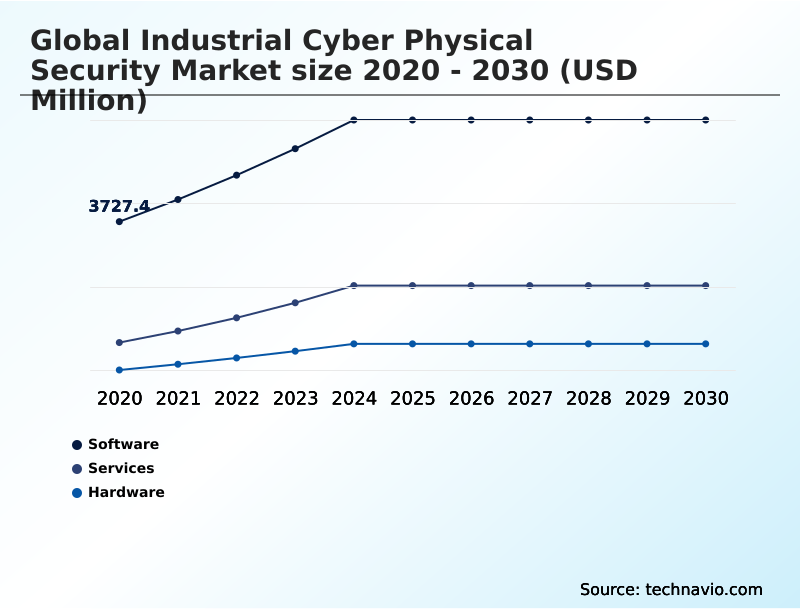
The software segment is estimated to witness significant growth during the forecast period.
The software segment is the analytical core of the industrial cyber physical security market, commanding a majority of market value.
These solutions are pivotal for operational technology security, enabling functions like industrial protocol analysis and behavioral anomaly detection across converged IT/OT security environments.
As industrial facilities advance, the demand for sophisticated software that facilitates continuous OT vulnerability management and supports IEC 62443 compliance grows.
The segment's dominance is reinforced by the need for platforms that can manage complex cyber-physical risk assessment and orchestrate industrial incident response.
The integration of AI and machine learning into these software tools for predictive threat modeling and ensuring IIoT device integrity further solidifies its critical role in protecting physical processes from digital threats.
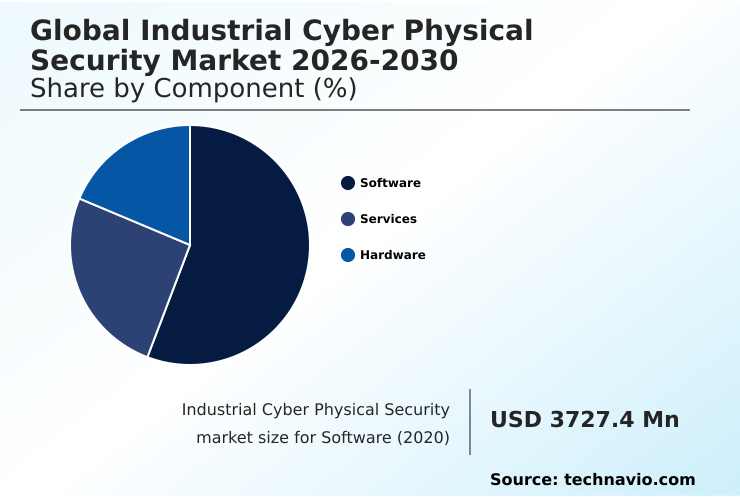
The Software segment was valued at USD 5.43 billion in 2024 and showed a gradual increase during the forecast period.
Industrial Cyber Physical Security Market by Region: North America Leads with 37.7% Growth Share
North America is estimated to contribute 37.7% to the growth of the global market during the forecast period.
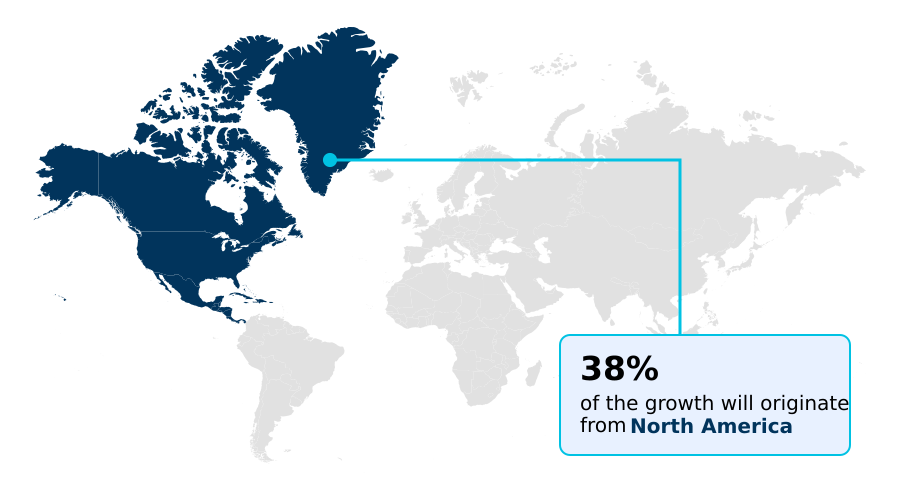
North America is at the forefront, contributing over 37% of the market's incremental growth, driven by early adoption in critical infrastructure and strict NERC CIP standards. This mature market focuses on OT zero trust implementation and advanced industrial threat intelligence.
In contrast, the APAC region is the fastest-growing at 11.4%, fueled by the rapid digitalization of manufacturing in countries like China and India.
This expansion creates significant demand for solutions addressing supply chain cyber risk and ensuring the integrity of hyper-connected production facilities.
Europe follows, with a strong emphasis on regulatory-driven security, mandating robust critical infrastructure protection and IEC 62443 compliance for industrial control systems security, particularly in Germany's Industry 4.0 landscape.
Customer Landscape Analysis for the Industrial Cyber Physical Security Market
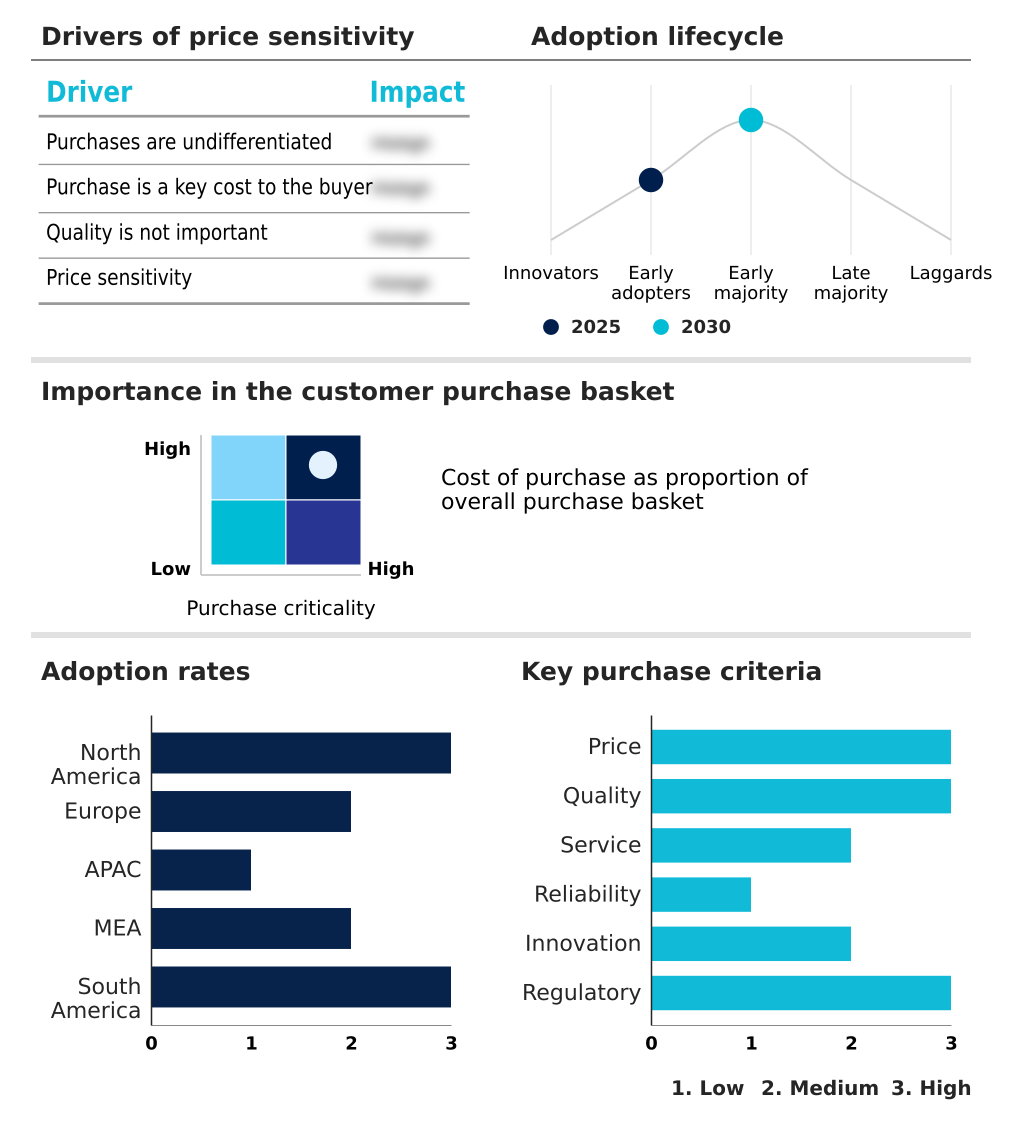
The industrial cyber physical security market forecasting report includes the adoption lifecycle of the market, covering from the innovator’s stage to the laggard’s stage. It focuses on adoption rates in different regions based on penetration. Furthermore, the industrial cyber physical security market report also includes key purchase criteria and drivers of price sensitivity to help companies evaluate and develop their market growth analysis strategies.
Competitive Landscape of the Industrial Cyber Physical Security Market
Companies are implementing various strategies, such as strategic alliances, partnerships, mergers and acquisitions, geographical expansion, and product/service launches, to enhance their presence in the industrial cyber physical security market industry.
ABB Ltd. - Provides consolidated security tools and automated threat detection for operational technology environments, delivering defense-in-depth solutions for industrial control systems and cyber-physical infrastructure.
The industry research and growth report includes detailed analyses of the competitive landscape of the market and information about key companies, including:
- ABB Ltd.
- Armis Inc.
- Belden Inc.
- Check Point Software Tech Ltd.
- Cisco Systems Inc.
- CrowdStrike Inc.
- Darktrace Holdings Ltd.
- Forescout Technologies Inc.
- Fortinet Inc.
- Hexagon AB
- Honeywell International Inc.
- Microsoft Corp.
- Nozomi Networks Inc.
- Palo Alto Networks Inc.
- Radiflow
- Rockwell Automation Inc.
- Schneider Electric SE
- Siemens AG
- Tenable Holdings Inc.
- Waterfall Security Solutions Ltd.
Qualitative and quantitative analysis of companies has been conducted to help clients understand the wider business environment as well as the strengths and weaknesses of key industry players. Data is qualitatively analyzed to categorize companies as pure play, category-focused, industry-focused, and diversified; it is quantitatively analyzed to categorize companies as dominant, leading, strong, tentative, and weak.
Recent Developments in the Industrial Cyber Physical Security Market
- In March, 2025, the International Society of Automation introduced a revised set of global standards that specifically address the security requirements for digital twin deployments in heavy manufacturing, aiming to protect the digital representations of physical assets from tampering.
- In March, 2025, the United States Department of Energy finalized a major initiative to bolster the resilience of the electric sub-sector by establishing a new cyber-physical testing laboratory to simulate digital threats on grid hardware.
- In May, 2025, the Cyber-Industrial Union of South America announced the successful completion of a regional pilot program that utilized deep learning neural networks to secure municipal water filtration systems against automated malware injections.
- In May, 2025, the Industrial Cybersecurity Center released a comprehensive study detailing the technical difficulties faced by utility providers when attempting to install modern intrusion detection sensors on legacy water distribution valves, highlighting the gap between modern security software and existing physical assets.
Research Analyst Overview: Industrial Cyber Physical Security Market
The market has fundamentally shifted from perimeter defense to a proactive posture centered on deep operational visibility. Boardroom conversations now focus on justifying CapEx for advanced platforms that provide behavioral anomaly detection and OT-specific threat intelligence, driven by the need to comply with standards like ISA/IEC 62443.
Software solutions, which constitute a significant portion of the market, are the core of this strategy. These platforms enable comprehensive OT vulnerability management and industrial protocol analysis, which are essential for creating a resilient operational resilience framework. A key focus is on converged IT/OT security, where a unified defense-in-depth for ICS strategy can be implemented.
This involves not only industrial incident response planning but also continuous industrial endpoint protection and secure firmware management to protect the entire production landscape from an evolving range of cyber-physical threats.
Dive into Technavio’s robust research methodology, blending expert interviews, extensive data synthesis, and validated models for unparalleled Industrial Cyber Physical Security Market insights. See full methodology.
| Market Scope | |
|---|---|
| Page number | 305 |
| Base year | 2025 |
| Historic period | 2020-2024 |
| Forecast period | 2026-2030 |
| Growth momentum & CAGR | Accelerate at a CAGR of 10.7% |
| Market growth 2026-2030 | USD 7102.3 million |
| Market structure | Fragmented |
| YoY growth 2025-2026(%) | 10.2% |
| Key countries | US, Canada, Mexico, Germany, UK, France, Italy, The Netherlands, Spain, China, Japan, India, Australia, South Korea, Indonesia, Saudi Arabia, UAE, South Africa, Egypt, Turkey, Brazil, Argentina and Chile |
| Competitive landscape | Leading Companies, Market Positioning of Companies, Competitive Strategies, and Industry Risks |
Industrial Cyber Physical Security Market: Key Questions Answered in This Report
-
What is the expected growth of the Industrial Cyber Physical Security Market between 2026 and 2030?
-
The Industrial Cyber Physical Security Market is expected to grow by USD 7.10 billion during 2026-2030, registering a CAGR of 10.7%. Year-over-year growth in 2026 is estimated at 10.2%%. This acceleration is shaped by proliferation of industry 4.0 and industrial internet of things, which is intensifying demand across multiple end-use verticals covered in the report.
-
-
What segmentation does the market report cover?
-
The report is segmented by Component (Software, Services, and Hardware), Type (Network security, Endpoint security, Cloud security, Application security, and Others), Deployment (On premises, and Cloud based) and Geography (North America, Europe, APAC, Middle East and Africa, South America). Among these, the Software segment is estimated to witness significant growth during the forecast period, driven by rising adoption across key application areas. Each segment includes detailed qualitative and quantitative analysis, along with historical data from 2020-2024 and forecasts through 2030 with year-over-year growth rates.
-
-
Which regions are analyzed in the report?
-
The report covers North America, Europe, APAC, Middle East and Africa and South America. North America is estimated to contribute 37.7% to market growth during the forecast period. Country-level analysis includes US, Canada, Mexico, Germany, UK, France, Italy, The Netherlands, Spain, China, Japan, India, Australia, South Korea, Indonesia, Saudi Arabia, UAE, South Africa, Egypt, Turkey, Brazil, Argentina and Chile, with dedicated market size tables and year-over-year growth for each.
-
-
What are the key growth drivers and market challenges?
-
The primary driver is proliferation of industry 4.0 and industrial internet of things, which is accelerating investment and industry demand. The main challenge is inherent complexity of legacy system integration, creating operational barriers for key market participants. The report quantifies the impact of each driver and challenge across 2026 and 2030 with comparative analysis.
-
-
Who are the major players in the Industrial Cyber Physical Security Market?
-
Key vendors include ABB Ltd., Armis Inc., Belden Inc., Check Point Software Tech Ltd., Cisco Systems Inc., CrowdStrike Inc., Darktrace Holdings Ltd., Forescout Technologies Inc., Fortinet Inc., Hexagon AB, Honeywell International Inc., Microsoft Corp., Nozomi Networks Inc., Palo Alto Networks Inc., Radiflow, Rockwell Automation Inc., Schneider Electric SE, Siemens AG, Tenable Holdings Inc. and Waterfall Security Solutions Ltd.. The report provides qualitative and quantitative analysis categorizing companies as dominant, leading, strong, tentative, and weak based on their market positioning. Company profiles include business segment analysis, SWOT assessment, key offerings, and recent strategic developments.
-
Industrial Cyber Physical Security Market Research Insights
Market dynamics are increasingly shaped by regulatory pressures such as the EU's NIS2 Directive, which compels operators to enhance security measures. This is driving adoption of advanced OT network monitoring and ICS vulnerability scanning across critical infrastructure.
In the energy sector, for instance, utilities are deploying machine learning threat detection to analyze data from SCADA systems, moving beyond traditional perimeter defenses. The growth in the APAC region, at 11.4%, is outpacing North America's 10.7% rate, fueled by massive manufacturing and smart city investments.
This regional activity underscores the global shift toward integrated platforms that support OT security policy enforcement and proactive industrial endpoint hardening to safeguard physical assets.
We can help! Our analysts can customize this industrial cyber physical security market research report to meet your requirements.
 RIA -
RIA - 
