
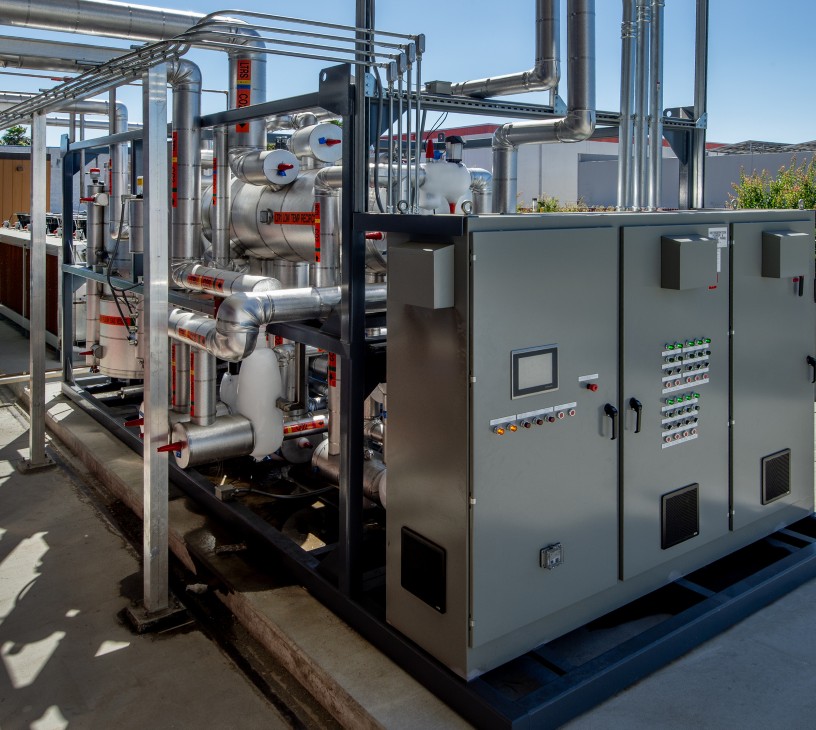

Industrial Heat Pump Systems For High-temperature Applications Market Analysis, Size, and Forecast 2026-2030: APAC (China, Japan, and India), Europe (Germany, France, and UK), North America (US, Canada, and Mexico), Middle East and Africa (UAE, Saudi Arabia, and South Africa), South America (Brazil, Argentina, and Colombia), and Rest of World (ROW)

Industrial Heat Pump Systems For High-temperature Applications Market Analysis, Size, and Forecast 2026-2030:
APAC (China, Japan, and India), Europe (Germany, France, and UK), North America (US, Canada, and Mexico), Middle East and Africa (UAE, Saudi Arabia, and South Africa), South America (Brazil, Argentina, and Colombia), and Rest of World (ROW)

Published: Apr 2026 318 Pages SKU: IRTNTR81435

Market Overview at a Glance

$378.7 Mn
Market Opportunity
6.1%
CAGR 2025 - 2030
35.7%
APAC Growth
$373.8 Mn
Closed cycle mechanical segment 2024

Industrial Heat Pump Systems For High-temperature Applications Market Size 2026-2030

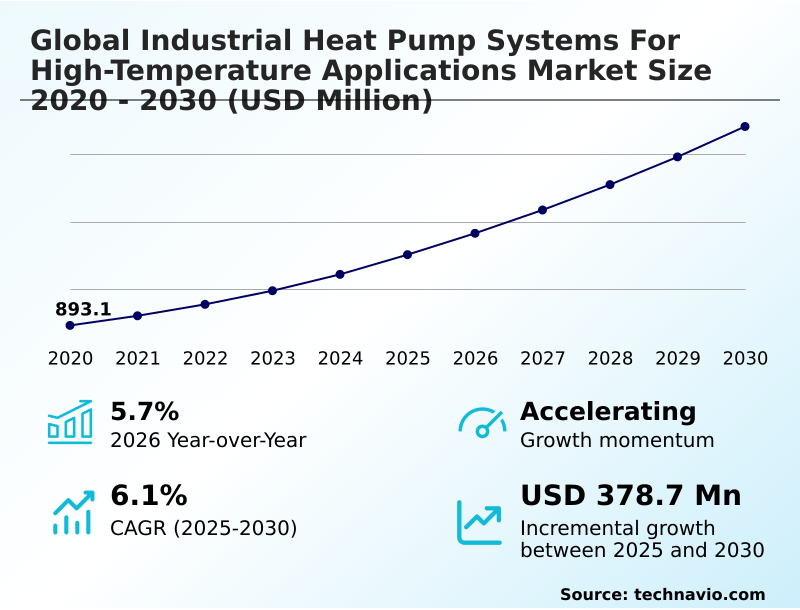
The industrial heat pump systems for high-temperature applications market size is valued to increase by USD 378.7 million, at a CAGR of 6.1% from 2025 to 2030. Stringent environmental regulations and decarbonization mandates will drive the industrial heat pump systems for high-temperature applications market.

Major Market Trends & Insights

  • APAC dominated the market and accounted for a 35.7% growth during the forecast period.
  • By Product - Closed cycle mechanical segment was valued at USD 373.8 million in 2024
  • By Application - Chemical and petrochemical processing segment accounted for the largest market revenue share in 2024

Market Size & Forecast

  • Market Opportunities: USD 587.7 million
  • Market Future Opportunities: USD 378.7 million
  • CAGR from 2025 to 2030 : 6.1%

Market Summary

  • The industrial heat pump systems for high-temperature applications market is undergoing a significant transformation, driven by the urgent need for industrial decarbonization and greater energy efficiency. These systems are pivotal for the industrial energy transition, enabling the electrification of heating processes that traditionally relied on fossil fuels.
  • Key technologies include closed cycle mechanical systems and those utilizing mechanical vapor recompression to upgrade low-grade waste heat into valuable process heat. A primary driver is the enforcement of stringent environmental compliance standards and carbon pricing mechanisms, which create a strong financial case for adopting renewable heating solutions.
  • For instance, a chemical processing facility can integrate a high-temperature heat pump to capture exothermic reaction heat, thereby reducing its natural gas consumption by over 50% and improving operational cost stability. However, challenges such as high initial capital expenditure for retrofitting industrial facilities and inherent technological limits for ultra-high temperature applications persist.
  • Trends like modularity and integration with thermal energy storage are shaping the future, making these systems more adaptable and economically viable for a broader range of industrial process heating needs, from steam generation to drying.

What will be the Size of the Industrial Heat Pump Systems For High-temperature Applications Market during the forecast period?
Get Key Insights on Market Forecast (PDF) Get Free Sample

How is the Industrial Heat Pump Systems For High-temperature Applications Market Segmented?

The industrial heat pump systems for high-temperature applications industry research report provides comprehensive data (region-wise segment analysis), with forecasts and estimates in "USD million" for the period 2026-2030, as well as historical data from 2020-2024 for the following segments.

  • Product
    • Closed cycle mechanical
    • Air source
    • Water source
    • Ground source
  • Application
    • Chemical and petrochemical processing
    • Food and beverage processing
    • Pulp and paper
    • Pharmaceuticals
    • Textiles
  • Capacity
    • 1 to 5 MW
    • Below 1 MW
    • Above 5 MW
  • Geography
    • APAC
      • China
      • Japan
      • India
    • Europe
      • Germany
      • France
      • UK
    • North America
      • US
      • Canada
      • Mexico
    • Middle East and Africa
      • UAE
      • Saudi Arabia
      • South Africa
    • South America
      • Brazil
      • Argentina
      • Colombia
    • Rest of World (ROW)

By Product Insights

The closed cycle mechanical segment is estimated to witness significant growth during the forecast period.

Closed cycle mechanical systems are at the forefront of the industrial energy transition, engineered for demanding high-temperature applications. These systems utilize sophisticated mechanical vapor recompression and advanced vapor compression cycle technology to achieve thermal upgrading.

The use of natural refrigerants like ammonia refrigerant is common, often within a transcritical cycle to maximize efficiency. A centrifugal compressor is central to generating high-grade process heat, enabling the shift toward sustainable thermal energy and renewable heating solutions.

This technology facilitates the decarbonization of heavy industry by delivering exceptional performance, with some systems achieving a coefficient of performance near 6.0, ensuring long-term operational cost stability.
Get Free Sample

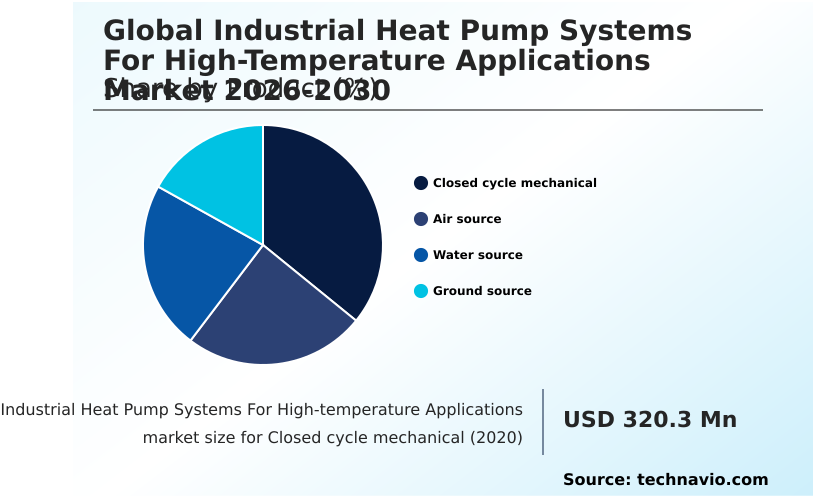
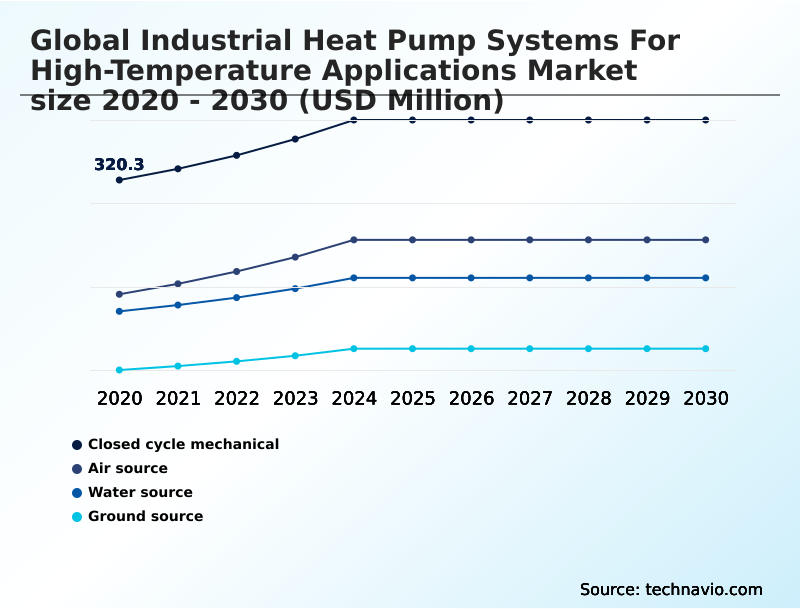
The Closed cycle mechanical segment was valued at USD 373.8 million in 2024 and showed a gradual increase during the forecast period.
Get Free Sample

Regional Analysis

APAC is estimated to contribute 35.7% to the growth of the global market during the forecast period.Technavio’s analysts have elaborately explained the regional trends and drivers that shape the market during the forecast period.
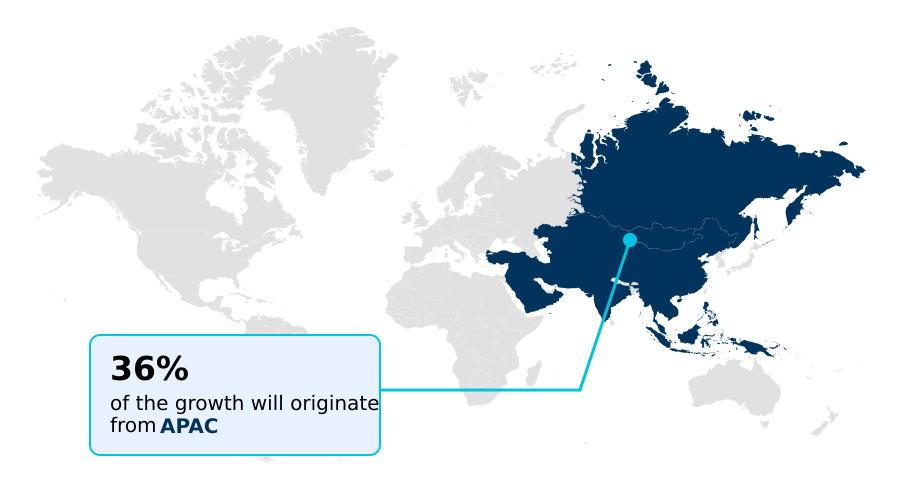
See How Industrial Heat Pump Systems For High-temperature Applications Market Demand is Rising in APAC Get Free Sample

The geographic landscape is defined by regional energy policies and industrial infrastructure. In Europe, the integration with a district heating network is common, leveraging industrial waste heat to support municipal climate action commitments and creating a strategic corporate advantage.

In North America, industrial electrification is driven by a mix of corporate industrial sustainability goals and available incentives. Different technologies, such as air-source heat pump and ground-source heat pump systems, are deployed based on climate and geology.

The push for decarbonization of heavy industry is global, influenced by factors like the carbon border adjustment mechanism, which pressures regions to adopt renewable heating solutions and sustainable thermal energy for high-temperature applications to optimize their supply chain.

Market Dynamics

Our researchers analyzed the data with 2025 as the base year, along with the key drivers, trends, and challenges. A holistic analysis of drivers will help companies refine their marketing strategies to gain a competitive advantage.

  • Strategic decision-making in the industrial sector increasingly involves evaluating the economic benefits of industrial heat pumps against traditional methods. The debate over a heat pump versus a natural gas boiler is now central to capital planning, especially for decarbonizing industrial steam production.
  • Key considerations include the total cost of industrial heat pump systems and the potential for high cop heat pump systems to deliver long-term savings. For instance, in food processing, the use of a heat pump in food pasteurization is becoming standard practice due to its efficiency. Similarly, an ammonia heat pump industrial use case in chemical processing showcases its robustness.
  • However, ultra-high temperature heat pump limitations remain a significant factor for industries like steel and cement. This has accelerated interest in modular heat pump for manufacturing designs, which offer scalability. The challenges in industrial electrification, such as retrofitting boilers with heat pumps, are being addressed through better system integration.
  • Technologies like the ground source heat pump for industrial use and waste heat valorization technologies are critical for reducing the carbon footprint in textiles and enabling the electrification of pulp and paper mills.
  • Even a heat pump for pharmaceutical sterilization must meet stringent validation, with modern systems demonstrating superior temperature control, improving process consistency by a notable margin compared to older boiler-based setups.
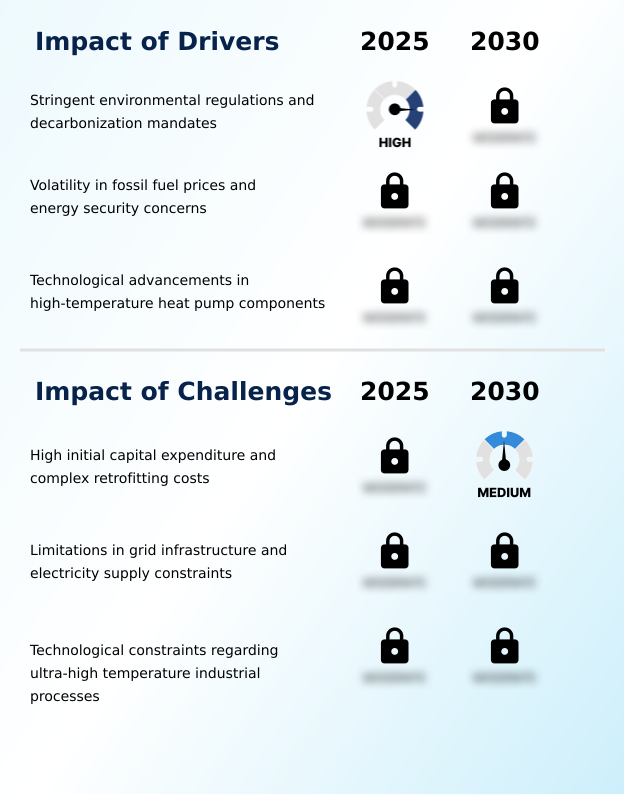
What are the key market drivers leading to the rise in the adoption of Industrial Heat Pump Systems For High-temperature Applications Industry?

  • Stringent environmental regulations and widespread decarbonization mandates are key drivers propelling market growth.

  • The push for industrial decarbonization is a primary driver, compelling facilities to adopt systems with superior waste heat recovery capabilities.
  • Advancements in thermodynamic cycle efficiency and heat exchanger efficiency are critical, with modern systems delivering a coefficient of performance more than three times higher than conventional electric heating.
  • Innovations include the use of cascaded cycle heat pump designs, variable speed drive technology, and novel high-temperature refrigerant options to meet net-zero emission targets. These technologies form the backbone of a zero-emission thermal infrastructure.
  • However, their deployment is sometimes paced by the need for capital expenditure reduction and complexities in retrofitting industrial facilities, which can be partially offset by government incentives aimed at mitigating energy security concerns and overcoming grid infrastructure limitations.

What are the market trends shaping the Industrial Heat Pump Systems For High-temperature Applications Industry?

  • The integration of industrial heat pumps with advanced thermal energy storage systems is an emerging market trend. This strategic coupling addresses the mismatch between electricity availability and process heat demand.

  • A key market evolution involves integrating high-temperature heat pumps with advanced thermal management systems, particularly thermal energy storage. This allows facilities to leverage off-peak electricity for process steam generation, storing energy via sensible heat storage or more advanced latent heat storage using phase change materials.
  • The adoption of skid-mounted modular units enhances scalability, supporting circular economy principles by enabling phased capital investment. This trend, coupled with the rising use of water-source heat pump technology, is reshaping industrial heating.
  • Some firms are exploring energy-as-a-service contracts to manage these complex systems, which also helps ensure environmental compliance with evolving carbon pricing mechanisms, as adoption rates for these integrated solutions have increased by over 15% in certain sectors.

What challenges does the Industrial Heat Pump Systems For High-temperature Applications Industry face during its growth?

  • High initial capital expenditure, coupled with the complexities of retrofitting existing facilities, presents a key challenge to market expansion.

  • A significant challenge is the limitation of the electrified thermal process in reaching the ultra-high temperature ranges required by some heavy industries. While thermodynamic optimization has improved, current systems using a turbo-compressor struggle to surpass certain thermal thresholds, complicating industrial process heating and steam generation. This impacts the return on investment analysis for facilities needing temperatures above 200°C.
  • Enhancing operational resilience through industrial modernization is key, but it requires effective thermal pinch analysis to maximize the use of low-grade waste heat. Firms focused on sustainable manufacturing practices are navigating these constraints by applying heat pumps where feasible, supported by energy transition mechanisms that improve energy efficiency optimization by up to 40% in targeted applications.

Exclusive Technavio Analysis on Customer Landscape

The industrial heat pump systems for high-temperature applications market forecasting report includes the adoption lifecycle of the market, covering from the innovator’s stage to the laggard’s stage. It focuses on adoption rates in different regions based on penetration. Furthermore, the industrial heat pump systems for high-temperature applications market report also includes key purchase criteria and drivers of price sensitivity to help companies evaluate and develop their market growth analysis strategies.
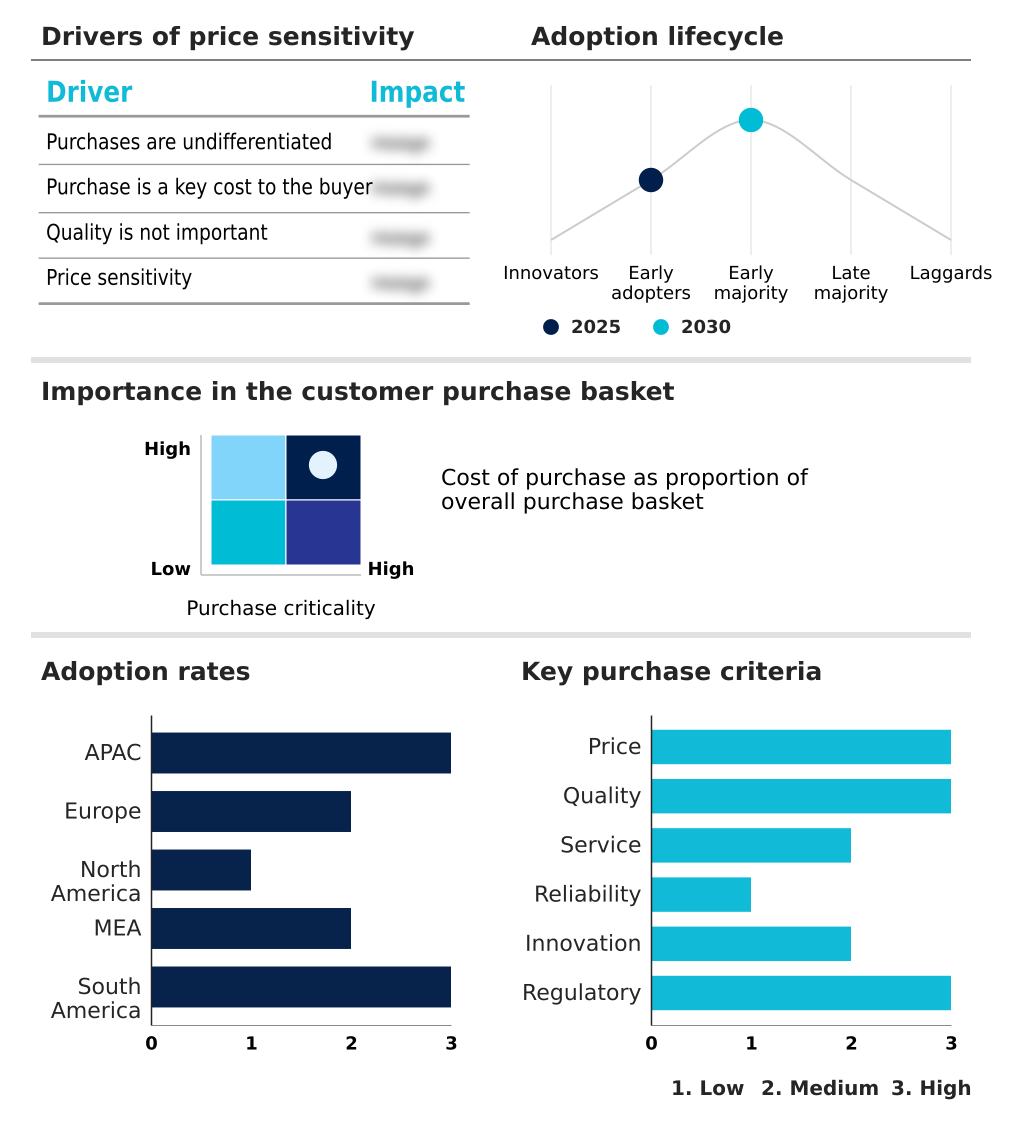
Customer Landscape of Industrial Heat Pump Systems For High-temperature Applications Industry

Competitive Landscape

Companies are implementing various strategies, such as strategic alliances, industrial heat pump systems for high-temperature applications market forecast, partnerships, mergers and acquisitions, geographical expansion, and product/service launches, to enhance their presence in the industry.

Atlas Copco AB - Provides advanced thermal management technologies, including turbocompressor-driven and mechanical vapor recompression systems, to optimize industrial process heating and energy recovery.

The industry research and growth report includes detailed analyses of the competitive landscape of the market and information about key companies, including:

  • Atlas Copco AB
  • Carrier Global Corp.
  • Clade Engineering Systems Ltd
  • Daikin Industries Ltd.
  • Ebara Corp.
  • Enerblue srl
  • ENGIE Refrigeration GmbH
  • Fuji Electric Co. Ltd.
  • GEA Group AG
  • Johnson Controls International
  • Kobe Steel Ltd.
  • MAN Energy Solutions SE
  • MAYEKAWA MFG. Co Ltd
  • Mitsubishi Heavy Industries
  • OCHSNER Warmepumpen GmbH
  • Oilon Group Oy
  • Siemens AG
  • Star Refrigeration
  • Trane Technologies plc
  • Turboden SpA

Qualitative and quantitative analysis of companies has been conducted to help clients understand the wider business environment as well as the strengths and weaknesses of key industry players. Data is qualitatively analyzed to categorize companies as pure play, category-focused, industry-focused, and diversified; it is quantitatively analyzed to categorize companies as dominant, leading, strong, tentative, and weak.

Recent Development and News in Industrial heat pump systems for high-temperature applications market

  • In August 2024, Daikin launched a new heat pump system for industrial facilities and district heating applications.
  • In September 2024, Triveni Turbines introduced a carbon dioxide-based high-temperature heat pump, capable of producing heat up to 122°C with a high coefficient of performance.
  • In October 2024, Mitsubishi Heavy Industries Thermal Systems, Ltd. launched the ETI-W, a centrifugal heat pump designed to recover factory waste heat for water heating up to 90°C.
  • In January 2025, LG Electronics Inc. strengthened its position in the global HVAC market by acquiring OSO Hotwater, a major European provider of water heating solutions.

Dive into Technavio’s robust research methodology, blending expert interviews, extensive data synthesis, and validated models for unparalleled Industrial Heat Pump Systems For High-temperature Applications Market insights. See full methodology.

Market Scope
Page number 318
Base year 2025
Historic period 2020-2024
Forecast period 2026-2030
Growth momentum & CAGR Accelerate at a CAGR of 6.1%
Market growth 2026-2030 USD 378.7 million
Market structure Fragmented
YoY growth 2025-2026(%) 5.7%
Key countries China, Japan, India, South Korea, Australia, Indonesia, Germany, France, UK, Italy, The Netherlands, Spain, US, Canada, Mexico, UAE, Saudi Arabia, South Africa, Turkey, Israel, Brazil, Argentina and Colombia
Competitive landscape Leading Companies, Market Positioning of Companies, Competitive Strategies, and Industry Risks

Request Free Sample

Research Analyst Overview

  • The market is defined by a continuous drive for industrial decarbonization, with technologies like the closed cycle mechanical system and mechanical vapor recompression at the forefront. Innovations in the thermodynamic cycle, including the transcritical cycle, enable the use of high-temperature refrigerant options such as ammonia refrigerant to achieve superior heat exchanger efficiency and a higher coefficient of performance.
  • These advancements are critical for industrial thermal management and the electrification of heating, supporting applications from process steam generation to feeding a district heating network. The integration of a variable speed drive and cascaded cycle heat pump designs allows for precise thermal upgrading of low-grade waste heat.
  • As part of the industrial energy transition, facilities are implementing skid-mounted modular units for both sensible heat storage and latent heat storage, using phase change materials. This pivot to an electrified thermal process, supported by thermal pinch analysis, is essential for reaching process heat temperatures exceeding 160°C, a critical threshold for many manufacturing operations.

What are the Key Data Covered in this Industrial Heat Pump Systems For High-temperature Applications Market Research and Growth Report?

  • What is the expected growth of the Industrial Heat Pump Systems For High-temperature Applications Market between 2026 and 2030?

    • USD 378.7 million, at a CAGR of 6.1%

  • What segmentation does the market report cover?

    • The report is segmented by Product (Closed cycle mechanical, Air source, Water source, and Ground source), Application (Chemical and petrochemical processing, Food and beverage processing, Pulp and paper, Pharmaceuticals, and Textiles), Capacity (1 to 5 MW, Below 1 MW, and Above 5 MW) and Geography (APAC, Europe, North America, Middle East and Africa, South America)

  • Which regions are analyzed in the report?

    • APAC, Europe, North America, Middle East and Africa and South America

  • What are the key growth drivers and market challenges?

    • Stringent environmental regulations and decarbonization mandates, High initial capital expenditure and complex retrofitting costs

  • Who are the major players in the Industrial Heat Pump Systems For High-temperature Applications Market?

    • Atlas Copco AB, Carrier Global Corp., Clade Engineering Systems Ltd, Daikin Industries Ltd., Ebara Corp., Enerblue srl, ENGIE Refrigeration GmbH, Fuji Electric Co. Ltd., GEA Group AG, Johnson Controls International, Kobe Steel Ltd., MAN Energy Solutions SE, MAYEKAWA MFG. Co Ltd, Mitsubishi Heavy Industries, OCHSNER Warmepumpen GmbH, Oilon Group Oy, Siemens AG, Star Refrigeration, Trane Technologies plc and Turboden SpA

Market Research Insights

  • The market's dynamics are shaped by a push for sustainable manufacturing practices and enhanced operational resilience. The adoption of advanced thermal management technologies is critical for companies targeting net-zero emission goals, with facilities achieving up to a threefold increase in heating efficiency compared to conventional electric systems.
  • This shift is influenced by energy security concerns and volatile fossil fuel prices, making the operational cost stability of electrified solutions highly attractive. Industrial modernization efforts are supported by energy transition mechanisms, leading to a 35.7% market share contribution from regions with aggressive industrial energy transition policies.
  • The focus on circular economy principles is also driving innovation, as capturing and upgrading industrial waste heat aligns with both economic and environmental compliance objectives, strengthening a firm's strategic corporate advantage.

We can help! Our analysts can customize this industrial heat pump systems for high-temperature applications market research report to meet your requirements.

Get in touch

1. Executive Summary

1.1 Market overview

Executive Summary - Chart on Market Overview
Executive Summary - Data Table on Market Overview
Executive Summary - Chart on Global Market Characteristics
Executive Summary - Chart on Market by Geography
Executive Summary - Chart on Market Segmentation by Product
Executive Summary - Chart on Market Segmentation by Application
Executive Summary - Chart on Market Segmentation by Capacity
Executive Summary - Chart on Incremental Growth
Executive Summary - Data Table on Incremental Growth
Executive Summary - Chart on Company Market Positioning

2. Technavio Analysis

2.1 Analysis of price sensitivity, lifecycle, customer purchase basket, adoption rates, and purchase criteria

2.2 Criticality of inputs and Factors of differentiation

Chart on Overview on criticality of inputs and factors of differentiation

2.3 Factors of disruption

Chart on Overview on factors of disruption

2.4 Impact of drivers and challenges

Chart on Impact of drivers and challenges in 2025 and 2030

3. Market Landscape

3.1 Market ecosystem

Chart on Parent Market
Data Table on - Parent Market

3.2 Market characteristics

Chart on Market characteristics analysis

3.3 Value chain analysis

Chart on Value chain analysis

4. Market Sizing

4.1 Market definition

Data Table on Offerings of companies included in the market definition

4.2 Market segment analysis

Market segments

4.3 Market size 2025

4.4 Market outlook: Forecast for 2025-2030

Chart on Global - Market size and forecast 2025-2030 ($ million)
Data Table on Global - Market size and forecast 2025-2030 ($ million)
Chart on Global Market: Year-over-year growth 2025-2030 (%)
Data Table on Global Market: Year-over-year growth 2025-2030 (%)

5. Historic Market Size

5.1 Global Industrial Heat Pump Systems For High-Temperature Applications Market 2020 - 2024

Historic Market Size - Data Table on Global Industrial Heat Pump Systems For High-Temperature Applications Market 2020 - 2024 ($ million)

5.2 Product segment analysis 2020 - 2024

Historic Market Size - Product Segment 2020 - 2024 ($ million)

5.3 Application segment analysis 2020 - 2024

Historic Market Size - Application Segment 2020 - 2024 ($ million)

5.4 Capacity segment analysis 2020 - 2024

Historic Market Size - Capacity Segment 2020 - 2024 ($ million)

5.5 Geography segment analysis 2020 - 2024

Historic Market Size - Geography Segment 2020 - 2024 ($ million)

5.6 Country segment analysis 2020 - 2024

Historic Market Size - Country Segment 2020 - 2024 ($ million)

6. Qualitative Analysis

6.1 Impact of AI on Global Industrial Heat Pump Systems for High-Temperature Applications Market

6.2 Impact of Geopolitical conflicts on Global Industrial Heat Pump Systems for High-Temperature Applications Market

7. Five Forces Analysis

7.1 Five forces summary

Five forces analysis - Comparison between 2025 and 2030

7.2 Bargaining power of buyers

Bargaining power of buyers - Impact of key factors 2025 and 2030

7.3 Bargaining power of suppliers

Bargaining power of suppliers - Impact of key factors in 2025 and 2030

7.4 Threat of new entrants

Threat of new entrants - Impact of key factors in 2025 and 2030

7.5 Threat of substitutes

Threat of substitutes - Impact of key factors in 2025 and 2030

7.6 Threat of rivalry

Threat of rivalry - Impact of key factors in 2025 and 2030

7.7 Market condition

Chart on Market condition - Five forces 2025 and 2030

8. Market Segmentation by Product

8.1 Market segments

Chart on Product - Market share 2025-2030 (%)
Data Table on Product - Market share 2025-2030 (%)

8.2 Comparison by Product

Chart on Comparison by Product
Data Table on Comparison by Product

8.3 Closed cycle mechanical - Market size and forecast 2025-2030

Chart on Closed cycle mechanical - Market size and forecast 2025-2030 ($ million)
Data Table on Closed cycle mechanical - Market size and forecast 2025-2030 ($ million)
Chart on Closed cycle mechanical - Year-over-year growth 2025-2030 (%)
Data Table on Closed cycle mechanical - Year-over-year growth 2025-2030 (%)

8.4 Air source - Market size and forecast 2025-2030

Chart on Air source - Market size and forecast 2025-2030 ($ million)
Data Table on Air source - Market size and forecast 2025-2030 ($ million)
Chart on Air source - Year-over-year growth 2025-2030 (%)
Data Table on Air source - Year-over-year growth 2025-2030 (%)

8.5 Water source - Market size and forecast 2025-2030

Chart on Water source - Market size and forecast 2025-2030 ($ million)
Data Table on Water source - Market size and forecast 2025-2030 ($ million)
Chart on Water source - Year-over-year growth 2025-2030 (%)
Data Table on Water source - Year-over-year growth 2025-2030 (%)

8.6 Ground source - Market size and forecast 2025-2030

Chart on Ground source - Market size and forecast 2025-2030 ($ million)
Data Table on Ground source - Market size and forecast 2025-2030 ($ million)
Chart on Ground source - Year-over-year growth 2025-2030 (%)
Data Table on Ground source - Year-over-year growth 2025-2030 (%)

8.7 Market opportunity by Product

Market opportunity by Product ($ million)
Data Table on Market opportunity by Product ($ million)

9. Market Segmentation by Application

9.1 Market segments

Chart on Application - Market share 2025-2030 (%)
Data Table on Application - Market share 2025-2030 (%)

9.2 Comparison by Application

Chart on Comparison by Application
Data Table on Comparison by Application

9.3 Chemical and petrochemical processing - Market size and forecast 2025-2030

Chart on Chemical and petrochemical processing - Market size and forecast 2025-2030 ($ million)
Data Table on Chemical and petrochemical processing - Market size and forecast 2025-2030 ($ million)
Chart on Chemical and petrochemical processing - Year-over-year growth 2025-2030 (%)
Data Table on Chemical and petrochemical processing - Year-over-year growth 2025-2030 (%)

9.4 Food and beverage processing - Market size and forecast 2025-2030

Chart on Food and beverage processing - Market size and forecast 2025-2030 ($ million)
Data Table on Food and beverage processing - Market size and forecast 2025-2030 ($ million)
Chart on Food and beverage processing - Year-over-year growth 2025-2030 (%)
Data Table on Food and beverage processing - Year-over-year growth 2025-2030 (%)

9.5 Pulp and paper - Market size and forecast 2025-2030

Chart on Pulp and paper - Market size and forecast 2025-2030 ($ million)
Data Table on Pulp and paper - Market size and forecast 2025-2030 ($ million)
Chart on Pulp and paper - Year-over-year growth 2025-2030 (%)
Data Table on Pulp and paper - Year-over-year growth 2025-2030 (%)

9.6 Pharmaceuticals - Market size and forecast 2025-2030

Chart on Pharmaceuticals - Market size and forecast 2025-2030 ($ million)
Data Table on Pharmaceuticals - Market size and forecast 2025-2030 ($ million)
Chart on Pharmaceuticals - Year-over-year growth 2025-2030 (%)
Data Table on Pharmaceuticals - Year-over-year growth 2025-2030 (%)

9.7 Textiles - Market size and forecast 2025-2030

Chart on Textiles - Market size and forecast 2025-2030 ($ million)
Data Table on Textiles - Market size and forecast 2025-2030 ($ million)
Chart on Textiles - Year-over-year growth 2025-2030 (%)
Data Table on Textiles - Year-over-year growth 2025-2030 (%)

9.8 Market opportunity by Application

Market opportunity by Application ($ million)
Data Table on Market opportunity by Application ($ million)

10. Market Segmentation by Capacity

10.1 Market segments

Chart on Capacity - Market share 2025-2030 (%)
Data Table on Capacity - Market share 2025-2030 (%)

10.2 Comparison by Capacity

Chart on Comparison by Capacity
Data Table on Comparison by Capacity

10.3 1 to 5 MW - Market size and forecast 2025-2030

Chart on 1 to 5 MW - Market size and forecast 2025-2030 ($ million)
Data Table on 1 to 5 MW - Market size and forecast 2025-2030 ($ million)
Chart on 1 to 5 MW - Year-over-year growth 2025-2030 (%)
Data Table on 1 to 5 MW - Year-over-year growth 2025-2030 (%)

10.4 Below 1 MW - Market size and forecast 2025-2030

Chart on Below 1 MW - Market size and forecast 2025-2030 ($ million)
Data Table on Below 1 MW - Market size and forecast 2025-2030 ($ million)
Chart on Below 1 MW - Year-over-year growth 2025-2030 (%)
Data Table on Below 1 MW - Year-over-year growth 2025-2030 (%)

10.5 Above 5 MW - Market size and forecast 2025-2030

Chart on Above 5 MW - Market size and forecast 2025-2030 ($ million)
Data Table on Above 5 MW - Market size and forecast 2025-2030 ($ million)
Chart on Above 5 MW - Year-over-year growth 2025-2030 (%)
Data Table on Above 5 MW - Year-over-year growth 2025-2030 (%)

10.6 Market opportunity by Capacity

Market opportunity by Capacity ($ million)
Data Table on Market opportunity by Capacity ($ million)

11. Customer Landscape

11.1 Customer landscape overview

Analysis of price sensitivity, lifecycle, customer purchase basket, adoption rates, and purchase criteria

12. Geographic Landscape

12.1 Geographic segmentation

Chart on Market share by geography 2025-2030 (%)
Data Table on Market share by geography 2025-2030 (%)

12.2 Geographic comparison

Chart on Geographic comparison
Data Table on Geographic comparison

12.3 APAC - Market size and forecast 2025-2030

Chart on APAC - Market size and forecast 2025-2030 ($ million)
Data Table on APAC - Market size and forecast 2025-2030 ($ million)
Chart on APAC - Year-over-year growth 2025-2030 (%)
Data Table on APAC - Year-over-year growth 2025-2030 (%)
Chart on Regional Comparison - APAC
Data Table on Regional Comparison - APAC

12.3.1 China - Market size and forecast 2025-2030

Chart on China - Market size and forecast 2025-2030 ($ million)
Data Table on China - Market size and forecast 2025-2030 ($ million)
Chart on China - Year-over-year growth 2025-2030 (%)
Data Table on China - Year-over-year growth 2025-2030 (%)

12.3.2 Japan - Market size and forecast 2025-2030

Chart on Japan - Market size and forecast 2025-2030 ($ million)
Data Table on Japan - Market size and forecast 2025-2030 ($ million)
Chart on Japan - Year-over-year growth 2025-2030 (%)
Data Table on Japan - Year-over-year growth 2025-2030 (%)

12.3.3 India - Market size and forecast 2025-2030

Chart on India - Market size and forecast 2025-2030 ($ million)
Data Table on India - Market size and forecast 2025-2030 ($ million)
Chart on India - Year-over-year growth 2025-2030 (%)
Data Table on India - Year-over-year growth 2025-2030 (%)

12.3.4 South Korea - Market size and forecast 2025-2030

Chart on South Korea - Market size and forecast 2025-2030 ($ million)
Data Table on South Korea - Market size and forecast 2025-2030 ($ million)
Chart on South Korea - Year-over-year growth 2025-2030 (%)
Data Table on South Korea - Year-over-year growth 2025-2030 (%)

12.3.5 Australia - Market size and forecast 2025-2030

Chart on Australia - Market size and forecast 2025-2030 ($ million)
Data Table on Australia - Market size and forecast 2025-2030 ($ million)
Chart on Australia - Year-over-year growth 2025-2030 (%)
Data Table on Australia - Year-over-year growth 2025-2030 (%)

12.3.6 Indonesia - Market size and forecast 2025-2030

Chart on Indonesia - Market size and forecast 2025-2030 ($ million)
Data Table on Indonesia - Market size and forecast 2025-2030 ($ million)
Chart on Indonesia - Year-over-year growth 2025-2030 (%)
Data Table on Indonesia - Year-over-year growth 2025-2030 (%)

12.4 Europe - Market size and forecast 2025-2030

Chart on Europe - Market size and forecast 2025-2030 ($ million)
Data Table on Europe - Market size and forecast 2025-2030 ($ million)
Chart on Europe - Year-over-year growth 2025-2030 (%)
Data Table on Europe - Year-over-year growth 2025-2030 (%)
Chart on Regional Comparison - Europe
Data Table on Regional Comparison - Europe

12.4.1 Germany - Market size and forecast 2025-2030

Chart on Germany - Market size and forecast 2025-2030 ($ million)
Data Table on Germany - Market size and forecast 2025-2030 ($ million)
Chart on Germany - Year-over-year growth 2025-2030 (%)
Data Table on Germany - Year-over-year growth 2025-2030 (%)

12.4.2 France - Market size and forecast 2025-2030

Chart on France - Market size and forecast 2025-2030 ($ million)
Data Table on France - Market size and forecast 2025-2030 ($ million)
Chart on France - Year-over-year growth 2025-2030 (%)
Data Table on France - Year-over-year growth 2025-2030 (%)

12.4.3 UK - Market size and forecast 2025-2030

Chart on UK - Market size and forecast 2025-2030 ($ million)
Data Table on UK - Market size and forecast 2025-2030 ($ million)
Chart on UK - Year-over-year growth 2025-2030 (%)
Data Table on UK - Year-over-year growth 2025-2030 (%)

12.4.4 Italy - Market size and forecast 2025-2030

Chart on Italy - Market size and forecast 2025-2030 ($ million)
Data Table on Italy - Market size and forecast 2025-2030 ($ million)
Chart on Italy - Year-over-year growth 2025-2030 (%)
Data Table on Italy - Year-over-year growth 2025-2030 (%)

12.4.5 The Netherlands - Market size and forecast 2025-2030

Chart on The Netherlands - Market size and forecast 2025-2030 ($ million)
Data Table on The Netherlands - Market size and forecast 2025-2030 ($ million)
Chart on The Netherlands - Year-over-year growth 2025-2030 (%)
Data Table on The Netherlands - Year-over-year growth 2025-2030 (%)

12.4.6 Spain - Market size and forecast 2025-2030

Chart on Spain - Market size and forecast 2025-2030 ($ million)
Data Table on Spain - Market size and forecast 2025-2030 ($ million)
Chart on Spain - Year-over-year growth 2025-2030 (%)
Data Table on Spain - Year-over-year growth 2025-2030 (%)

12.5 North America - Market size and forecast 2025-2030

Chart on North America - Market size and forecast 2025-2030 ($ million)
Data Table on North America - Market size and forecast 2025-2030 ($ million)
Chart on North America - Year-over-year growth 2025-2030 (%)
Data Table on North America - Year-over-year growth 2025-2030 (%)
Chart on Regional Comparison - North America
Data Table on Regional Comparison - North America

12.5.1 US - Market size and forecast 2025-2030

Chart on US - Market size and forecast 2025-2030 ($ million)
Data Table on US - Market size and forecast 2025-2030 ($ million)
Chart on US - Year-over-year growth 2025-2030 (%)
Data Table on US - Year-over-year growth 2025-2030 (%)

12.5.2 Canada - Market size and forecast 2025-2030

Chart on Canada - Market size and forecast 2025-2030 ($ million)
Data Table on Canada - Market size and forecast 2025-2030 ($ million)
Chart on Canada - Year-over-year growth 2025-2030 (%)
Data Table on Canada - Year-over-year growth 2025-2030 (%)

12.5.3 Mexico - Market size and forecast 2025-2030

Chart on Mexico - Market size and forecast 2025-2030 ($ million)
Data Table on Mexico - Market size and forecast 2025-2030 ($ million)
Chart on Mexico - Year-over-year growth 2025-2030 (%)
Data Table on Mexico - Year-over-year growth 2025-2030 (%)

12.6 Middle East and Africa - Market size and forecast 2025-2030

Chart on Middle East and Africa - Market size and forecast 2025-2030 ($ million)
Data Table on Middle East and Africa - Market size and forecast 2025-2030 ($ million)
Chart on Middle East and Africa - Year-over-year growth 2025-2030 (%)
Data Table on Middle East and Africa - Year-over-year growth 2025-2030 (%)
Chart on Regional Comparison - Middle East and Africa
Data Table on Regional Comparison - Middle East and Africa

12.6.1 UAE - Market size and forecast 2025-2030

Chart on UAE - Market size and forecast 2025-2030 ($ million)
Data Table on UAE - Market size and forecast 2025-2030 ($ million)
Chart on UAE - Year-over-year growth 2025-2030 (%)
Data Table on UAE - Year-over-year growth 2025-2030 (%)

12.6.2 Saudi Arabia - Market size and forecast 2025-2030

Chart on Saudi Arabia - Market size and forecast 2025-2030 ($ million)
Data Table on Saudi Arabia - Market size and forecast 2025-2030 ($ million)
Chart on Saudi Arabia - Year-over-year growth 2025-2030 (%)
Data Table on Saudi Arabia - Year-over-year growth 2025-2030 (%)

12.6.3 South Africa - Market size and forecast 2025-2030

Chart on South Africa - Market size and forecast 2025-2030 ($ million)
Data Table on South Africa - Market size and forecast 2025-2030 ($ million)
Chart on South Africa - Year-over-year growth 2025-2030 (%)
Data Table on South Africa - Year-over-year growth 2025-2030 (%)

12.6.4 Turkey - Market size and forecast 2025-2030

Chart on Turkey - Market size and forecast 2025-2030 ($ million)
Data Table on Turkey - Market size and forecast 2025-2030 ($ million)
Chart on Turkey - Year-over-year growth 2025-2030 (%)
Data Table on Turkey - Year-over-year growth 2025-2030 (%)

12.6.5 Israel - Market size and forecast 2025-2030

Chart on Israel - Market size and forecast 2025-2030 ($ million)
Data Table on Israel - Market size and forecast 2025-2030 ($ million)
Chart on Israel - Year-over-year growth 2025-2030 (%)
Data Table on Israel - Year-over-year growth 2025-2030 (%)

12.7 South America - Market size and forecast 2025-2030

Chart on South America - Market size and forecast 2025-2030 ($ million)
Data Table on South America - Market size and forecast 2025-2030 ($ million)
Chart on South America - Year-over-year growth 2025-2030 (%)
Data Table on South America - Year-over-year growth 2025-2030 (%)
Chart on Regional Comparison - South America
Data Table on Regional Comparison - South America

12.7.1 Brazil - Market size and forecast 2025-2030

Chart on Brazil - Market size and forecast 2025-2030 ($ million)
Data Table on Brazil - Market size and forecast 2025-2030 ($ million)
Chart on Brazil - Year-over-year growth 2025-2030 (%)
Data Table on Brazil - Year-over-year growth 2025-2030 (%)

12.7.2 Argentina - Market size and forecast 2025-2030

Chart on Argentina - Market size and forecast 2025-2030 ($ million)
Data Table on Argentina - Market size and forecast 2025-2030 ($ million)
Chart on Argentina - Year-over-year growth 2025-2030 (%)
Data Table on Argentina - Year-over-year growth 2025-2030 (%)

12.7.3 Colombia - Market size and forecast 2025-2030

Chart on Colombia - Market size and forecast 2025-2030 ($ million)
Data Table on Colombia - Market size and forecast 2025-2030 ($ million)
Chart on Colombia - Year-over-year growth 2025-2030 (%)
Data Table on Colombia - Year-over-year growth 2025-2030 (%)

12.8 Market opportunity by geography

Market opportunity by geography ($ million)
Data Tables on Market opportunity by geography ($ million)

13. Drivers, Challenges, and Opportunity

13.1 Market drivers

Stringent environmental regulations and decarbonization mandates
Volatility in fossil fuel prices and energy security concerns
Technological advancements in high-temperature heat pump components

13.2 Market challenges

High initial capital expenditure and complex retrofitting costs
Limitations in grid infrastructure and electricity supply constraints
Technological constraints regarding ultra-high temperature industrial processes

13.3 Impact of drivers and challenges

Impact of drivers and challenges in 2025 and 2030

13.4 Market opportunities

Integration of industrial heat pumps with thermal energy storage systems
Increasing adoption within food and beverage processing sector
Transition toward modular and scalable system architectures

14. Competitive Landscape

14.1 Overview

14.2

Overview on criticality of inputs and factors of differentiation

14.3 Landscape disruption

Overview on factors of disruption

14.4 Industry risks

Impact of key risks on business

15. Competitive Analysis

15.1 Companies profiled

Companies covered

15.2 Company ranking index

15.3 Market positioning of companies

Matrix on companies position and classification

15.4 Atlas Copco AB

Atlas Copco AB - Overview
Atlas Copco AB - Business segments
Atlas Copco AB - Key offerings
Atlas Copco AB - Segment focus
SWOT

15.5 Carrier Global Corp.

Carrier Global Corp. - Overview
Carrier Global Corp. - Business segments
Carrier Global Corp. - Key news
Carrier Global Corp. - Key offerings
Carrier Global Corp. - Segment focus
SWOT

15.6 Daikin Industries Ltd.

Daikin Industries Ltd. - Overview
Daikin Industries Ltd. - Business segments
Daikin Industries Ltd. - Key offerings
Daikin Industries Ltd. - Segment focus
SWOT

15.7 Ebara Corp.

Ebara Corp. - Overview
Ebara Corp. - Business segments
Ebara Corp. - Key offerings
Ebara Corp. - Segment focus
SWOT

15.8 Fuji Electric Co. Ltd.

Fuji Electric Co. Ltd. - Overview
Fuji Electric Co. Ltd. - Business segments
Fuji Electric Co. Ltd. - Key offerings
Fuji Electric Co. Ltd. - Segment focus
SWOT

15.9 GEA Group AG

GEA Group AG - Overview
GEA Group AG - Business segments
GEA Group AG - Key offerings
GEA Group AG - Segment focus
SWOT

15.10 Johnson Controls International

Johnson Controls International - Overview
Johnson Controls International - Business segments
Johnson Controls International - Key news
Johnson Controls International - Key offerings
Johnson Controls International - Segment focus
SWOT

15.11 MAN Energy Solutions SE

MAN Energy Solutions SE - Overview
MAN Energy Solutions SE - Product / Service
MAN Energy Solutions SE - Key offerings
SWOT

15.12 MAYEKAWA MFG. Co Ltd

MAYEKAWA MFG. Co Ltd - Overview
MAYEKAWA MFG. Co Ltd - Product / Service
MAYEKAWA MFG. Co Ltd - Key offerings
SWOT

15.13 Mitsubishi Heavy Industries

Mitsubishi Heavy Industries - Overview
Mitsubishi Heavy Industries - Business segments
Mitsubishi Heavy Industries - Key offerings
Mitsubishi Heavy Industries - Segment focus
SWOT

15.14 Oilon Group Oy

Oilon Group Oy - Overview
Oilon Group Oy - Product / Service
Oilon Group Oy - Key offerings
SWOT

15.15 Siemens AG

Siemens AG - Overview
Siemens AG - Business segments
Siemens AG - Key news
Siemens AG - Key offerings
Siemens AG - Segment focus
SWOT

15.16 Star Refrigeration

Star Refrigeration - Overview
Star Refrigeration - Product / Service
Star Refrigeration - Key offerings
SWOT

15.17 Trane Technologies plc

Trane Technologies plc - Overview
Trane Technologies plc - Business segments
Trane Technologies plc - Key news
Trane Technologies plc - Key offerings
Trane Technologies plc - Segment focus
SWOT

15.18 Turboden SpA

Turboden SpA - Overview
Turboden SpA - Product / Service
Turboden SpA - Key offerings
SWOT

16. Appendix

16.1 Scope of the report

Market definition
Objectives
Notes and caveats

16.2 Inclusions and exclusions checklist

Inclusions checklist
Exclusions checklist

16.3 Currency conversion rates for US$

16.4 Research methodology

16.5 Data procurement

Information sources

16.6 Data validation

16.7 Validation techniques employed for market sizing

16.8 Data synthesis

16.9 360 degree market analysis

16.10 List of abbreviations

Research Methodology

Technavio presents a detailed picture of the market by way of study, synthesis, and summation of data from multiple sources. The analysts have presented the various facets of the market with a particular focus on identifying the key industry influencers. The data thus presented is comprehensive, reliable, and the result of extensive research, both primary and secondary.

INFORMATION SOURCES

Primary sources

  • Manufacturers and suppliers
  • Channel partners
  • Industry experts
  • Strategic decision makers

Secondary sources

  • Industry journals and periodicals
  • Government data
  • Financial reports of key industry players
  • Historical data
  • Press releases

DATA ANALYSIS

Data Synthesis

  • Collation of data
  • Estimation of key figures
  • Analysis of derived insights

Data Validation

  • Triangulation with data models
  • Reference against proprietary databases
  • Corroboration with industry experts

REPORT WRITING

Qualitative

  • Market drivers
  • Market challenges
  • Market trends
  • Five forces analysis

Quantitative

  • Market size and forecast
  • Market segmentation
  • Geographical insights
  • Competitive landscape

Interested in this report?

Get your sample now to see our research methodology and insights!

Download Now

Frequently Asked Questions

Industrial Heat Pump Systems For High-temperature Applications market growth will increase by USD 378.7 million during 2026-2030.

The Industrial Heat Pump Systems For High-temperature Applications market is expected to grow at a CAGR of 6.1% during 2026-2030.

Industrial Heat Pump Systems For High-temperature Applications market is segmented by Product (Closed cycle mechanical, Air source, Water source, Ground source) Application (Chemical and petrochemical processing, Food and beverage processing, Pulp and paper, Pharmaceuticals, Textiles) Capacity (1 to 5 MW, Below 1 MW, Above 5 MW)

Atlas Copco AB, Carrier Global Corp., Clade Engineering Systems Ltd, Daikin Industries Ltd., Ebara Corp., Enerblue srl, ENGIE Refrigeration GmbH, Fuji Electric Co. Ltd., GEA Group AG, Johnson Controls International, Kobe Steel Ltd., MAN Energy Solutions SE, MAYEKAWA MFG. Co Ltd, Mitsubishi Heavy Industries, OCHSNER Warmepumpen GmbH, Oilon Group Oy, Siemens AG, Star Refrigeration, Trane Technologies plc, Turboden SpA are a few of the key vendors in the Industrial Heat Pump Systems For High-temperature Applications market.

APAC will register the highest growth rate of 35.7% among the other regions. Therefore, the Industrial Heat Pump Systems For High-temperature Applications market in APAC is expected to garner significant business opportunities for the vendors during the forecast period.

China, Japan, India, South Korea, Australia, Indonesia, Germany, France, UK, Italy, The Netherlands, Spain, US, Canada, Mexico, UAE, Saudi Arabia, South Africa, Turkey, Israel, Brazil, Argentina, Colombia

  • Stringent environmental regulations and decarbonization mandates is the driving factor this market.

The Industrial Heat Pump Systems For High-temperature Applications market vendors should focus on grabbing business opportunities from the Product segment as it accounted for the largest market share in the base year.
RIA - Research AI Assistant
Ask RIA
