Centrifugal Compressor Market Analysis, Size, and Forecast 2026-2030: APAC (China, India, and Japan), North America (US, Canada, and Mexico), Europe (Germany, UK, and France), Middle East and Africa (Saudi Arabia, UAE, and South Africa), South America (Brazil and Argentina), and Rest of World (ROW)

Centrifugal Compressor Market Analysis, Size, and Forecast 2026-2030:
APAC (China, India, and Japan), North America (US, Canada, and Mexico), Europe (Germany, UK, and France), Middle East and Africa (Saudi Arabia, UAE, and South Africa), South America (Brazil and Argentina), and Rest of World (ROW)

Published: May 2026 313 Pages SKU: IRTNTR73389

Market Overview at a Glance

$4.12 B
Market Opportunity
5.7%
CAGR 2025 - 2030
44.5%
APAC Growth
$6.75 B
Single-stage segment 2024

Centrifugal Compressor Market Size 2026-2030

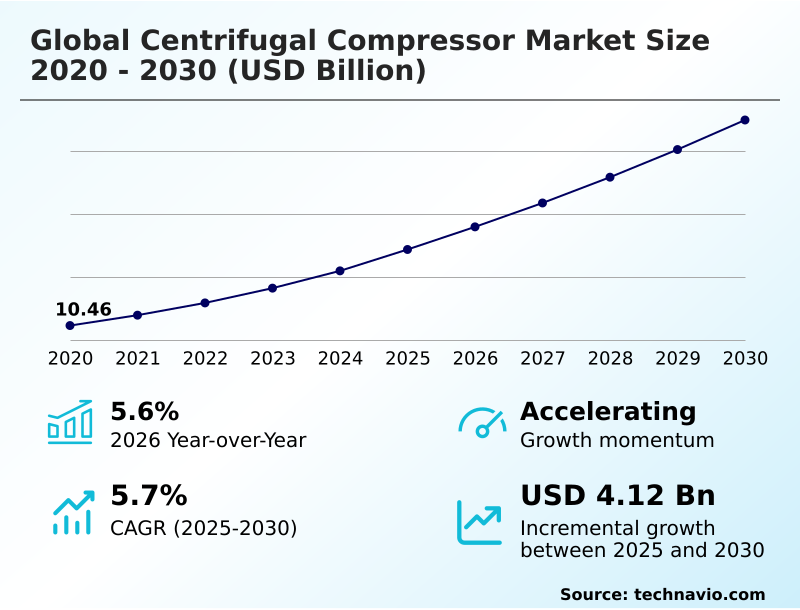
The centrifugal compressor market size is valued to increase by USD 4.12 billion, at a CAGR of 5.7% from 2025 to 2030. Increasing demand for natural gas infrastructure and liquid natural gas exports will drive the centrifugal compressor market.

Major Market Trends & Insights

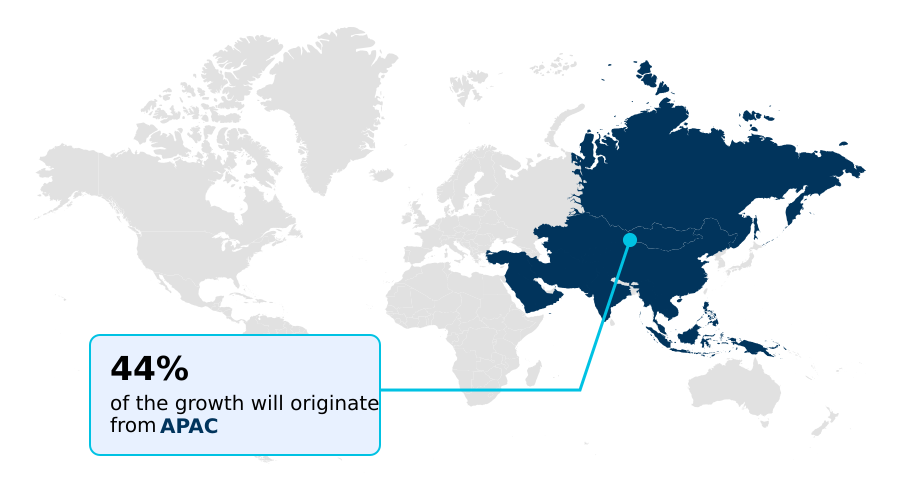
  • APAC dominated the market and accounted for a 44.5% growth during the forecast period.
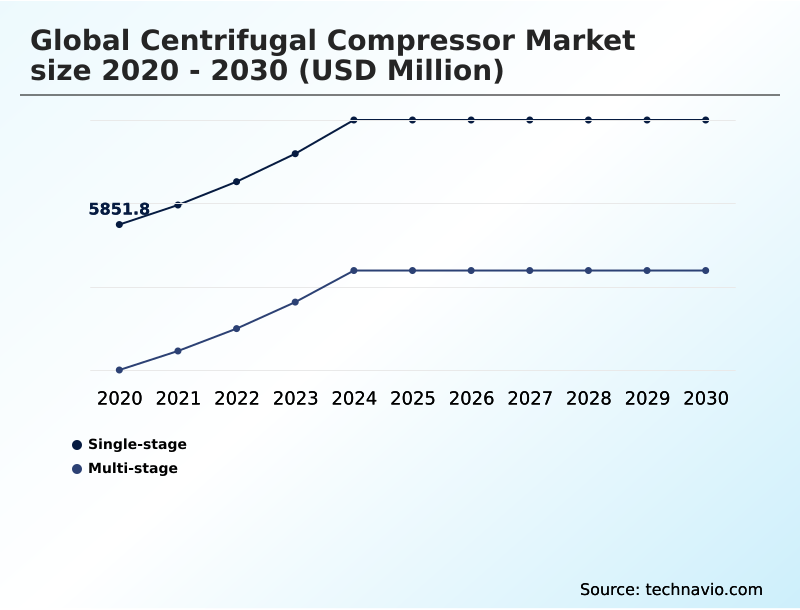
  • By Product - Single-stage segment was valued at USD 6.75 billion in 2024
  • By Variant - Below 20 bars segment accounted for the largest market revenue share in 2024

Market Size & Forecast

  • Market Opportunities: USD 6.54 billion
  • Market Future Opportunities: USD 4.12 billion
  • CAGR from 2025 to 2030 : 5.7%

Market Summary

  • The centrifugal compressor market is integral to large-scale industrial processes, where the demand for energy efficiency and operational reliability is paramount. This market is shaped by the global energy transition, with significant investments in natural gas infrastructure and the emerging hydrogen economy requiring advanced compression technologies.
  • Innovations such as oil-free compression systems are becoming standard in sectors like pharmaceuticals and electronics, where product purity is non-negotiable. At the same time, the adoption of predictive maintenance analytics, enabled by IIoT integration and digital controls, is transforming asset management.
  • For instance, a major petrochemical facility can leverage a digital twin of its process gas compressors to simulate operational stress, predicting potential failures in high-speed bearings or impellers. This allows maintenance to be scheduled proactively, preventing catastrophic failures that could halt production, thereby improving operational efficiency by over 20% and safeguarding revenue.
  • The evolution is toward intelligent, interconnected systems that balance high performance with sustainability, using technologies like magnetic bearings and high-efficiency impellers to reduce energy consumption and extend equipment lifespan. These advancements are critical for handling everything from cryogenic compressors to those used in carbon capture.

What will be the Size of the Centrifugal Compressor Market during the forecast period?

Get Key Insights on Market Forecast (PDF) Get Free Sample

How is the Centrifugal Compressor Market Segmented?

The centrifugal compressor industry research report provides comprehensive data (region-wise segment analysis), with forecasts and estimates in "USD million" for the period 2026-2030, as well as historical data from 2020-2024 for the following segments.

  • Product
    • Single-stage
    • Multi-stage
  • Variant
    • Below 20 bars
    • Between 20 and 200 bars
    • Between 200 and 400 bars
    • Above 400 bars
  • End-user
    • Oil and gas industry
    • Power sector
    • Petrochemical and chemical industries
    • Others
  • Geography
    • APAC
      • China
      • India
      • Japan
    • North America
      • US
      • Canada
      • Mexico
    • Europe
      • Germany
      • UK
      • France
    • Middle East and Africa
      • Saudi Arabia
      • UAE
      • South Africa
    • South America
      • Brazil
      • Argentina
    • Rest of World (ROW)

By Product Insights

The single-stage segment is estimated to witness significant growth during the forecast period.

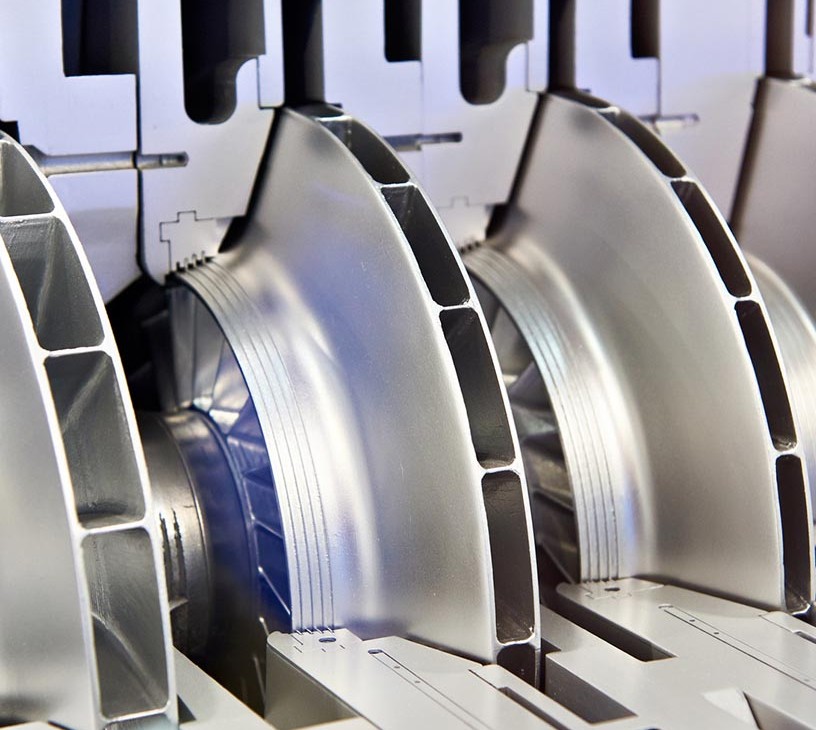
The single-stage design segment is defined by its mechanical simplicity, featuring one impeller to achieve substantial volumetric flow at moderate pressure ratios. This structural approach is ideal for industrial processing, translating into lower capex and a smaller physical footprint.

The reduced mechanical complexity ensures high plant uptime and operational reliability for continuous duty applications. Advancements in computational fluid dynamics are enhancing impeller design and fluid dynamics, pushing thermodynamic performance limits.

Modern aerodynamic efficiency in these units can improve maximized throughput by over 10%, offering optimized lifecycle costs and reduced operational overhead for facility operators who prioritize straightforward integration and exceptional baseline performance.

Get Free Sample

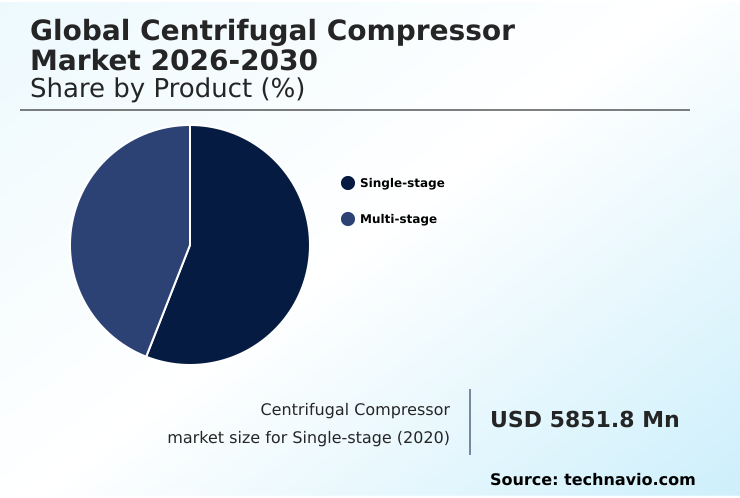
The Single-stage segment was valued at USD 6.75 billion in 2024 and showed a gradual increase during the forecast period.

Get Free Sample

Regional Analysis

APAC is estimated to contribute 44.5% to the growth of the global market during the forecast period.Technavio’s analysts have elaborately explained the regional trends and drivers that shape the market during the forecast period.

See How Centrifugal Compressor Market Demand is Rising in APAC Get Free Sample

The market's geographic landscape is characterized by diverse regional drivers. APAC is poised to contribute over 44% of the market's incremental growth, fueled by rapid industrialization and major infrastructure projects in countries like China and India.

This expansion requires extensive deployment of pipeline compressors for energy transport and turbo compression systems for manufacturing.

In North America, the focus is on maximizing LNG exports and shale gas extraction, creating strong demand for technologies supporting upstream operations and pipeline transmission.

European markets prioritize decarbonization, driving retrofitting of existing assets with high-efficiency components to support applications like flue gas desulfurization and compressed air energy storage.

In South America and the Middle East, the development of deepwater oil reserves and synthetic fuel production relies on specialized cryogenic compressors and systems for gas reinjection and catalytic cracking.

Across these regions, the modernization of oil refining facilities remains a constant source of demand, highlighting the technology's critical role in the global energy and industrial sectors.

Market Dynamics

Our researchers analyzed the data with 2025 as the base year, along with the key drivers, trends, and challenges. A holistic analysis of drivers will help companies refine their marketing strategies to gain a competitive advantage.

  • Strategic decisions in the centrifugal compressor market are increasingly influenced by detailed technical evaluations that go beyond initial costs to consider long-term operational excellence. The debate over centrifugal vs reciprocating compressor efficiency, for instance, requires a nuanced analysis of flow rates, pressure requirements, and maintenance cycles.
  • For applications requiring high-pressure compression, the challenges in high-pressure compression, such as managing rotor stability and material stress, are paramount. This has led to the adoption of advanced solutions like API 617 centrifugal compressors, which adhere to rigorous industry standards for reliability in critical services.
  • Proper centrifugal compressor surge control is essential for preventing catastrophic failures and maximizing equipment lifespan, a key factor in the total cost of ownership. The growing deployment of magnetic bearing centrifugal compressors highlights a shift toward reducing mechanical wear and eliminating lubrication-related contamination.
  • Facilities adopting these advanced systems report a reduction in maintenance-related downtime that is nearly double that of traditional systems, directly impacting supply chain continuity. Understanding the centrifugal compressor performance curve is vital for optimizing energy consumption, particularly when using a variable speed drive centrifugal compressor.
  • Furthermore, the specific demands of centrifugal compressors in the petrochemical industry and for LNG plants are driving innovation in integrally geared centrifugal compressor design and specialized models for air separation and hydrogen service. Effective maintenance of centrifugal gas compressors, including single-stage centrifugal blower applications, remains a cornerstone of operational strategy.

What are the key market drivers leading to the rise in the adoption of Centrifugal Compressor Industry?

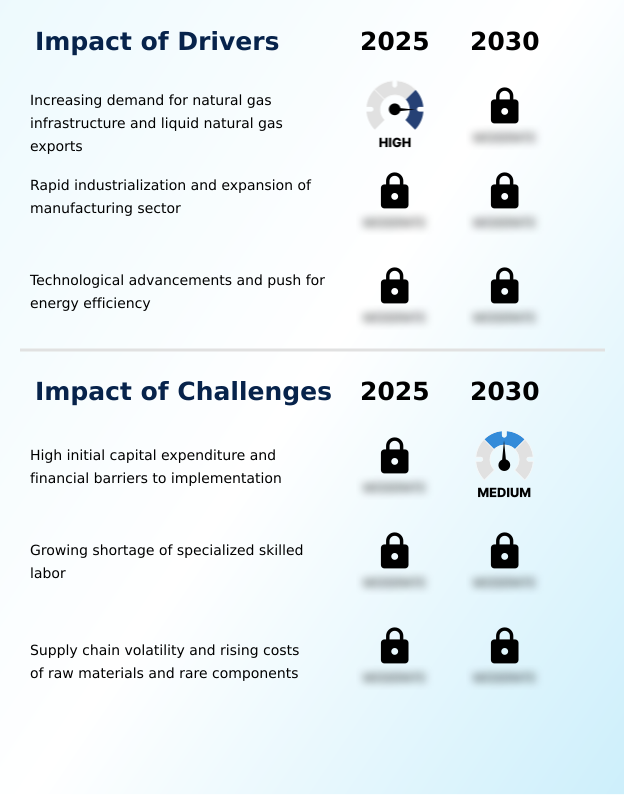
  • The key driver for market growth is the increasing demand for natural gas infrastructure and liquefied natural gas (LNG) exports.

  • Market growth is propelled by compounding demands from the energy and industrial sectors.
  • The global expansion of LNG liquefaction facilities and shale gas extraction in midstream and downstream operations relies on the massive volume handling and continuous flow capacity of these compressors.
  • In manufacturing, the move toward smart factory ecosystems is accelerating the adoption of oil-free compression and advanced process gas compressors.
  • The relentless push for energy efficiency is a primary driver, with new high-efficiency impellers and variable speed drives enabling a reduction in power consumption by up to 18% in continuous-duty applications.
  • In the food and beverage industry, the mandated shift to oil-free systems has reduced product contamination risks by over 99%, safeguarding consumer safety and brand integrity. This convergence of industrial modernization and energy transition underpins sustained market demand.

What are the market trends shaping the Centrifugal Compressor Industry?

  • The integration of digital twin technology and the Industrial Internet of Things (IIoT) is emerging as a significant trend, enabling enhanced predictive analytics for operational optimization.

  • Key trends are reshaping the market, driven by digitalization and sustainability. The adoption of digital twin technology and IIoT integration enables the creation of a virtual replica simulation for real-time performance monitoring. This approach has allowed some operators to improve fault detection accuracy by up to 40%, preventing costly outages.
  • Another major trend is the development of specialized equipment for the green hydrogen economy, where advanced aerodynamic components and corrosion-resistant coatings are essential to manage hydrogen embrittlement. Compressors designed for this purpose are showing efficiency gains of over 15% compared to earlier models.
  • Additionally, the expansion of carbon capture initiatives is increasing demand for integrally geared compressors capable of handling supercritical CO2 for enhanced oil recovery (EOR) and carbon sequestration, pushing the boundaries of high-pressure compression technology.

What challenges does the Centrifugal Compressor Industry face during its growth?

  • A key challenge affecting industry growth is the high initial capital expenditure and associated financial barriers to implementation.

  • The market grapples with significant operational and economic challenges that can impede growth. High capital expenditure remains a primary barrier, while supply chain volatility for critical raw material costs, including high-grade steel and specialized alloys, creates production uncertainties. These disruptions have extended project timelines by an average of 20% for components like high-speed bearings.
  • A pressing issue is the skilled labor shortage, as the increasing technical complexity of modern systems with digital controls, magnetic bearings, and complex aerodynamic components demands a new level of expertise. This talent gap contributes to extended unscheduled downtime, with some firms reporting that it increases average equipment repair times by up to 35%.
  • Furthermore, managing machine performance under partial-load conditions remains a technical hurdle, challenging engineers to maintain efficiency and prevent issues related to rotor dynamics.

Exclusive Technavio Analysis on Customer Landscape

The centrifugal compressor market forecasting report includes the adoption lifecycle of the market, covering from the innovator’s stage to the laggard’s stage. It focuses on adoption rates in different regions based on penetration. Furthermore, the centrifugal compressor market report also includes key purchase criteria and drivers of price sensitivity to help companies evaluate and develop their market growth analysis strategies.

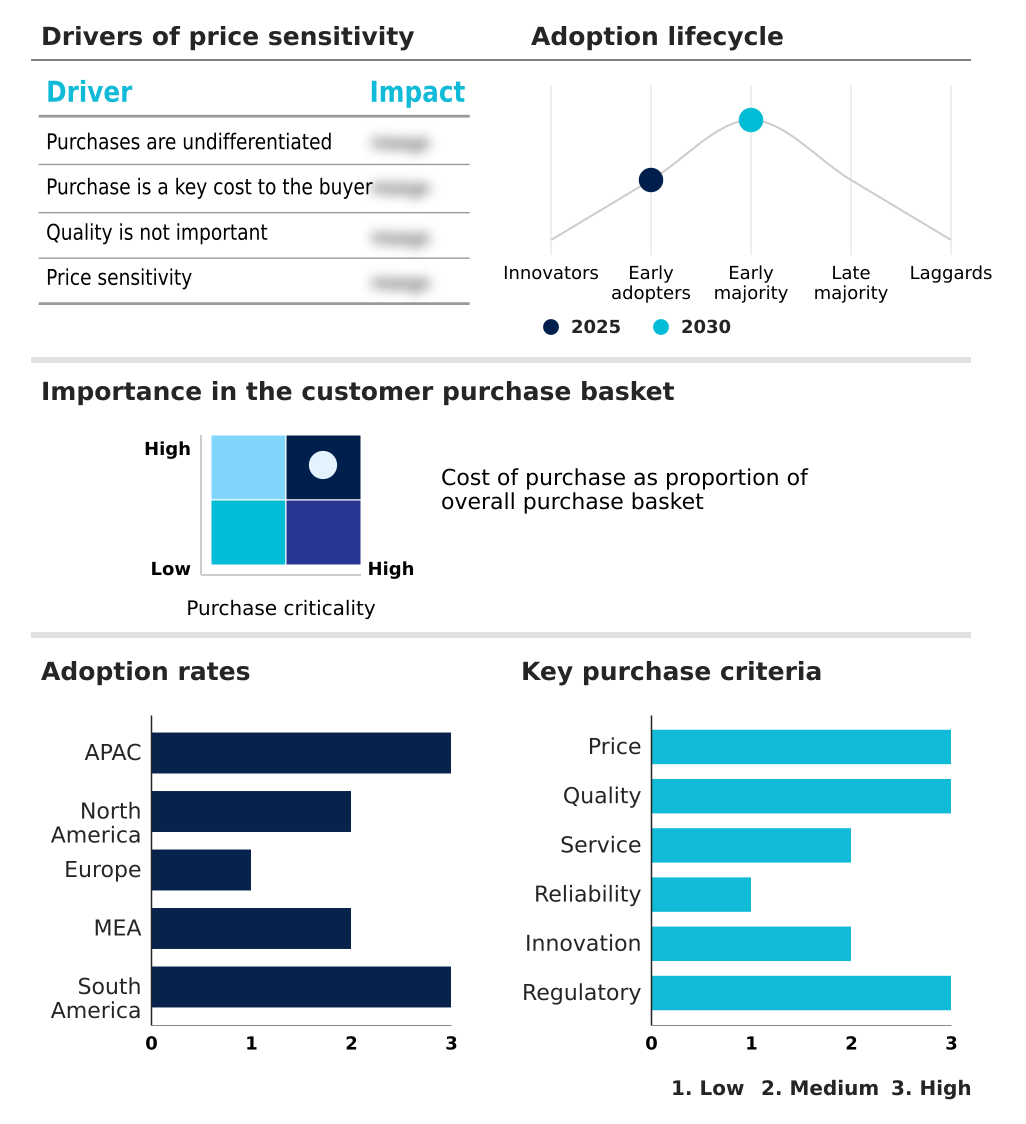
Customer Landscape of Centrifugal Compressor Industry

Competitive Landscape

Companies are implementing various strategies, such as strategic alliances, centrifugal compressor market forecast, partnerships, mergers and acquisitions, geographical expansion, and product/service launches, to enhance their presence in the industry.

Atlas Copco AB - The portfolio features a range of industrial air and gas solutions, with significant emphasis on advanced oil-free centrifugal compression technologies for applications requiring high purity.

The industry research and growth report includes detailed analyses of the competitive landscape of the market and information about key companies, including:

  • Atlas Copco AB
  • Baker Hughes Co.
  • Chart Industries Inc.
  • Ebara Corp.
  • Everllence SE
  • FS ELLIOTT Co. LLC
  • Fusheng Precision Co. Ltd.
  • General Electric Co.
  • Hanwha Power Systems Co Ltd
  • Hitachi Ltd.
  • Honeywell International Inc.
  • IHI Corp.
  • Ingersoll Rand Inc.
  • Kawasaki Heavy Industries Ltd.
  • Kirloskar Pneumatic Co. Ltd.
  • Kobe Steel Ltd.
  • Mitsubishi Heavy Industries
  • Mitsui and Co. Ltd.
  • Siemens Energy AG
  • Sulzer Ltd.

Qualitative and quantitative analysis of companies has been conducted to help clients understand the wider business environment as well as the strengths and weaknesses of key industry players. Data is qualitatively analyzed to categorize companies as pure play, category-focused, industry-focused, and diversified; it is quantitatively analyzed to categorize companies as dominant, leading, strong, tentative, and weak.

Recent Development and News in Centrifugal compressor market

  • In November, 2024, Hanwha Power Systems Co Ltd signed a land lease agreement to construct a new compressor packaging and service center in Saudi Arabia, enhancing its regional manufacturing and support capabilities.
  • In January, 2025, Siemens Energy AG announced a significant expansion of its digital compressor solutions, integrating advanced Industrial Internet of Things (IIoT) platforms to improve predictive maintenance and operational efficiency for its centrifugal compressor fleet.
  • In April, 2025, Baker Hughes Co. secured a major contract to supply advanced gas compression equipment, including multiple centrifugal compressor trains, for a new natural gas pipeline project in Argentina designed to boost LNG export capacity.
  • In May, 2025, Kawasaki Heavy Industries Ltd. successfully completed demonstration trials for its next-generation centrifugal hydrogen compressor, achieving key performance milestones for its use in large-scale hydrogen liquefaction plants.

Dive into Technavio’s robust research methodology, blending expert interviews, extensive data synthesis, and validated models for unparalleled Centrifugal Compressor Market insights. See full methodology.

Market Scope
Page number 313
Base year 2025
Historic period 2020-2024
Forecast period 2026-2030
Growth momentum & CAGR Accelerate at a CAGR of 5.7%
Market growth 2026-2030 USD 4118.3 million
Market structure Fragmented
YoY growth 2025-2026(%) 5.6%
Key countries China, India, Japan, South Korea, Australia, Indonesia, US, Canada, Mexico, Germany, UK, France, Italy, The Netherlands, Spain, Saudi Arabia, UAE, South Africa, Egypt, Turkey, Brazil, Argentina and Chile
Competitive landscape Leading Companies, Market Positioning of Companies, Competitive Strategies, and Industry Risks

Request Free Sample

Research Analyst Overview

  • The centrifugal compressor market remains a cornerstone of modern industry, driven by the relentless pursuit of thermodynamic efficiency and operational uptime. The machinery, ranging from single-stage designs to complex multi-stage compressor configurations, is critical for applications like process gas compressors in chemical synthesis and cryogenic compressors for LNG.
  • A key boardroom-level decision influenced by market trends is the allocation of capital toward digitalization. The adoption of digital twin technology and IIoT integration for predictive maintenance analytics is no longer a niche advantage but a competitive necessity.
  • This strategic shift is justified by clear operational gains; for example, the use of predictive analytics has enabled some operators to reduce critical component failures by over 30%. Innovations like oil-free compression, magnetic bearings, and advanced aerodynamic components are essential for meeting stringent environmental regulations and supporting emerging sectors like the green hydrogen economy and carbon capture and storage (CCS).
  • The focus on high-efficiency impellers and variable speed drives underscores the industry-wide effort to minimize energy consumption, while components like dry gas seals and robust rotor dynamics ensure safety and reliability in handling everything from natural gas to supercritical CO2.

What are the Key Data Covered in this Centrifugal Compressor Market Research and Growth Report?

  • What is the expected growth of the Centrifugal Compressor Market between 2026 and 2030?

    • USD 4.12 billion, at a CAGR of 5.7%

  • What segmentation does the market report cover?

    • The report is segmented by Product (Single-stage, and Multi-stage), Variant (Below 20 bars, Between 20 and 200 bars, Between 200 and 400 bars, and Above 400 bars), End-user (Oil and gas industry, Power sector, Petrochemical and chemical industries, and Others) and Geography (APAC, North America, Europe, Middle East and Africa, South America)

  • Which regions are analyzed in the report?

    • APAC, North America, Europe, Middle East and Africa and South America

  • What are the key growth drivers and market challenges?

    • Increasing demand for natural gas infrastructure and liquid natural gas exports, High initial capital expenditure and financial barriers to implementation

  • Who are the major players in the Centrifugal Compressor Market?

    • Atlas Copco AB, Baker Hughes Co., Chart Industries Inc., Ebara Corp., Everllence SE, FS ELLIOTT Co. LLC, Fusheng Precision Co. Ltd., General Electric Co., Hanwha Power Systems Co Ltd, Hitachi Ltd., Honeywell International Inc., IHI Corp., Ingersoll Rand Inc., Kawasaki Heavy Industries Ltd., Kirloskar Pneumatic Co. Ltd., Kobe Steel Ltd., Mitsubishi Heavy Industries, Mitsui and Co. Ltd., Siemens Energy AG and Sulzer Ltd.

Market Research Insights

  • Market dynamics are increasingly shaped by the push for decarbonization, which is accelerating demand for high-pressure compression solutions for the green hydrogen economy and carbon sequestration initiatives. The transition toward these cleaner technologies is not just a trend but a strategic imperative, driving investments in advanced equipment.
  • For example, facilities integrating systems for carbon sequestration are achieving operational efficiencies that were previously unattainable. The adoption of predictive analytics in midstream operations has demonstrably reduced unscheduled downtime by up to 25%, directly improving asset availability.
  • Furthermore, the focus on energy conservation in gas-fired power generation has led to the replacement of older units, with modern compressors delivering efficiency improvements of over 15%, which significantly lowers operational costs and supports sustainability goals across the industrial landscape.

We can help! Our analysts can customize this centrifugal compressor market research report to meet your requirements.

Get in touch

1. Executive Summary

1.1 Market overview

Executive Summary - Chart on Market Overview
Executive Summary - Data Table on Market Overview
Executive Summary - Chart on Global Market Characteristics
Executive Summary - Chart on Market by Geography
Executive Summary - Chart on Market Segmentation by Product
Executive Summary - Chart on Market Segmentation by Variant
Executive Summary - Chart on Market Segmentation by End-user
Executive Summary - Chart on Incremental Growth
Executive Summary - Data Table on Incremental Growth
Executive Summary - Chart on Company Market Positioning

2. Technavio Analysis

2.1 Analysis of price sensitivity, lifecycle, customer purchase basket, adoption rates, and purchase criteria

2.2 Criticality of inputs and Factors of differentiation

Chart on Overview on criticality of inputs and factors of differentiation

2.3 Factors of disruption

Chart on Overview on factors of disruption

2.4 Impact of drivers and challenges

Chart on Impact of drivers and challenges in 2025 and 2030

3. Market Landscape

3.1 Market ecosystem

Chart on Parent Market
Data Table on - Parent Market

3.2 Market characteristics

Chart on Market characteristics analysis

3.3 Value chain analysis

Chart on Value chain analysis

4. Market Sizing

4.1 Market definition

Data Table on Offerings of companies included in the market definition

4.2 Market segment analysis

Market segments

4.3 Market size 2025

4.4 Market outlook: Forecast for 2025-2030

Chart on Global - Market size and forecast 2025-2030 ($ million)
Data Table on Global - Market size and forecast 2025-2030 ($ million)
Chart on Global Market: Year-over-year growth 2025-2030 (%)
Data Table on Global Market: Year-over-year growth 2025-2030 (%)

5. Historic Market Size

5.1 Global Centrifugal Compressor Market 2020 - 2024

Historic Market Size - Data Table on Global Centrifugal Compressor Market 2020 - 2024 ($ million)

5.2 Product segment analysis 2020 - 2024

Historic Market Size - Product Segment 2020 - 2024 ($ million)

5.3 Variant segment analysis 2020 - 2024

Historic Market Size - Variant Segment 2020 - 2024 ($ million)

5.4 End-user segment analysis 2020 - 2024

Historic Market Size - End-user Segment 2020 - 2024 ($ million)

5.5 Geography segment analysis 2020 - 2024

Historic Market Size - Geography Segment 2020 - 2024 ($ million)

5.6 Country segment analysis 2020 - 2024

Historic Market Size - Country Segment 2020 - 2024 ($ million)

6. Qualitative Analysis

6.1 Impact of AI on global centrifugal compressor market

6.2 Impact of geopolitical conflicts on global centrifugal compressor market

7. Five Forces Analysis

7.1 Five forces summary

Five forces analysis - Comparison between 2025 and 2030

7.2 Bargaining power of buyers

Bargaining power of buyers - Impact of key factors 2025 and 2030

7.3 Bargaining power of suppliers

Bargaining power of suppliers - Impact of key factors in 2025 and 2030

7.4 Threat of new entrants

Threat of new entrants - Impact of key factors in 2025 and 2030

7.5 Threat of substitutes

Threat of substitutes - Impact of key factors in 2025 and 2030

7.6 Threat of rivalry

Threat of rivalry - Impact of key factors in 2025 and 2030

7.7 Market condition

Chart on Market condition - Five forces 2025 and 2030

8. Market Segmentation by Product

8.1 Market segments

Chart on Product - Market share 2025-2030 (%)
Data Table on Product - Market share 2025-2030 (%)

8.2 Comparison by Product

Chart on Comparison by Product
Data Table on Comparison by Product

8.3 Single-stage - Market size and forecast 2025-2030

Chart on Single-stage - Market size and forecast 2025-2030 ($ million)
Data Table on Single-stage - Market size and forecast 2025-2030 ($ million)
Chart on Single-stage - Year-over-year growth 2025-2030 (%)
Data Table on Single-stage - Year-over-year growth 2025-2030 (%)

8.4 Multi-stage - Market size and forecast 2025-2030

Chart on Multi-stage - Market size and forecast 2025-2030 ($ million)
Data Table on Multi-stage - Market size and forecast 2025-2030 ($ million)
Chart on Multi-stage - Year-over-year growth 2025-2030 (%)
Data Table on Multi-stage - Year-over-year growth 2025-2030 (%)

8.5 Market opportunity by Product

Market opportunity by Product ($ million)
Data Table on Market opportunity by Product ($ million)

9. Market Segmentation by Variant

9.1 Market segments

Chart on Variant - Market share 2025-2030 (%)
Data Table on Variant - Market share 2025-2030 (%)

9.2 Comparison by Variant

Chart on Comparison by Variant
Data Table on Comparison by Variant

9.3 Below 20 bars - Market size and forecast 2025-2030

Chart on Below 20 bars - Market size and forecast 2025-2030 ($ million)
Data Table on Below 20 bars - Market size and forecast 2025-2030 ($ million)
Chart on Below 20 bars - Year-over-year growth 2025-2030 (%)
Data Table on Below 20 bars - Year-over-year growth 2025-2030 (%)

9.4 Between 20 and 200 bars - Market size and forecast 2025-2030

Chart on Between 20 and 200 bars - Market size and forecast 2025-2030 ($ million)
Data Table on Between 20 and 200 bars - Market size and forecast 2025-2030 ($ million)
Chart on Between 20 and 200 bars - Year-over-year growth 2025-2030 (%)
Data Table on Between 20 and 200 bars - Year-over-year growth 2025-2030 (%)

9.5 Between 200 and 400 bars - Market size and forecast 2025-2030

Chart on Between 200 and 400 bars - Market size and forecast 2025-2030 ($ million)
Data Table on Between 200 and 400 bars - Market size and forecast 2025-2030 ($ million)
Chart on Between 200 and 400 bars - Year-over-year growth 2025-2030 (%)
Data Table on Between 200 and 400 bars - Year-over-year growth 2025-2030 (%)

9.6 Above 400 bars - Market size and forecast 2025-2030

Chart on Above 400 bars - Market size and forecast 2025-2030 ($ million)
Data Table on Above 400 bars - Market size and forecast 2025-2030 ($ million)
Chart on Above 400 bars - Year-over-year growth 2025-2030 (%)
Data Table on Above 400 bars - Year-over-year growth 2025-2030 (%)

9.7 Market opportunity by Variant

Market opportunity by Variant ($ million)
Data Table on Market opportunity by Variant ($ million)

10. Market Segmentation by End-user

10.1 Market segments

Chart on End-user - Market share 2025-2030 (%)
Data Table on End-user - Market share 2025-2030 (%)

10.2 Comparison by End-user

Chart on Comparison by End-user
Data Table on Comparison by End-user

10.3 Oil and gas industry - Market size and forecast 2025-2030

Chart on Oil and gas industry - Market size and forecast 2025-2030 ($ million)
Data Table on Oil and gas industry - Market size and forecast 2025-2030 ($ million)
Chart on Oil and gas industry - Year-over-year growth 2025-2030 (%)
Data Table on Oil and gas industry - Year-over-year growth 2025-2030 (%)

10.4 Power sector - Market size and forecast 2025-2030

Chart on Power sector - Market size and forecast 2025-2030 ($ million)
Data Table on Power sector - Market size and forecast 2025-2030 ($ million)
Chart on Power sector - Year-over-year growth 2025-2030 (%)
Data Table on Power sector - Year-over-year growth 2025-2030 (%)

10.5 Petrochemical and chemical industries - Market size and forecast 2025-2030

Chart on Petrochemical and chemical industries - Market size and forecast 2025-2030 ($ million)
Data Table on Petrochemical and chemical industries - Market size and forecast 2025-2030 ($ million)
Chart on Petrochemical and chemical industries - Year-over-year growth 2025-2030 (%)
Data Table on Petrochemical and chemical industries - Year-over-year growth 2025-2030 (%)

10.6 Others - Market size and forecast 2025-2030

Chart on Others - Market size and forecast 2025-2030 ($ million)
Data Table on Others - Market size and forecast 2025-2030 ($ million)
Chart on Others - Year-over-year growth 2025-2030 (%)
Data Table on Others - Year-over-year growth 2025-2030 (%)

10.7 Market opportunity by End-user

Market opportunity by End-user ($ million)
Data Table on Market opportunity by End-user ($ million)

11. Customer Landscape

11.1 Customer landscape overview

Analysis of price sensitivity, lifecycle, customer purchase basket, adoption rates, and purchase criteria

12. Geographic Landscape

12.1 Geographic segmentation

Chart on Market share by geography 2025-2030 (%)
Data Table on Market share by geography 2025-2030 (%)

12.2 Geographic comparison

Chart on Geographic comparison
Data Table on Geographic comparison

12.3 APAC - Market size and forecast 2025-2030

Chart on APAC - Market size and forecast 2025-2030 ($ million)
Data Table on APAC - Market size and forecast 2025-2030 ($ million)
Chart on APAC - Year-over-year growth 2025-2030 (%)
Data Table on APAC - Year-over-year growth 2025-2030 (%)
Chart on Regional Comparison - APAC
Data Table on Regional Comparison - APAC

12.3.1 China - Market size and forecast 2025-2030

Chart on China - Market size and forecast 2025-2030 ($ million)
Data Table on China - Market size and forecast 2025-2030 ($ million)
Chart on China - Year-over-year growth 2025-2030 (%)
Data Table on China - Year-over-year growth 2025-2030 (%)

12.3.2 India - Market size and forecast 2025-2030

Chart on India - Market size and forecast 2025-2030 ($ million)
Data Table on India - Market size and forecast 2025-2030 ($ million)
Chart on India - Year-over-year growth 2025-2030 (%)
Data Table on India - Year-over-year growth 2025-2030 (%)

12.3.3 Japan - Market size and forecast 2025-2030

Chart on Japan - Market size and forecast 2025-2030 ($ million)
Data Table on Japan - Market size and forecast 2025-2030 ($ million)
Chart on Japan - Year-over-year growth 2025-2030 (%)
Data Table on Japan - Year-over-year growth 2025-2030 (%)

12.3.4 South Korea - Market size and forecast 2025-2030

Chart on South Korea - Market size and forecast 2025-2030 ($ million)
Data Table on South Korea - Market size and forecast 2025-2030 ($ million)
Chart on South Korea - Year-over-year growth 2025-2030 (%)
Data Table on South Korea - Year-over-year growth 2025-2030 (%)

12.3.5 Australia - Market size and forecast 2025-2030

Chart on Australia - Market size and forecast 2025-2030 ($ million)
Data Table on Australia - Market size and forecast 2025-2030 ($ million)
Chart on Australia - Year-over-year growth 2025-2030 (%)
Data Table on Australia - Year-over-year growth 2025-2030 (%)

12.3.6 Indonesia - Market size and forecast 2025-2030

Chart on Indonesia - Market size and forecast 2025-2030 ($ million)
Data Table on Indonesia - Market size and forecast 2025-2030 ($ million)
Chart on Indonesia - Year-over-year growth 2025-2030 (%)
Data Table on Indonesia - Year-over-year growth 2025-2030 (%)

12.4 North America - Market size and forecast 2025-2030

Chart on North America - Market size and forecast 2025-2030 ($ million)
Data Table on North America - Market size and forecast 2025-2030 ($ million)
Chart on North America - Year-over-year growth 2025-2030 (%)
Data Table on North America - Year-over-year growth 2025-2030 (%)
Chart on Regional Comparison - North America
Data Table on Regional Comparison - North America

12.4.1 US - Market size and forecast 2025-2030

Chart on US - Market size and forecast 2025-2030 ($ million)
Data Table on US - Market size and forecast 2025-2030 ($ million)
Chart on US - Year-over-year growth 2025-2030 (%)
Data Table on US - Year-over-year growth 2025-2030 (%)

12.4.2 Canada - Market size and forecast 2025-2030

Chart on Canada - Market size and forecast 2025-2030 ($ million)
Data Table on Canada - Market size and forecast 2025-2030 ($ million)
Chart on Canada - Year-over-year growth 2025-2030 (%)
Data Table on Canada - Year-over-year growth 2025-2030 (%)

12.4.3 Mexico - Market size and forecast 2025-2030

Chart on Mexico - Market size and forecast 2025-2030 ($ million)
Data Table on Mexico - Market size and forecast 2025-2030 ($ million)
Chart on Mexico - Year-over-year growth 2025-2030 (%)
Data Table on Mexico - Year-over-year growth 2025-2030 (%)

12.5 Europe - Market size and forecast 2025-2030

Chart on Europe - Market size and forecast 2025-2030 ($ million)
Data Table on Europe - Market size and forecast 2025-2030 ($ million)
Chart on Europe - Year-over-year growth 2025-2030 (%)
Data Table on Europe - Year-over-year growth 2025-2030 (%)
Chart on Regional Comparison - Europe
Data Table on Regional Comparison - Europe

12.5.1 Germany - Market size and forecast 2025-2030

Chart on Germany - Market size and forecast 2025-2030 ($ million)
Data Table on Germany - Market size and forecast 2025-2030 ($ million)
Chart on Germany - Year-over-year growth 2025-2030 (%)
Data Table on Germany - Year-over-year growth 2025-2030 (%)

12.5.2 UK - Market size and forecast 2025-2030

Chart on UK - Market size and forecast 2025-2030 ($ million)
Data Table on UK - Market size and forecast 2025-2030 ($ million)
Chart on UK - Year-over-year growth 2025-2030 (%)
Data Table on UK - Year-over-year growth 2025-2030 (%)

12.5.3 France - Market size and forecast 2025-2030

Chart on France - Market size and forecast 2025-2030 ($ million)
Data Table on France - Market size and forecast 2025-2030 ($ million)
Chart on France - Year-over-year growth 2025-2030 (%)
Data Table on France - Year-over-year growth 2025-2030 (%)

12.5.4 Italy - Market size and forecast 2025-2030

Chart on Italy - Market size and forecast 2025-2030 ($ million)
Data Table on Italy - Market size and forecast 2025-2030 ($ million)
Chart on Italy - Year-over-year growth 2025-2030 (%)
Data Table on Italy - Year-over-year growth 2025-2030 (%)

12.5.5 The Netherlands - Market size and forecast 2025-2030

Chart on The Netherlands - Market size and forecast 2025-2030 ($ million)
Data Table on The Netherlands - Market size and forecast 2025-2030 ($ million)
Chart on The Netherlands - Year-over-year growth 2025-2030 (%)
Data Table on The Netherlands - Year-over-year growth 2025-2030 (%)

12.5.6 Spain - Market size and forecast 2025-2030

Chart on Spain - Market size and forecast 2025-2030 ($ million)
Data Table on Spain - Market size and forecast 2025-2030 ($ million)
Chart on Spain - Year-over-year growth 2025-2030 (%)
Data Table on Spain - Year-over-year growth 2025-2030 (%)

12.6 Middle East and Africa - Market size and forecast 2025-2030

Chart on Middle East and Africa - Market size and forecast 2025-2030 ($ million)
Data Table on Middle East and Africa - Market size and forecast 2025-2030 ($ million)
Chart on Middle East and Africa - Year-over-year growth 2025-2030 (%)
Data Table on Middle East and Africa - Year-over-year growth 2025-2030 (%)
Chart on Regional Comparison - Middle East and Africa
Data Table on Regional Comparison - Middle East and Africa

12.6.1 Saudi Arabia - Market size and forecast 2025-2030

Chart on Saudi Arabia - Market size and forecast 2025-2030 ($ million)
Data Table on Saudi Arabia - Market size and forecast 2025-2030 ($ million)
Chart on Saudi Arabia - Year-over-year growth 2025-2030 (%)
Data Table on Saudi Arabia - Year-over-year growth 2025-2030 (%)

12.6.2 UAE - Market size and forecast 2025-2030

Chart on UAE - Market size and forecast 2025-2030 ($ million)
Data Table on UAE - Market size and forecast 2025-2030 ($ million)
Chart on UAE - Year-over-year growth 2025-2030 (%)
Data Table on UAE - Year-over-year growth 2025-2030 (%)

12.6.3 South Africa - Market size and forecast 2025-2030

Chart on South Africa - Market size and forecast 2025-2030 ($ million)
Data Table on South Africa - Market size and forecast 2025-2030 ($ million)
Chart on South Africa - Year-over-year growth 2025-2030 (%)
Data Table on South Africa - Year-over-year growth 2025-2030 (%)

12.6.4 Egypt - Market size and forecast 2025-2030

Chart on Egypt - Market size and forecast 2025-2030 ($ million)
Data Table on Egypt - Market size and forecast 2025-2030 ($ million)
Chart on Egypt - Year-over-year growth 2025-2030 (%)
Data Table on Egypt - Year-over-year growth 2025-2030 (%)

12.6.5 Turkey - Market size and forecast 2025-2030

Chart on Turkey - Market size and forecast 2025-2030 ($ million)
Data Table on Turkey - Market size and forecast 2025-2030 ($ million)
Chart on Turkey - Year-over-year growth 2025-2030 (%)
Data Table on Turkey - Year-over-year growth 2025-2030 (%)

12.7 South America - Market size and forecast 2025-2030

Chart on South America - Market size and forecast 2025-2030 ($ million)
Data Table on South America - Market size and forecast 2025-2030 ($ million)
Chart on South America - Year-over-year growth 2025-2030 (%)
Data Table on South America - Year-over-year growth 2025-2030 (%)
Chart on Regional Comparison - South America
Data Table on Regional Comparison - South America

12.7.1 Brazil - Market size and forecast 2025-2030

Chart on Brazil - Market size and forecast 2025-2030 ($ million)
Data Table on Brazil - Market size and forecast 2025-2030 ($ million)
Chart on Brazil - Year-over-year growth 2025-2030 (%)
Data Table on Brazil - Year-over-year growth 2025-2030 (%)

12.7.2 Argentina - Market size and forecast 2025-2030

Chart on Argentina - Market size and forecast 2025-2030 ($ million)
Data Table on Argentina - Market size and forecast 2025-2030 ($ million)
Chart on Argentina - Year-over-year growth 2025-2030 (%)
Data Table on Argentina - Year-over-year growth 2025-2030 (%)

12.7.3 Chile - Market size and forecast 2025-2030

Chart on Chile - Market size and forecast 2025-2030 ($ million)
Data Table on Chile - Market size and forecast 2025-2030 ($ million)
Chart on Chile - Year-over-year growth 2025-2030 (%)
Data Table on Chile - Year-over-year growth 2025-2030 (%)

12.8 Market opportunity by geography

Market opportunity by geography ($ million)
Data Tables on Market opportunity by geography ($ million)

13. Drivers, Challenges, and Opportunity

13.1 Market drivers

Increasing demand for natural gas infrastructure and liquid natural gas exports
Rapid industrialization and expansion of manufacturing sector
Technological advancements and push for energy efficiency

13.2 Market challenges

High initial capital expenditure and financial barriers to implementation
Growing shortage of specialized skilled labor
Supply chain volatility and rising costs of raw materials and rare components

13.3 Impact of drivers and challenges

Impact of drivers and challenges in 2025 and 2030

13.4 Market opportunities

Integration of digital twin technology and IIoT for enhanced predictive analytics
Development of specialized high-pressure compression solutions for emerging hydrogen economy
Escalation of carbon capture, utilization, and storage initiatives and high-density CO2 compression

14. Competitive Landscape

14.1 Overview

14.2

Overview on criticality of inputs and factors of differentiation

14.3 Landscape disruption

Overview on factors of disruption

14.4 Industry risks

Impact of key risks on business

15. Competitive Analysis

15.1 Companies profiled

Companies covered

15.2 Company ranking index

15.3 Market positioning of companies

Matrix on companies position and classification

15.4 Atlas Copco AB

Atlas Copco AB - Overview
Atlas Copco AB - Business segments
Atlas Copco AB - Key offerings
Atlas Copco AB - Segment focus
SWOT

15.5 Baker Hughes Co.

Baker Hughes Co. - Overview
Baker Hughes Co. - Business segments
Baker Hughes Co. - Key offerings
Baker Hughes Co. - Segment focus
SWOT

15.6 Chart Industries Inc.

Chart Industries Inc. - Overview
Chart Industries Inc. - Business segments
Chart Industries Inc. - Key offerings
Chart Industries Inc. - Segment focus
SWOT

15.7 Ebara Corp.

Ebara Corp. - Overview
Ebara Corp. - Business segments
Ebara Corp. - Key offerings
Ebara Corp. - Segment focus
SWOT

15.8 General Electric Co.

General Electric Co. - Overview
General Electric Co. - Business segments
General Electric Co. - Key offerings
General Electric Co. - Segment focus
SWOT

15.9 Hitachi Ltd.

Hitachi Ltd. - Overview
Hitachi Ltd. - Business segments
Hitachi Ltd. - Key offerings
Hitachi Ltd. - Segment focus
SWOT

15.10 Honeywell International Inc.

Honeywell International Inc. - Overview
Honeywell International Inc. - Business segments
Honeywell International Inc. - Key news
Honeywell International Inc. - Key offerings
Honeywell International Inc. - Segment focus
SWOT

15.11 IHI Corp.

IHI Corp. - Overview
IHI Corp. - Business segments
IHI Corp. - Key offerings
IHI Corp. - Segment focus
SWOT

15.12 Ingersoll Rand Inc.

Ingersoll Rand Inc. - Overview
Ingersoll Rand Inc. - Business segments
Ingersoll Rand Inc. - Key offerings
Ingersoll Rand Inc. - Segment focus
SWOT

15.13 Kawasaki Heavy Industries Ltd.

Kawasaki Heavy Industries Ltd. - Overview
Kawasaki Heavy Industries Ltd. - Business segments
Kawasaki Heavy Industries Ltd. - Key news
Kawasaki Heavy Industries Ltd. - Key offerings
Kawasaki Heavy Industries Ltd. - Segment focus
SWOT

15.14 Kobe Steel Ltd.

Kobe Steel Ltd. - Overview
Kobe Steel Ltd. - Business segments
Kobe Steel Ltd. - Key offerings
Kobe Steel Ltd. - Segment focus
SWOT

15.15 Mitsubishi Heavy Industries

Mitsubishi Heavy Industries - Overview
Mitsubishi Heavy Industries - Business segments
Mitsubishi Heavy Industries - Key offerings
Mitsubishi Heavy Industries - Segment focus
SWOT

15.16 Mitsui and Co. Ltd.

Mitsui and Co. Ltd. - Overview
Mitsui and Co. Ltd. - Business segments
Mitsui and Co. Ltd. - Key offerings
Mitsui and Co. Ltd. - Segment focus
SWOT

15.17 Siemens Energy AG

Siemens Energy AG - Overview
Siemens Energy AG - Business segments
Siemens Energy AG - Key news
Siemens Energy AG - Key offerings
Siemens Energy AG - Segment focus
SWOT

15.18 Sulzer Ltd.

Sulzer Ltd. - Overview
Sulzer Ltd. - Business segments
Sulzer Ltd. - Key offerings
Sulzer Ltd. - Segment focus
SWOT

16. Appendix

16.1 Scope of the report

Market definition
Objectives
Notes and caveats

16.2 Inclusions and exclusions checklist

Inclusions checklist
Exclusions checklist

16.3 Currency conversion rates for US$

16.4 Research methodology

16.5 Data procurement

Information sources

16.6 Data validation

16.7 Validation techniques employed for market sizing

16.8 Data synthesis

16.9 360 degree market analysis

16.10 List of abbreviations

Research Methodology

Technavio presents a detailed picture of the market by way of study, synthesis, and summation of data from multiple sources. The analysts have presented the various facets of the market with a particular focus on identifying the key industry influencers. The data thus presented is comprehensive, reliable, and the result of extensive research, both primary and secondary.

INFORMATION SOURCES

Primary sources

  • Manufacturers and suppliers
  • Channel partners
  • Industry experts
  • Strategic decision makers

Secondary sources

  • Industry journals and periodicals
  • Government data
  • Financial reports of key industry players
  • Historical data
  • Press releases

DATA ANALYSIS

Data Synthesis

  • Collation of data
  • Estimation of key figures
  • Analysis of derived insights

Data Validation

  • Triangulation with data models
  • Reference against proprietary databases
  • Corroboration with industry experts

REPORT WRITING

Qualitative

  • Market drivers
  • Market challenges
  • Market trends
  • Five forces analysis

Quantitative

  • Market size and forecast
  • Market segmentation
  • Geographical insights
  • Competitive landscape

Interested in this report?

Get your sample now to see our research methodology and insights!

Download Now

Frequently Asked Questions

Centrifugal Compressor market growth will increase by USD 4118.3 million during 2026-2030.

The Centrifugal Compressor market is expected to grow at a CAGR of 5.7% during 2026-2030.

Centrifugal Compressor market is segmented by Product (Single-stage, Multi-stage) Variant (Below 20 bars, Between 20 and 200 bars, Between 200 and 400 bars, Above 400 bars) End-user (Oil and gas industry, Power sector, Petrochemical and chemical industries, Others)

Atlas Copco AB, Baker Hughes Co., Chart Industries Inc., Ebara Corp., Everllence SE, FS ELLIOTT Co. LLC, Fusheng Precision Co. Ltd., General Electric Co., Hanwha Power Systems Co Ltd, Hitachi Ltd., Honeywell International Inc., IHI Corp., Ingersoll Rand Inc., Kawasaki Heavy Industries Ltd., Kirloskar Pneumatic Co. Ltd., Kobe Steel Ltd., Mitsubishi Heavy Industries, Mitsui and Co. Ltd., Siemens Energy AG, Sulzer Ltd. are a few of the key vendors in the Centrifugal Compressor market.

APAC will register the highest growth rate of 44.5% among the other regions. Therefore, the Centrifugal Compressor market in APAC is expected to garner significant business opportunities for the vendors during the forecast period.

China, India, Japan, South Korea, Australia, Indonesia, US, Canada, Mexico, Germany, UK, France, Italy, The Netherlands, Spain, Saudi Arabia, UAE, South Africa, Egypt, Turkey, Brazil, Argentina, Chile

  • Increasing demand for natural gas infrastructure and liquid natural gas exports is the driving factor this market.

The Centrifugal Compressor market vendors should focus on grabbing business opportunities from the Product segment as it accounted for the largest market share in the base year.
RIA - Research AI Assistant
Ask RIA