Industrial Process Mining Software Market Analysis, Size, and Forecast 2026-2030: North America (US, Canada, and Mexico), Europe (Germany, UK, and France), APAC (China, Japan, and India), Middle East and Africa (Saudi Arabia, UAE, and South Africa), South America (Brazil, Argentina, and Colombia), and Rest of World (ROW)

Industrial Process Mining Software Market Analysis, Size, and Forecast 2026-2030:
North America (US, Canada, and Mexico), Europe (Germany, UK, and France), APAC (China, Japan, and India), Middle East and Africa (Saudi Arabia, UAE, and South Africa), South America (Brazil, Argentina, and Colombia), and Rest of World (ROW)

Published: May 2026 303 Pages SKU: IRTNTR81266

Market Overview at a Glance

$7.73 B
Market Opportunity
56.8%
CAGR 2025 - 2030
31.8%
North America Growth
$385.7 Mn
Cloud based segment 2024

Industrial Process Mining Software Market Size and Growth Forecast 2026-2030

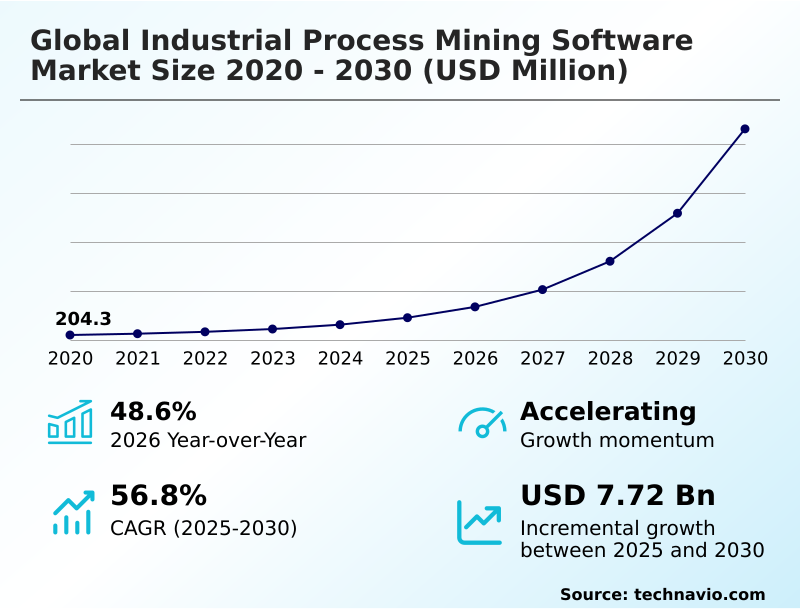
The Industrial Process Mining Software Market size was valued at USD 912.1 million in 2025 growing at a CAGR of 56.8% during the forecast period 2026-2030.

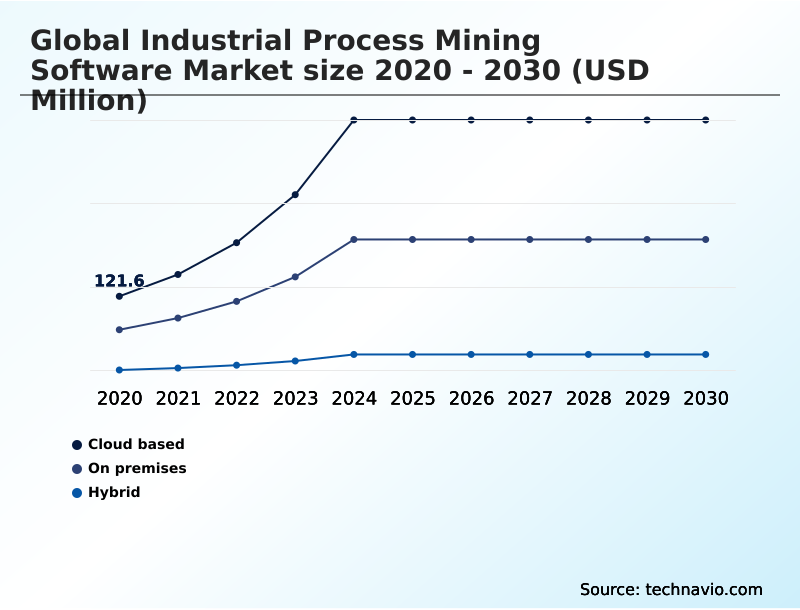
North America accounts for 31.8% of incremental growth during the forecast period. The Cloud based segment by Deployment was valued at USD 385.7 million in 2024, while the Process optimization and efficiency segment holds the largest revenue share by Application.

The market is projected to grow by USD 8.43 billion from 2020 to 2030, with USD 7.73 billion of the growth expected during the forecast period of 2025 to 2030.

Get Key Insights on Market Forecast (PDF) Request Free Sample

Industrial Process Mining Software Market Overview

The industrial process mining software market is defined by the strategic push to achieve operational transparency and efficiency within complex production environments. With year-over-year growth reaching 48.6%, organizations are accelerating the adoption of process intelligence platforms to manage the convergence of information and operational technology data. These tools enable deep event log analysis and process discovery, turning raw data from manufacturing execution systems into actionable insights for workflow automation. For instance, a high-volume automotive supplier implementing process simulation based on IATF 16949 standards can perform detailed variance analysis on its robotic welding lines. By using predictive process monitoring to analyze cycle times and resource allocation, the plant can identify root causes for micro-stoppages, typically reducing line downtime and improving first-pass yield. This data-driven decision making is crucial for optimizing asset utilization and achieving the rigorous process conformance demanded by modern supply chains.

Drivers, Trends, and Challenges in the Industrial Process Mining Software Market

The strategic role of process mining in digital transformation is expanding as organizations move beyond basic efficiency gains. Industrial process mining for supply chain optimization is a primary objective, where real-time process monitoring in manufacturing provides the data needed to enhance resilience. This requires deep process mining integration with ERP systems, allowing for a holistic view of operations.

A key technical decision involves comparing object-centric process mining vs case-centric mining; the former is superior for modeling the complex, many-to-many relationships in industrial settings, such as tracking components from multiple suppliers into a single production order.

For instance, an aerospace manufacturer adhering to AS9100 standards can use AI-driven process mining for predictive maintenance on critical machinery, measuring ROI from process mining initiatives through reduced unplanned downtime, which is significantly more effective than preventative schedules alone.

Concurrently, using process mining for ESG compliance reporting is becoming standard practice, helping firms meet the demands of the EU's Corporate Sustainability Reporting Directive. Task mining for analyzing manual user activities complements system data, offering a complete picture. However, securing sensitive data in industrial process mining remains paramount, especially when applying process mining to operational technology.

As a result, many firms are combining process mining with robotic process automation to create self-optimizing workflows, from improving production throughput to automating root cause analysis with process mining.

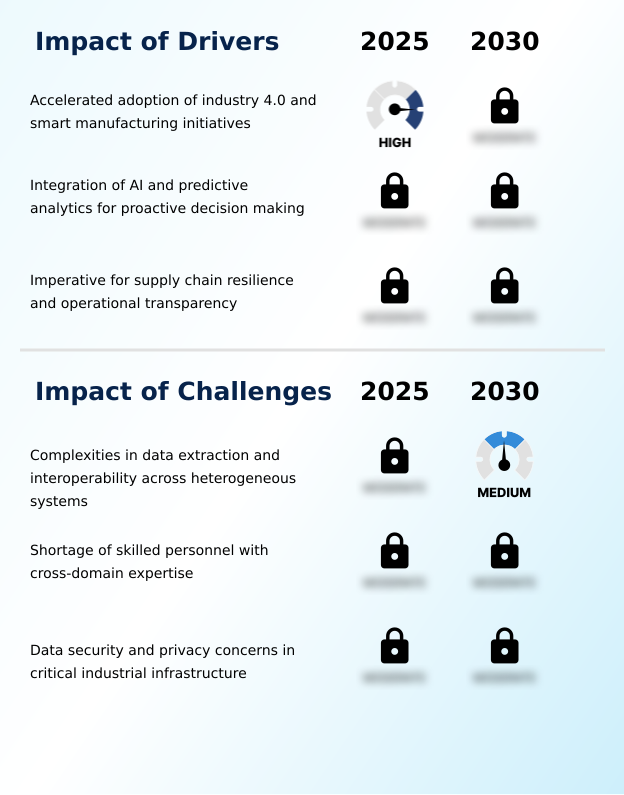
Primary Growth Driver: The accelerated adoption of Industry 4.0 and smart manufacturing initiatives is a key driver for the industrial process mining software market.

The primary driver for the market is the accelerated adoption of Industry 4.0, which necessitates advanced tools for operational technology data analysis from manufacturing execution systems and programmable logic controllers.

Contributing 31.8% of incremental growth, North American firms are aggressively leveraging these solutions to enhance supply chain resilience. The deep integration of AI, including prescriptive analytics and machine learning, into process mining platforms marks a second critical driver.

This shifts the focus from reactive analysis to proactive management, enabling predictive maintenance and intelligent automation.

Lastly, the urgent need for enhanced supply chain synchronization and operational transparency in response to global disruptions compels industrial leaders to seek tools that provide end-to-end process visibility, from procurement to logistics, ensuring compliance and agility.

Emerging Market Trend: The convergence of hyperautomation with process discovery is a defining market trend. This integration is shifting solutions from descriptive analytics toward prescriptive and autonomous process optimization.

The market's trajectory is increasingly shaped by the fusion of generative AI with process mining platforms, enabling natural language query capabilities and moving beyond simple process mapping. This evolution toward hyperautomation allows for the automatic execution of corrective actions, a critical capability in high-velocity manufacturing sectors found in the APAC region, which is seeing a 58.3% CAGR.

A significant trend is the shift from traditional case-centric analysis to object-centric process mining (OCPM), which provides a more accurate view of complex industrial value chains where multiple entities like materials and equipment interact. This approach is essential for identifying cross-functional inefficiencies.

Furthermore, the integration with digital twin technology for predictive process monitoring is enabling advanced predictive maintenance and sustainability reporting, meeting stringent ESG compliance demands.

Key Industry Challenge: Complexities in data extraction and ensuring interoperability across heterogeneous operational technology systems present a key challenge to industry growth.

A formidable challenge is the complexity of data extraction and achieving interoperability across heterogeneous industrial environments, where a mix of legacy systems and modern IoT devices creates fragmented data landscapes. The effort to cleanse and harmonize unstructured operational technology data from proprietary control systems often leads to cost-prohibitive implementations, especially for SMEs.

A second barrier is the acute shortage of skilled personnel with cross-domain expertise in both data science and industrial engineering, hindering the translation of analytical insights into practical shop-floor improvements. This is particularly pronounced in emerging APAC markets.

Finally, rigorous data security and privacy concerns, governed by regulations like GDPR, act as a significant deterrent, as moving sensitive operational data to cloud platforms for analysis introduces cybersecurity risks and compliance burdens that many manufacturers are hesitant to assume.

Explore Full Market Dynamics Analysis Request Free Sample

Industrial Process Mining Software Market Segmentation

The industrial process mining software industry research report provides comprehensive data including region-wise segment analysis, with forecasts and analysis for the period 2026-2030, as well as historical data from 2020-2024 for the following segments.

Market Segment by Deployment
  • Cloud based
  • On premises
  • Hybrid
Market Segment by Application
  • Process optimization and efficiency
  • Compliance and audit management
  • Operational intelligence and monitoring
Market Segment by End-user
  • Manufacturing
  • Energy and utilities
  • Chemicals and process industries
  • Oil and gas
  • Healthcare
Market Segment by Geography
North America
US, Canada, Mexico
Europe
Germany, UK, France, Italy, The Netherlands, Spain
APAC
China, Japan, India, South Korea, Australia, Indonesia
Middle East and Africa
Saudi Arabia, UAE, South Africa, Israel, Turkey
South America
Brazil, Argentina, Colombia

Deployment Segment Analysis

The cloud based segment is estimated to witness significant growth during the forecast period.

Cloud-based platforms are the dominant deployment methodology for industrial process mining, driven by inherent scalability, cost-efficiency, and seamless integration with Industrial Internet of Things ecosystems.

This model allows firms to leverage substantial computing power for process discovery and event log analysis without significant upfront hardware investment. The shift toward Software as a Service models facilitates continuous updates, enabling advanced process simulation and predictive process monitoring.

Cloud architectures are particularly effective in dismantling information silos across dispersed facilities, providing unified, end-to-end process visibility.

By utilizing the cloud, organizations can rapidly scale process mining initiatives from a single pilot to a global production network, ensuring data-driven decision making and process standardization are efficiently replicated across the entire enterprise for enhanced operational excellence.

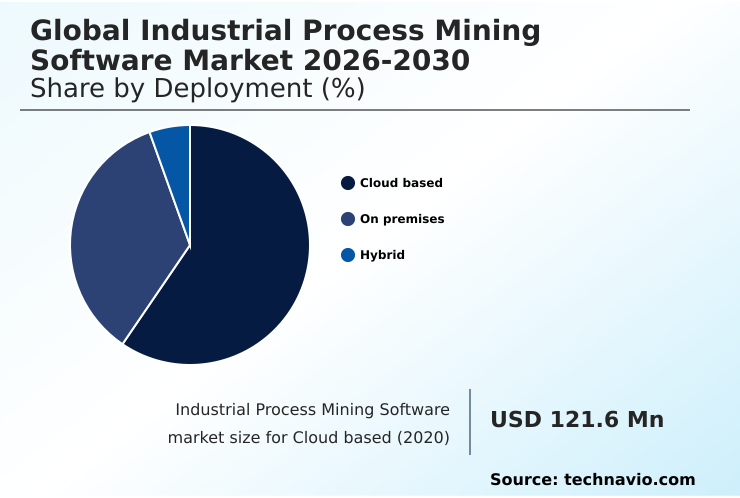
The Cloud based segment was valued at USD 385.7 million in 2024 and showed a gradual increase during the forecast period.

Industrial Process Mining Software Market by Region: North America Leads with 31.8% Growth Share

North America is estimated to contribute 31.8% to the growth of the global market during the forecast period.

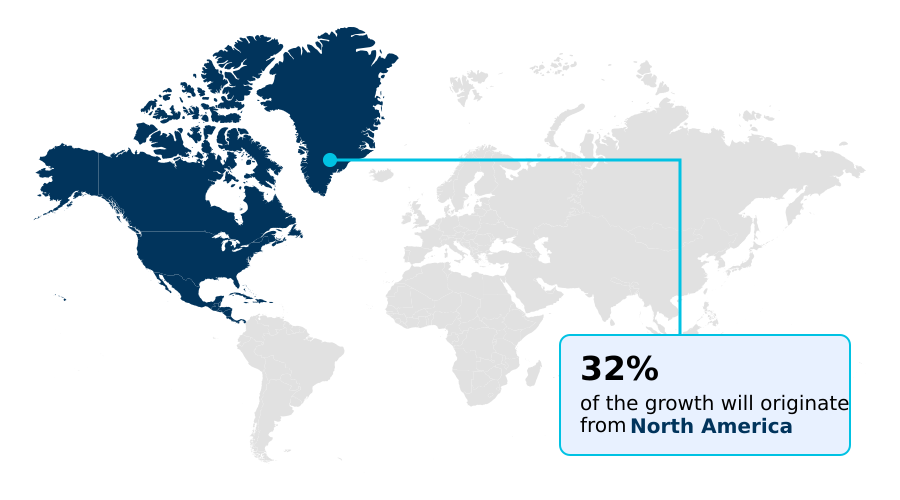
The geographic landscape of the industrial process mining software market is diverse, with North America representing the largest contributor to incremental growth at 31.8%, driven by a focus on supply chain resilience and hyperautomation.

Meanwhile, the APAC region is projected to have the highest growth, with a 58.3% CAGR, as manufacturing hubs in China and India prioritize process standardization and intelligent automation to manage immense scale and complexity.

In Europe, adoption is strongly influenced by regulatory pressures, with firms utilizing process mining for compliance verification under frameworks like GDPR and the EU Green Deal.

This region, home to many pioneering vendors, emphasizes object-centric process mining to analyze dense supply chain interdependencies and support complex ERP transformations, reinforcing the global need for enhanced operational transparency.

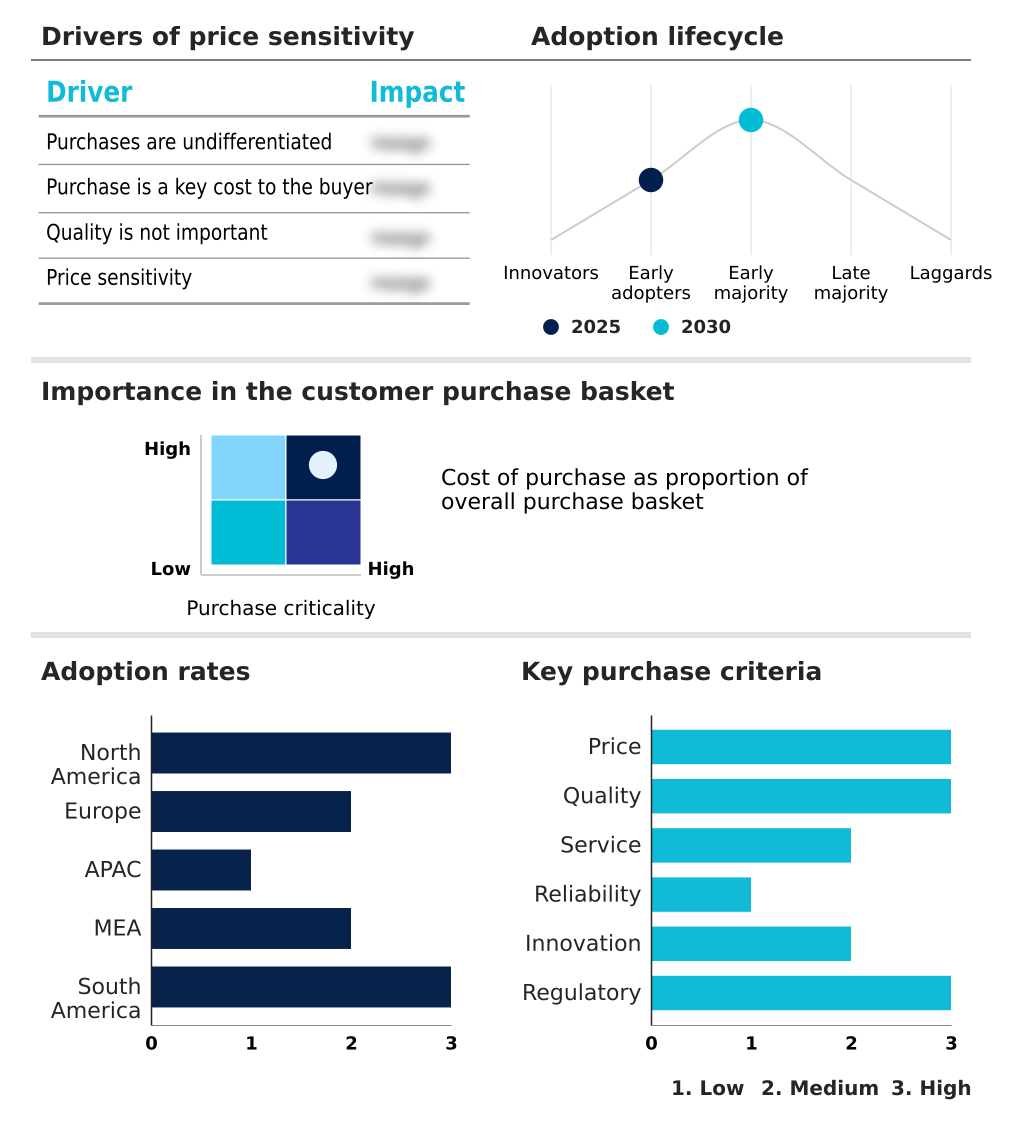
Customer Landscape Analysis for the Industrial Process Mining Software Market

The industrial process mining software market forecasting report includes the adoption lifecycle of the market, covering from the innovator’s stage to the laggard’s stage. It focuses on adoption rates in different regions based on penetration. Furthermore, the industrial process mining software market report also includes key purchase criteria and drivers of price sensitivity to help companies evaluate and develop their market growth analysis strategies.

Competitive Landscape of the Industrial Process Mining Software Market

Companies are implementing various strategies, such as strategic alliances, partnerships, mergers and acquisitions, geographical expansion, and product/service launches, to enhance their presence in the industrial process mining software market industry.

ABBYY - Offers a process intelligence platform using timeline analysis to reconstruct workflows, identifying compliance issues and supply chain delays for data-driven operational improvements.

The industry research and growth report includes detailed analyses of the competitive landscape of the market and information about key companies, including:

  • ABBYY
  • BusinessOptix
  • Celonis SE
  • Datricks
  • Fluxicon BV
  • IBM Corp.
  • iGrafx, LLC
  • Infor Inc.
  • Mavim BV
  • Mehrwerk
  • Microsoft Corp.
  • mindzie
  • Pegasystems Inc.
  • Puzzle Data
  • QPR Software Plc
  • SAG Aris GmbH
  • Salesforce Inc.
  • SAP SE
  • Stereologic
  • UiPath Inc.

Qualitative and quantitative analysis of companies has been conducted to help clients understand the wider business environment as well as the strengths and weaknesses of key industry players. Data is qualitatively analyzed to categorize companies as pure play, category-focused, industry-focused, and diversified; it is quantitatively analyzed to categorize companies as dominant, leading, strong, tentative, and weak.

Recent Developments in the Industrial Process Mining Software Market

  • In February, 2025, Siemens Digital Industries Software announced the expansion of its Xcelerator portfolio with a new industrial process intelligence module, designed to help manufacturers correlate energy consumption data with production throughput in real time.
  • In February, 2025, Weir Group PLC entered into an agreement to acquire Micromine, a prominent mining software company, for approximately USD 1.31 billion, a move intended to strengthen Weir's digital capabilities across the mining value chain.
  • In March, 2025, SAG Aris GmbH (as ARIS) introduced ARIS Task Mining by ProcessMaker as a new capability within the ARIS Suite, enabling end-to-end capture of both manual and system-based activities to provide a more comprehensive view of operational workflows.
  • In May, 2025, Celonis SE announced the integration of a generative AI-powered co-pilot into its Execution Management System, designed to enable natural language queries and automate the generation of process improvement suggestions for industrial clients.

Research Analyst Overview: Industrial Process Mining Software Market

The industrial process mining market's evolution is driven by the imperative of IT/OT convergence, compelling a re-evaluation of operational KPIs beyond traditional metrics. Organizations are leveraging process intelligence to create a digital twin of an organization, providing a dynamic, data-driven view of all workflows.

This involves sophisticated event log analysis from sources like supervisory control and data acquisition (SCADA) systems to enable robust process discovery and conformance checking. The 'Process optimization and efficiency' application remains the dominant segment, reflecting the core value proposition.

Boardroom decisions on CapEx for robotic process automation are increasingly informed by insights from task mining, which quantifies the potential for workflow automation. However, these initiatives must navigate the complexities of data privacy regulations such as GDPR, which governs how employee interaction data is used for process enhancement.

Consequently, the focus is shifting toward embedding predictive process monitoring and prescriptive analytics directly into execution management systems to drive continuous improvement.

Dive into Technavio’s robust research methodology, blending expert interviews, extensive data synthesis, and validated models for unparalleled Industrial Process Mining Software Market insights. See full methodology.

Request Free Sample

Market Scope
Page number 303
Base year 2025
Historic period 2020-2024
Forecast period 2026-2030
Growth momentum & CAGR Accelerate at a CAGR of 56.8%
Market growth 2026-2030 USD 7725.0 million
Market structure Fragmented
YoY growth 2025-2026(%) 48.6%
Key countries US, Canada, Mexico, Germany, UK, France, Italy, The Netherlands, Spain, China, Japan, India, South Korea, Australia, Indonesia, Saudi Arabia, UAE, South Africa, Israel, Turkey, Brazil, Argentina and Colombia
Competitive landscape Leading Companies, Market Positioning of Companies, Competitive Strategies, and Industry Risks

Industrial Process Mining Software Market: Key Questions Answered in This Report

  • What is the expected growth of the Industrial Process Mining Software Market between 2026 and 2030?

    • The Industrial Process Mining Software Market is expected to grow by USD 7.73 billion during 2026-2030, registering a CAGR of 56.8%. Year-over-year growth in 2026 is estimated at 48.6%%. This acceleration is shaped by accelerated adoption of industry 4.0 and smart manufacturing initiatives, which is intensifying demand across multiple end-use verticals covered in the report.

  • What segmentation does the market report cover?

    • The report is segmented by Deployment (Cloud based, On premises, and Hybrid), Application (Process optimization and efficiency, Compliance and audit management, and Operational intelligence and monitoring), End-user (Manufacturing, Energy and utilities, Chemicals and process industries, Oil and gas, and Healthcare) and Geography (North America, Europe, APAC, Middle East and Africa, South America). Among these, the Cloud based segment is estimated to witness significant growth during the forecast period, driven by rising adoption across key application areas. Each segment includes detailed qualitative and quantitative analysis, along with historical data from 2020-2024 and forecasts through 2030 with year-over-year growth rates.

  • Which regions are analyzed in the report?

    • The report covers North America, Europe, APAC, Middle East and Africa and South America. North America is estimated to contribute 31.8% to market growth during the forecast period. Country-level analysis includes US, Canada, Mexico, Germany, UK, France, Italy, The Netherlands, Spain, China, Japan, India, South Korea, Australia, Indonesia, Saudi Arabia, UAE, South Africa, Israel, Turkey, Brazil, Argentina and Colombia, with dedicated market size tables and year-over-year growth for each.

  • What are the key growth drivers and market challenges?

    • The primary driver is accelerated adoption of industry 4.0 and smart manufacturing initiatives, which is accelerating investment and industry demand. The main challenge is complexities in data extraction and interoperability across heterogeneous systems, creating operational barriers for key market participants. The report quantifies the impact of each driver and challenge across 2026 and 2030 with comparative analysis.

  • Who are the major players in the Industrial Process Mining Software Market?

    • Key vendors include ABBYY, BusinessOptix, Celonis SE, Datricks, Fluxicon BV, IBM Corp., iGrafx, LLC, Infor Inc., Mavim BV, Mehrwerk, Microsoft Corp., mindzie, Pegasystems Inc., Puzzle Data, QPR Software Plc, SAG Aris GmbH, Salesforce Inc., SAP SE, Stereologic and UiPath Inc.. The report provides qualitative and quantitative analysis categorizing companies as dominant, leading, strong, tentative, and weak based on their market positioning. Company profiles include business segment analysis, SWOT assessment, key offerings, and recent strategic developments.

Industrial Process Mining Software Market Research Insights

Market dynamics are shaped by a definitive shift from retrospective analysis to proactive, real-time monitoring and predictive maintenance. This evolution is driven by the integration of advanced process mining algorithms that enable deep performance diagnostics and bottleneck identification across the value chain.

Organizations are leveraging these capabilities to achieve end-to-end visibility, which is critical for building supply chain resilience and ensuring operational excellence. The pursuit of process optimization and efficiency remains the largest application segment.

This focus is amplified by regulatory frameworks such as the European Green Deal, which mandates stringent sustainability reporting and compels firms to use these tools for compliance verification and optimizing resource allocation.

We can help! Our analysts can customize this industrial process mining software market research report to meet your requirements.

Get in touch

1. Executive Summary

1.1 Market overview

Executive Summary - Chart on Market Overview
Executive Summary - Data Table on Market Overview
Executive Summary - Chart on Global Market Characteristics
Executive Summary - Chart on Market by Geography
Executive Summary - Chart on Market Segmentation by Deployment
Executive Summary - Chart on Market Segmentation by Application
Executive Summary - Chart on Market Segmentation by End-user
Executive Summary - Chart on Incremental Growth
Executive Summary - Data Table on Incremental Growth
Executive Summary - Chart on Company Market Positioning

2. Technavio Analysis

2.1 Analysis of price sensitivity, lifecycle, customer purchase basket, adoption rates, and purchase criteria

2.2 Criticality of inputs and Factors of differentiation

Chart on Overview on criticality of inputs and factors of differentiation

2.3 Factors of disruption

Chart on Overview on factors of disruption

2.4 Impact of drivers and challenges

Chart on Impact of drivers and challenges in 2025 and 2030

3. Market Landscape

3.1 Market ecosystem

Chart on Parent Market
Data Table on - Parent Market

3.2 Market characteristics

Chart on Market characteristics analysis

3.3 Value chain analysis

Chart on Value chain analysis

4. Market Sizing

4.1 Market definition

Data Table on Offerings of companies included in the market definition

4.2 Market segment analysis

Market segments

4.3 Market size 2025

4.4 Market outlook: Forecast for 2025-2030

Chart on Global - Market size and forecast 2025-2030 ($ million)
Data Table on Global - Market size and forecast 2025-2030 ($ million)
Chart on Global Market: Year-over-year growth 2025-2030 (%)
Data Table on Global Market: Year-over-year growth 2025-2030 (%)

5. Historic Market Size

5.1 Global Industrial Process Mining Software Market 2020 - 2024

Historic Market Size - Data Table on Global Industrial Process Mining Software Market 2020 - 2024 ($ million)

5.2 Deployment segment analysis 2020 - 2024

Historic Market Size - Deployment Segment 2020 - 2024 ($ million)

5.3 Application segment analysis 2020 - 2024

Historic Market Size - Application Segment 2020 - 2024 ($ million)

5.4 End-user segment analysis 2020 - 2024

Historic Market Size - End-user Segment 2020 - 2024 ($ million)

5.5 Geography segment analysis 2020 - 2024

Historic Market Size - Geography Segment 2020 - 2024 ($ million)

5.6 Country segment analysis 2020 - 2024

Historic Market Size - Country Segment 2020 - 2024 ($ million)

6. Qualitative Analysis

6.1 Impact of AI on Global Industrial Process Mining Software Market

7. Five Forces Analysis

7.1 Five forces summary

Five forces analysis - Comparison between 2025 and 2030

7.2 Bargaining power of buyers

Bargaining power of buyers - Impact of key factors 2025 and 2030

7.3 Bargaining power of suppliers

Bargaining power of suppliers - Impact of key factors in 2025 and 2030

7.4 Threat of new entrants

Threat of new entrants - Impact of key factors in 2025 and 2030

7.5 Threat of substitutes

Threat of substitutes - Impact of key factors in 2025 and 2030

7.6 Threat of rivalry

Threat of rivalry - Impact of key factors in 2025 and 2030

7.7 Market condition

Chart on Market condition - Five forces 2025 and 2030

8. Market Segmentation by Deployment

8.1 Market segments

Chart on Deployment - Market share 2025-2030 (%)
Data Table on Deployment - Market share 2025-2030 (%)

8.2 Comparison by Deployment

Chart on Comparison by Deployment
Data Table on Comparison by Deployment

8.3 Cloud based - Market size and forecast 2025-2030

Chart on Cloud based - Market size and forecast 2025-2030 ($ million)
Data Table on Cloud based - Market size and forecast 2025-2030 ($ million)
Chart on Cloud based - Year-over-year growth 2025-2030 (%)
Data Table on Cloud based - Year-over-year growth 2025-2030 (%)

8.4 On premises - Market size and forecast 2025-2030

Chart on On premises - Market size and forecast 2025-2030 ($ million)
Data Table on On premises - Market size and forecast 2025-2030 ($ million)
Chart on On premises - Year-over-year growth 2025-2030 (%)
Data Table on On premises - Year-over-year growth 2025-2030 (%)

8.5 Hybrid - Market size and forecast 2025-2030

Chart on Hybrid - Market size and forecast 2025-2030 ($ million)
Data Table on Hybrid - Market size and forecast 2025-2030 ($ million)
Chart on Hybrid - Year-over-year growth 2025-2030 (%)
Data Table on Hybrid - Year-over-year growth 2025-2030 (%)

8.6 Market opportunity by Deployment

Market opportunity by Deployment ($ million)
Data Table on Market opportunity by Deployment ($ million)

9. Market Segmentation by Application

9.1 Market segments

Chart on Application - Market share 2025-2030 (%)
Data Table on Application - Market share 2025-2030 (%)

9.2 Comparison by Application

Chart on Comparison by Application
Data Table on Comparison by Application

9.3 Process optimization and efficiency - Market size and forecast 2025-2030

Chart on Process optimization and efficiency - Market size and forecast 2025-2030 ($ million)
Data Table on Process optimization and efficiency - Market size and forecast 2025-2030 ($ million)
Chart on Process optimization and efficiency - Year-over-year growth 2025-2030 (%)
Data Table on Process optimization and efficiency - Year-over-year growth 2025-2030 (%)

9.4 Compliance and audit management - Market size and forecast 2025-2030

Chart on Compliance and audit management - Market size and forecast 2025-2030 ($ million)
Data Table on Compliance and audit management - Market size and forecast 2025-2030 ($ million)
Chart on Compliance and audit management - Year-over-year growth 2025-2030 (%)
Data Table on Compliance and audit management - Year-over-year growth 2025-2030 (%)

9.5 Operational intelligence and monitoring - Market size and forecast 2025-2030

Chart on Operational intelligence and monitoring - Market size and forecast 2025-2030 ($ million)
Data Table on Operational intelligence and monitoring - Market size and forecast 2025-2030 ($ million)
Chart on Operational intelligence and monitoring - Year-over-year growth 2025-2030 (%)
Data Table on Operational intelligence and monitoring - Year-over-year growth 2025-2030 (%)

9.6 Market opportunity by Application

Market opportunity by Application ($ million)
Data Table on Market opportunity by Application ($ million)

10. Market Segmentation by End-user

10.1 Market segments

Chart on End-user - Market share 2025-2030 (%)
Data Table on End-user - Market share 2025-2030 (%)

10.2 Comparison by End-user

Chart on Comparison by End-user
Data Table on Comparison by End-user

10.3 Manufacturing - Market size and forecast 2025-2030

Chart on Manufacturing - Market size and forecast 2025-2030 ($ million)
Data Table on Manufacturing - Market size and forecast 2025-2030 ($ million)
Chart on Manufacturing - Year-over-year growth 2025-2030 (%)
Data Table on Manufacturing - Year-over-year growth 2025-2030 (%)

10.4 Energy and utilities - Market size and forecast 2025-2030

Chart on Energy and utilities - Market size and forecast 2025-2030 ($ million)
Data Table on Energy and utilities - Market size and forecast 2025-2030 ($ million)
Chart on Energy and utilities - Year-over-year growth 2025-2030 (%)
Data Table on Energy and utilities - Year-over-year growth 2025-2030 (%)

10.5 Chemicals and process industries - Market size and forecast 2025-2030

Chart on Chemicals and process industries - Market size and forecast 2025-2030 ($ million)
Data Table on Chemicals and process industries - Market size and forecast 2025-2030 ($ million)
Chart on Chemicals and process industries - Year-over-year growth 2025-2030 (%)
Data Table on Chemicals and process industries - Year-over-year growth 2025-2030 (%)

10.6 Oil and gas - Market size and forecast 2025-2030

Chart on Oil and gas - Market size and forecast 2025-2030 ($ million)
Data Table on Oil and gas - Market size and forecast 2025-2030 ($ million)
Chart on Oil and gas - Year-over-year growth 2025-2030 (%)
Data Table on Oil and gas - Year-over-year growth 2025-2030 (%)

10.7 Healthcare - Market size and forecast 2025-2030

Chart on Healthcare - Market size and forecast 2025-2030 ($ million)
Data Table on Healthcare - Market size and forecast 2025-2030 ($ million)
Chart on Healthcare - Year-over-year growth 2025-2030 (%)
Data Table on Healthcare - Year-over-year growth 2025-2030 (%)

10.8 Market opportunity by End-user

Market opportunity by End-user ($ million)
Data Table on Market opportunity by End-user ($ million)

11. Customer Landscape

11.1 Customer landscape overview

Analysis of price sensitivity, lifecycle, customer purchase basket, adoption rates, and purchase criteria

12. Geographic Landscape

12.1 Geographic segmentation

Chart on Market share by geography 2025-2030 (%)
Data Table on Market share by geography 2025-2030 (%)

12.2 Geographic comparison

Chart on Geographic comparison
Data Table on Geographic comparison

12.3 North America - Market size and forecast 2025-2030

Chart on North America - Market size and forecast 2025-2030 ($ million)
Data Table on North America - Market size and forecast 2025-2030 ($ million)
Chart on North America - Year-over-year growth 2025-2030 (%)
Data Table on North America - Year-over-year growth 2025-2030 (%)
Chart on Regional Comparison - North America
Data Table on Regional Comparison - North America

12.3.1 US - Market size and forecast 2025-2030

Chart on US - Market size and forecast 2025-2030 ($ million)
Data Table on US - Market size and forecast 2025-2030 ($ million)
Chart on US - Year-over-year growth 2025-2030 (%)
Data Table on US - Year-over-year growth 2025-2030 (%)

12.3.2 Canada - Market size and forecast 2025-2030

Chart on Canada - Market size and forecast 2025-2030 ($ million)
Data Table on Canada - Market size and forecast 2025-2030 ($ million)
Chart on Canada - Year-over-year growth 2025-2030 (%)
Data Table on Canada - Year-over-year growth 2025-2030 (%)

12.3.3 Mexico - Market size and forecast 2025-2030

Chart on Mexico - Market size and forecast 2025-2030 ($ million)
Data Table on Mexico - Market size and forecast 2025-2030 ($ million)
Chart on Mexico - Year-over-year growth 2025-2030 (%)
Data Table on Mexico - Year-over-year growth 2025-2030 (%)

12.4 Europe - Market size and forecast 2025-2030

Chart on Europe - Market size and forecast 2025-2030 ($ million)
Data Table on Europe - Market size and forecast 2025-2030 ($ million)
Chart on Europe - Year-over-year growth 2025-2030 (%)
Data Table on Europe - Year-over-year growth 2025-2030 (%)
Chart on Regional Comparison - Europe
Data Table on Regional Comparison - Europe

12.4.1 Germany - Market size and forecast 2025-2030

Chart on Germany - Market size and forecast 2025-2030 ($ million)
Data Table on Germany - Market size and forecast 2025-2030 ($ million)
Chart on Germany - Year-over-year growth 2025-2030 (%)
Data Table on Germany - Year-over-year growth 2025-2030 (%)

12.4.2 UK - Market size and forecast 2025-2030

Chart on UK - Market size and forecast 2025-2030 ($ million)
Data Table on UK - Market size and forecast 2025-2030 ($ million)
Chart on UK - Year-over-year growth 2025-2030 (%)
Data Table on UK - Year-over-year growth 2025-2030 (%)

12.4.3 France - Market size and forecast 2025-2030

Chart on France - Market size and forecast 2025-2030 ($ million)
Data Table on France - Market size and forecast 2025-2030 ($ million)
Chart on France - Year-over-year growth 2025-2030 (%)
Data Table on France - Year-over-year growth 2025-2030 (%)

12.4.4 Italy - Market size and forecast 2025-2030

Chart on Italy - Market size and forecast 2025-2030 ($ million)
Data Table on Italy - Market size and forecast 2025-2030 ($ million)
Chart on Italy - Year-over-year growth 2025-2030 (%)
Data Table on Italy - Year-over-year growth 2025-2030 (%)

12.4.5 The Netherlands - Market size and forecast 2025-2030

Chart on The Netherlands - Market size and forecast 2025-2030 ($ million)
Data Table on The Netherlands - Market size and forecast 2025-2030 ($ million)
Chart on The Netherlands - Year-over-year growth 2025-2030 (%)
Data Table on The Netherlands - Year-over-year growth 2025-2030 (%)

12.4.6 Spain - Market size and forecast 2025-2030

Chart on Spain - Market size and forecast 2025-2030 ($ million)
Data Table on Spain - Market size and forecast 2025-2030 ($ million)
Chart on Spain - Year-over-year growth 2025-2030 (%)
Data Table on Spain - Year-over-year growth 2025-2030 (%)

12.5 APAC - Market size and forecast 2025-2030

Chart on APAC - Market size and forecast 2025-2030 ($ million)
Data Table on APAC - Market size and forecast 2025-2030 ($ million)
Chart on APAC - Year-over-year growth 2025-2030 (%)
Data Table on APAC - Year-over-year growth 2025-2030 (%)
Chart on Regional Comparison - APAC
Data Table on Regional Comparison - APAC

12.5.1 China - Market size and forecast 2025-2030

Chart on China - Market size and forecast 2025-2030 ($ million)
Data Table on China - Market size and forecast 2025-2030 ($ million)
Chart on China - Year-over-year growth 2025-2030 (%)
Data Table on China - Year-over-year growth 2025-2030 (%)

12.5.2 Japan - Market size and forecast 2025-2030

Chart on Japan - Market size and forecast 2025-2030 ($ million)
Data Table on Japan - Market size and forecast 2025-2030 ($ million)
Chart on Japan - Year-over-year growth 2025-2030 (%)
Data Table on Japan - Year-over-year growth 2025-2030 (%)

12.5.3 India - Market size and forecast 2025-2030

Chart on India - Market size and forecast 2025-2030 ($ million)
Data Table on India - Market size and forecast 2025-2030 ($ million)
Chart on India - Year-over-year growth 2025-2030 (%)
Data Table on India - Year-over-year growth 2025-2030 (%)

12.5.4 South Korea - Market size and forecast 2025-2030

Chart on South Korea - Market size and forecast 2025-2030 ($ million)
Data Table on South Korea - Market size and forecast 2025-2030 ($ million)
Chart on South Korea - Year-over-year growth 2025-2030 (%)
Data Table on South Korea - Year-over-year growth 2025-2030 (%)

12.5.5 Australia - Market size and forecast 2025-2030

Chart on Australia - Market size and forecast 2025-2030 ($ million)
Data Table on Australia - Market size and forecast 2025-2030 ($ million)
Chart on Australia - Year-over-year growth 2025-2030 (%)
Data Table on Australia - Year-over-year growth 2025-2030 (%)

12.5.6 Indonesia - Market size and forecast 2025-2030

Chart on Indonesia - Market size and forecast 2025-2030 ($ million)
Data Table on Indonesia - Market size and forecast 2025-2030 ($ million)
Chart on Indonesia - Year-over-year growth 2025-2030 (%)
Data Table on Indonesia - Year-over-year growth 2025-2030 (%)

12.6 Middle East and Africa - Market size and forecast 2025-2030

Chart on Middle East and Africa - Market size and forecast 2025-2030 ($ million)
Data Table on Middle East and Africa - Market size and forecast 2025-2030 ($ million)
Chart on Middle East and Africa - Year-over-year growth 2025-2030 (%)
Data Table on Middle East and Africa - Year-over-year growth 2025-2030 (%)
Chart on Regional Comparison - Middle East and Africa
Data Table on Regional Comparison - Middle East and Africa

12.6.1 Saudi Arabia - Market size and forecast 2025-2030

Chart on Saudi Arabia - Market size and forecast 2025-2030 ($ million)
Data Table on Saudi Arabia - Market size and forecast 2025-2030 ($ million)
Chart on Saudi Arabia - Year-over-year growth 2025-2030 (%)
Data Table on Saudi Arabia - Year-over-year growth 2025-2030 (%)

12.6.2 UAE - Market size and forecast 2025-2030

Chart on UAE - Market size and forecast 2025-2030 ($ million)
Data Table on UAE - Market size and forecast 2025-2030 ($ million)
Chart on UAE - Year-over-year growth 2025-2030 (%)
Data Table on UAE - Year-over-year growth 2025-2030 (%)

12.6.3 South Africa - Market size and forecast 2025-2030

Chart on South Africa - Market size and forecast 2025-2030 ($ million)
Data Table on South Africa - Market size and forecast 2025-2030 ($ million)
Chart on South Africa - Year-over-year growth 2025-2030 (%)
Data Table on South Africa - Year-over-year growth 2025-2030 (%)

12.6.4 Israel - Market size and forecast 2025-2030

Chart on Israel - Market size and forecast 2025-2030 ($ million)
Data Table on Israel - Market size and forecast 2025-2030 ($ million)
Chart on Israel - Year-over-year growth 2025-2030 (%)
Data Table on Israel - Year-over-year growth 2025-2030 (%)

12.6.5 Turkey - Market size and forecast 2025-2030

Chart on Turkey - Market size and forecast 2025-2030 ($ million)
Data Table on Turkey - Market size and forecast 2025-2030 ($ million)
Chart on Turkey - Year-over-year growth 2025-2030 (%)
Data Table on Turkey - Year-over-year growth 2025-2030 (%)

12.7 South America - Market size and forecast 2025-2030

Chart on South America - Market size and forecast 2025-2030 ($ million)
Data Table on South America - Market size and forecast 2025-2030 ($ million)
Chart on South America - Year-over-year growth 2025-2030 (%)
Data Table on South America - Year-over-year growth 2025-2030 (%)
Chart on Regional Comparison - South America
Data Table on Regional Comparison - South America

12.7.1 Brazil - Market size and forecast 2025-2030

Chart on Brazil - Market size and forecast 2025-2030 ($ million)
Data Table on Brazil - Market size and forecast 2025-2030 ($ million)
Chart on Brazil - Year-over-year growth 2025-2030 (%)
Data Table on Brazil - Year-over-year growth 2025-2030 (%)

12.7.2 Argentina - Market size and forecast 2025-2030

Chart on Argentina - Market size and forecast 2025-2030 ($ million)
Data Table on Argentina - Market size and forecast 2025-2030 ($ million)
Chart on Argentina - Year-over-year growth 2025-2030 (%)
Data Table on Argentina - Year-over-year growth 2025-2030 (%)

12.7.3 Colombia - Market size and forecast 2025-2030

Chart on Colombia - Market size and forecast 2025-2030 ($ million)
Data Table on Colombia - Market size and forecast 2025-2030 ($ million)
Chart on Colombia - Year-over-year growth 2025-2030 (%)
Data Table on Colombia - Year-over-year growth 2025-2030 (%)

12.8 Market opportunity by geography

Market opportunity by geography ($ million)
Data Tables on Market opportunity by geography ($ million)

13. Drivers, Challenges, and Opportunity

13.1 Market drivers

Accelerated adoption of industry 4.0 and smart manufacturing initiatives
Integration of AI and predictive analytics for proactive decision making
Imperative for supply chain resilience and operational transparency

13.2 Market challenges

Complexities in data extraction and interoperability across heterogeneous systems
Shortage of skilled personnel with cross-domain expertise
Data security and privacy concerns in critical industrial infrastructure

13.3 Impact of drivers and challenges

Impact of drivers and challenges in 2025 and 2030

13.4 Market opportunities

Convergence of hyperautomation in process discovery
Widespread adoption of object-centric process mining for complex value chains
Integration with digital twins for predictive maintenance and sustainability reporting

14. Competitive Landscape

14.1 Overview

14.2

Overview on criticality of inputs and factors of differentiation

14.3 Landscape disruption

Overview on factors of disruption

14.4 Industry risks

Impact of key risks on business

15. Competitive Analysis

15.1 Companies profiled

Companies covered

15.2 Company ranking index

15.3 Market positioning of companies

Matrix on companies position and classification

15.4 ABBYY

ABBYY - Overview
ABBYY - Product / Service
ABBYY - Key offerings
SWOT

15.5 BusinessOptix

BusinessOptix - Overview
BusinessOptix - Product / Service
BusinessOptix - Key offerings
SWOT

15.6 Celonis SE

Celonis SE - Overview
Celonis SE - Product / Service
Celonis SE - Key offerings
SWOT

15.7 Fluxicon BV

Fluxicon BV - Overview
Fluxicon BV - Product / Service
Fluxicon BV - Key offerings
SWOT

15.8 IBM Corp.

IBM Corp. - Overview
IBM Corp. - Business segments
IBM Corp. - Key news
IBM Corp. - Key offerings
IBM Corp. - Segment focus
SWOT

15.9 iGrafx, LLC

iGrafx, LLC - Overview
iGrafx, LLC - Product / Service
iGrafx, LLC - Key offerings
SWOT

15.10 Infor Inc.

Infor Inc. - Overview
Infor Inc. - Product / Service
Infor Inc. - Key offerings
SWOT

15.11 Mehrwerk

Mehrwerk - Overview
Mehrwerk - Product / Service
Mehrwerk - Key offerings
SWOT

15.12 Microsoft Corp.

Microsoft Corp. - Overview
Microsoft Corp. - Business segments
Microsoft Corp. - Key news
Microsoft Corp. - Key offerings
Microsoft Corp. - Segment focus
SWOT

15.13 Pegasystems Inc.

Pegasystems Inc. - Overview
Pegasystems Inc. - Business segments
Pegasystems Inc. - Key offerings
Pegasystems Inc. - Segment focus
SWOT

15.14 QPR Software Plc

QPR Software Plc - Overview
QPR Software Plc - Product / Service
QPR Software Plc - Key offerings
SWOT

15.15 SAG Aris GmbH

SAG Aris GmbH - Overview
SAG Aris GmbH - Product / Service
SAG Aris GmbH - Key offerings
SWOT

15.16 Salesforce Inc.

Salesforce Inc. - Overview
Salesforce Inc. - Business segments
Salesforce Inc. - Key news
Salesforce Inc. - Key offerings
Salesforce Inc. - Segment focus
SWOT

15.17 SAP SE

SAP SE - Overview
SAP SE - Business segments
SAP SE - Key news
SAP SE - Key offerings
SAP SE - Segment focus
SWOT

15.18 UiPath Inc.

UiPath Inc. - Overview
UiPath Inc. - Product / Service
UiPath Inc. - Key news
UiPath Inc. - Key offerings
SWOT

16. Appendix

16.1 Scope of the report

Market definition
Objectives
Notes and caveats

16.2 Inclusions and exclusions checklist

Inclusions checklist
Exclusions checklist

16.3 Currency conversion rates for US$

16.4 Research methodology

16.5 Data procurement

Information sources

16.6 Data validation

16.7 Validation techniques employed for market sizing

16.8 Data synthesis

16.9 360 degree market analysis

16.10 List of abbreviations

Research Methodology

Technavio presents a detailed picture of the market by way of study, synthesis, and summation of data from multiple sources. The analysts have presented the various facets of the market with a particular focus on identifying the key industry influencers. The data thus presented is comprehensive, reliable, and the result of extensive research, both primary and secondary.

INFORMATION SOURCES

Primary sources

  • Manufacturers and suppliers
  • Channel partners
  • Industry experts
  • Strategic decision makers

Secondary sources

  • Industry journals and periodicals
  • Government data
  • Financial reports of key industry players
  • Historical data
  • Press releases

DATA ANALYSIS

Data Synthesis

  • Collation of data
  • Estimation of key figures
  • Analysis of derived insights

Data Validation

  • Triangulation with data models
  • Reference against proprietary databases
  • Corroboration with industry experts

REPORT WRITING

Qualitative

  • Market drivers
  • Market challenges
  • Market trends
  • Five forces analysis

Quantitative

  • Market size and forecast
  • Market segmentation
  • Geographical insights
  • Competitive landscape

Interested in this report?

Get your sample now to see our research methodology and insights!

Download Now

Frequently Asked Questions

Industrial Process Mining Software market growth will increase by USD 7725.0 million during 2026-2030.

The Industrial Process Mining Software market is expected to grow at a CAGR of 56.8% during 2026-2030.

Industrial Process Mining Software market is segmented by Deployment (Cloud based, On premises, Hybrid) Application (Process optimization and efficiency, Compliance and audit management, Operational intelligence and monitoring) End-user (Manufacturing, Energy and utilities, Chemicals and process industries, Oil and gas, Healthcare)

ABBYY, BusinessOptix, Celonis SE, Datricks, Fluxicon BV, IBM Corp., iGrafx, LLC, Infor Inc., Mavim BV, Mehrwerk, Microsoft Corp., mindzie, Pegasystems Inc., Puzzle Data, QPR Software Plc, SAG Aris GmbH, Salesforce Inc., SAP SE, Stereologic, UiPath Inc. are a few of the key vendors in the Industrial Process Mining Software market.

North America will register the highest growth rate of 31.8% among the other regions. Therefore, the Industrial Process Mining Software market in North America is expected to garner significant business opportunities for the vendors during the forecast period.

US, Canada, Mexico, Germany, UK, France, Italy, The Netherlands, Spain, China, Japan, India, South Korea, Australia, Indonesia, Saudi Arabia, UAE, South Africa, Israel, Turkey, Brazil, Argentina, Colombia

  • Accelerated adoption of industry 4.0 and smart manufacturing initiatives is the driving factor this market.

The Industrial Process Mining Software market vendors should focus on grabbing business opportunities from the Deployment segment as it accounted for the largest market share in the base year.
RIA - Research AI Assistant
Ask RIA