Industrial Weighing Machine Market Size 2025-2029
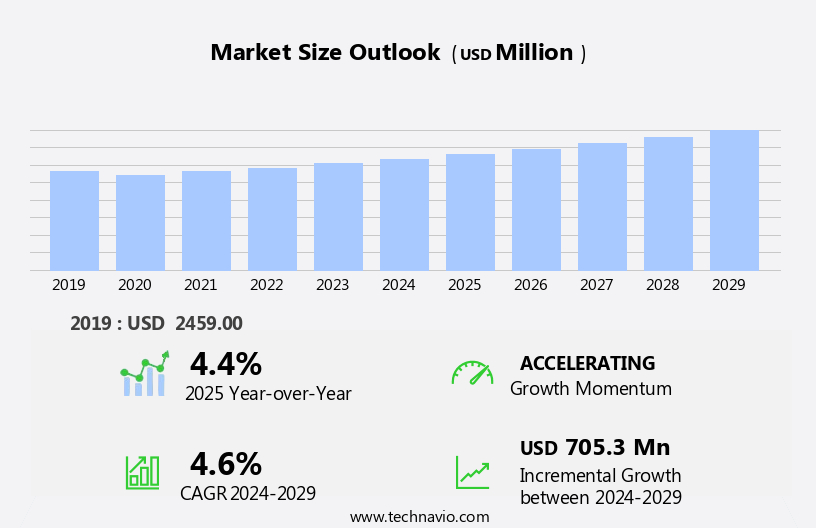
The industrial weighing machine market size is forecast to increase by USD 705.3 million at a CAGR of 4.6% between 2024 and 2029.
- The market is experiencing significant growth, driven by the increasing demand for automated and digital weighing scales in various industries such as manufacturing, agriculture, and logistics. This trend is attributed to the need for increased efficiency, accuracy, and traceability in weighing processes. Additionally, the evolution of cloud-based industrial weighing systems is enabling real-time data access and equipped with artificial intelligence analysis, further boosting market growth. However, market competition is leading to a decline in prices, which may put pressure on profit margins for manufacturers. Another challenge facing the market is the need for stringent regulatory compliance, particularly in industries such as food and pharmaceuticals, which require high levels of precision and traceability.
- Companies seeking to capitalize on market opportunities should focus on offering innovative solutions that address these challenges while maintaining competitive pricing. Meanwhile, those looking to navigate challenges effectively should prioritize regulatory compliance and invest in research and development to stay ahead of the competition.
What will be the Size of the Industrial Weighing Machine Market during the forecast period?
- The market continues to evolve, driven by advancements in technology and the diverse applications across various sectors. Weighing systems, scales, and platforms are increasingly integrated with software solutions for reporting, data logging, and calibration services. Strain gauge technology, digital displays, and cloud connectivity enable real-time data acquisition and remote monitoring, enhancing process automation and inventory management. Force measurement and safety regulations are key considerations, with sensor technology and IoT integration playing crucial roles. Weighing solutions find extensive use in industries such as food processing, material handling, and railroad operations. Applications range from bench scales and crane scales to hopper scales and truck scales, with a focus on system integration and compliance with industry standards.
- Belt scales and load cells facilitate efficient material handling and process control, while data analysis and wireless communication streamline operations. The market's continuous dynamism reflects the ongoing unfolding of market activities and evolving patterns, underscoring the importance of staying informed and adaptive.
How is this Industrial Weighing Machine Industry segmented?
The industrial weighing machine industry research report provides comprehensive data (region-wise segment analysis), with forecasts and estimates in "USD million" for the period 2025-2029, as well as historical data from 2019-2023 for the following segments.
- End-user
- Manufacturing
- Transportation and logistics
- Food and beverage
- Chemicals
- Others
- Type
- Checkweighers
- Weighbridges
- Floor Scales
- Bench Scales
- Crane Scales
- Counting Scales
- Distribution Channel
- Online
- Offline
- Technology
- Digital Weighing Systems
- Analog Weighing Systems
- IoT Enabled Scales
- Automated Weighing Systems
- Capacity
- Low Capacity Scales
- Medium Capacity Scales
- Large Capacity Scales
- Geography
- North America
- US
- Canada
- Europe
- Germany
- UK
- APAC
- Australia
- China
- India
- Japan
- South Korea
- South America
- Brazil
- Rest of World (ROW)
- North America
By End-user Insights
The manufacturing segment is estimated to witness significant growth during the forecast period.
The market experiences consistent expansion, driven by the increasing demand across various manufacturing sectors, including automotive and textiles. These machines play a crucial role in production processes, enabling accurate measurement of raw materials and monitoring of product counts. By integrating reporting software and data logging, manufacturers can efficiently collect and analyze data for process improvement and waste reduction. Calibration services ensure the precision and reliability of the weighing machines, while wireless communication and system integration facilitate seamless data transfer and inventory management. Safety regulations are strictly adhered to, with force measurement and sensor technology ensuring compliance. Weighing systems, including bench scales, crane scales, platform scales, hopper scales, and truck scales, employ strain gauge technology and digital displays for enhanced accuracy and ease of use.
The integration of cloud connectivity, remote monitoring, and IoT enables real-time data acquisition and process control, further boosting efficiency and productivity in material handling and food processing industries.
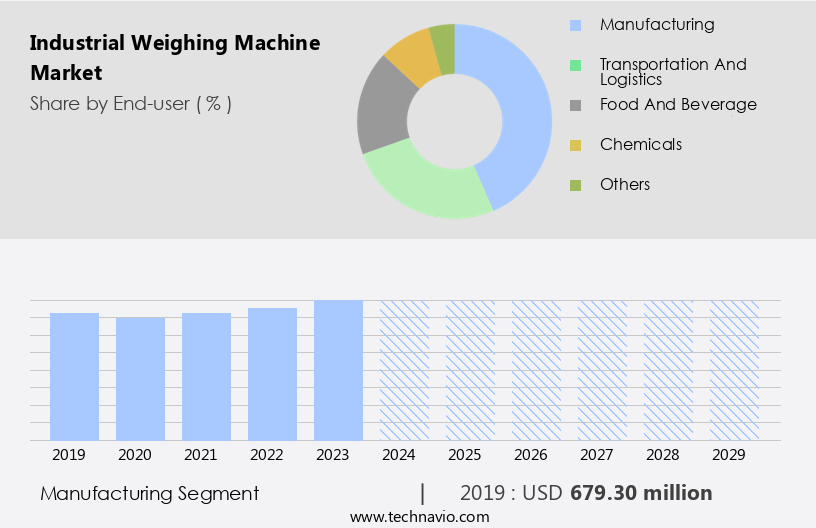
The Manufacturing segment was valued at USD 679.30 million in 2019 and showed a gradual increase during the forecast period.
Regional Analysis
APAC is estimated to contribute 39% to the growth of the global market during the forecast period.Technavio's analysts have elaborately explained the regional trends and drivers that shape the market during the forecast period.
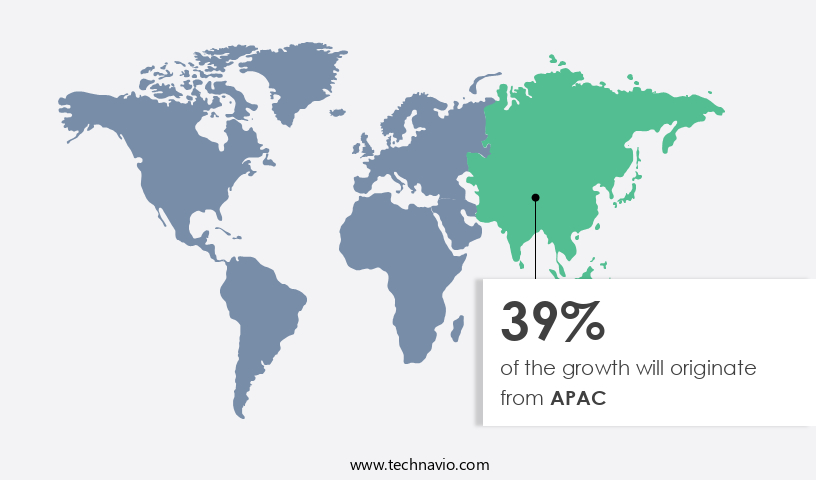
The market in the Asia Pacific region is experiencing significant growth, driven by the expanding manufacturing sector in countries like China, India, and Indonesia. End-user industries such as manufacturing, transportation and logistics, food and beverage, chemical, and mining are all poised for growth in this region. The industrial sector's expansion is attributed to developmental activities and initiatives like Make in India, which have attracted numerous manufacturing companies due to tax exemptions and other incentives. Weighing systems, including crane scales, bench scales, platform scales, hopper scales, belt scales, and truck scales, are integral to various industries for quality control, inventory management, and material handling.
The integration of software solutions, such as reporting software and data logging, enhances process automation and improves efficiency. Safety regulations and compliance standards necessitate regular calibration services and sensor technology to ensure accurate weight measurement. Wireless communication and IoT integration enable remote monitoring and data acquisition, facilitating real-time process control. Force measurement, strain gauge technology, and digital displays are essential components of industrial weighing machines used in food processing and other applications. Compliance with safety regulations and adherence to industry standards are crucial for ensuring the reliability and accuracy of weighing systems. In the context of material handling, weighing machines play a vital role in industries such as mining, chemical processing, and logistics.
Batching systems and railroad scales are essential for ensuring precise measurement and efficient handling of bulk materials. The integration of cloud connectivity and data analysis capabilities allows for real-time data access and insights, enabling informed decision-making and optimizing overall operations. The market's future growth is expected to be driven by the increasing demand for advanced weighing technologies and the integration of automation and wireless communication solutions.
Market Dynamics
The Industrial weighing machine market is experiencing significant growth, driven by evolving industrial weighing equipment market trends. Demand for precise digital weighing scales industrial applications is paramount, with load cells for industrial scales forming the core of these systems. Checkweighers industrial are crucial for quality control in automated lines, while robust weighbridges for heavy loads are essential for logistics. The shift towards automated weighing systems and IoT weighing scales signifies a move towards smarter, more efficient operations. Specialized solutions are vital across sectors, including food and beverage weighing solutions and highly accurate pharmaceutical weighing machines for sensitive materials. The market also sees strong development from weighing machine manufacturers in providing precision balances industrial. Key applications include industrial floor scales, container weighing scales for shipping, and efficient warehouse inventory scales. The integration of wireless weighing solutions industrial and AI in industrial weighing is enhancing data analytics and predictive capabilities. Reliable calibration services for industrial scales are indispensable for maintaining accuracy, particularly for heavy-duty weighing scales for logistics and packaging line weighing equipment.
Our researchers analyzed the data with 2024 as the base year, along with the key drivers, trends, and challenges. A holistic analysis of drivers will help companies refine their marketing strategies to gain a competitive advantage.
What are the key market drivers leading to the rise in the adoption of Industrial Weighing Machine Industry?
- The escalating need for automated and digital weighing scales, driven by increasing demand for efficiency, accuracy, and convenience in various industries, is the primary market growth catalyst.
- In today's industrial landscape, the need for precise and automated weight measurement solutions is paramount for ensuring product and process quality control. Traditional weighing machines, while sufficient for approximate measurements, are being replaced by advanced, digital alternatives that offer accuracy up to decimal points. The integration of reporting software, data logging, and wireless communication enables real-time monitoring and analysis, enhancing operational efficiency and reducing labor costs. Moreover, software integration with process automation systems and crane scales facilitates seamless workflows and minimizes human intervention.
- Calibration services are crucial for maintaining the accuracy and reliability of these machines, making them indispensable in industries where weight measurement is a critical factor. Bench scales, too, have evolved to offer wireless communication and advanced features, making them suitable for various applications. Overall, the market is witnessing significant growth, driven by the demand for automation, precision, and data-driven decision-making.
What are the market trends shaping the Industrial Weighing Machine Industry?
- Cloud-based industrial weighing is gaining significant traction in the market as the next major trend. This evolution offers numerous advantages, including increased efficiency, flexibility, and cost savings through real-time data access and remote system management.
- The market is witnessing significant advancements as manufacturers focus on innovations to meet safety regulations and enhance functionality. Force measurement and sensor technology are key areas of development, with an increasing emphasis on accuracy and reliability. Batching systems and railroad scales are being integrated with system integration capabilities to streamline operations and improve inventory management. Compliance with various standards, such as OIML R-125 and ISO 3760, is crucial for market entry and customer trust. Counting scales are also gaining popularity due to their ability to automate processes and increase efficiency.
- Cloud technology is transforming the industry, enabling real-time data access and analysis for better decision-making. For instance, Fagron, a leading pharmaceutical compounding company, has introduced a PILOT weighing system integrated with Microsoft Dynamics AX ERP solution and IPC (in-process control) for enhanced control and traceability. These advancements underscore the market's potential for continued growth and evolution.
What challenges does the Industrial Weighing Machine Industry face during its growth?
- The intense market competition resulting in price declines poses a significant challenge to the industry's growth trajectory.
- The market encompasses various segments, including manufacturing, food and beverage, chemicals, logistics and transportation, and mining. These machines are integral to weight measurement processes in these industries. The market is characterized by a high degree of competition among local, regional, and international players. The product lifecycle of industrial weighing machines is lengthy, ranging from 5 to 25 years, leading to infrequent sales. To remain competitive, manufacturers invest in technologically advanced and innovative solutions. Strain gauge technology, digital display, and weighing systems are essential features of industrial weighing machines. These machines come in various forms, such as platform scales, weigh bridges, and weigh feeder systems.
- The latest trends include cloud connectivity, remote monitoring, and data acquisition, enabling real-time monitoring and analysis of weight data. These features enhance operational efficiency and productivity in various industries. Manufacturers continually introduce new products to cater to the evolving needs of their customers. For instance, some companies offer customizable solutions tailored to specific industries and applications. Others focus on developing portable and wireless weighing systems for increased flexibility and mobility. Overall, the market is dynamic and competitive, driven by the need for accurate and efficient weight measurement solutions.
Exclusive Customer Landscape
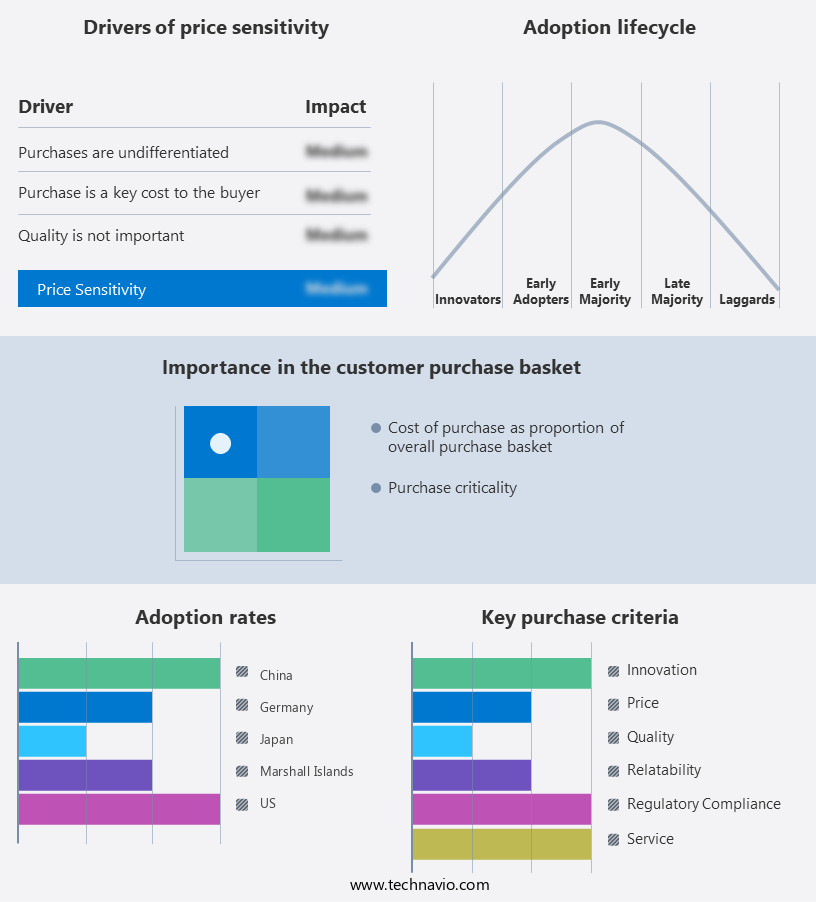
The industrial weighing machine market forecasting report includes the adoption lifecycle of the market, covering from the innovator's stage to the laggard's stage. It focuses on adoption rates in different regions based on penetration. Furthermore, the industrial weighing machine market report also includes key purchase criteria and drivers of price sensitivity to help companies evaluate and develop their market growth analysis strategies.
Customer Landscape
Key Companies & Market Insights
Companies are implementing various strategies, such as strategic alliances, industrial weighing machine market forecast, partnerships, mergers and acquisitions, geographical expansion, and product/service launches, to enhance their presence in the industry.
The industry research and growth report includes detailed analyses of the competitive landscape of the market and information about key companies, including:
- A&D Company Limited
- Adam Equipment Inc.
- Atrax Group NZ Ltd.
- Avery Weigh-Tronix LLC.
- Bizerba SE & Co. KG
- Cardinal Scale Manufacturing Company
- Dini Argeo S.r.l.
- Easiweigh Limited
- Essae-Teraoka Pvt. Ltd.
- Fairbanks Scales Inc.
- Flintec Group AB
- Kern & Sohn GmbH
- Maguire Products Inc.
- Marsden Weighing Group
- Mettler-Toledo International Inc.
- Minebea Intec
- Ohaus Corporation
- Precia Molen
- Rice Lake Weighing Systems Inc.
- Sartorius AG
Qualitative and quantitative analysis of companies has been conducted to help clients understand the wider business environment as well as the strengths and weaknesses of key industry players. Data is qualitatively analyzed to categorize companies as pure play, category-focused, industry-focused, and diversified; it is quantitatively analyzed to categorize companies as dominant, leading, strong, tentative, and weak.
Recent Development and News in Industrial Weighing Machine Market
- In February 2024, leading industrial weighing machine manufacturer, Avery Weigh-Tronix, introduced its new line of wireless weighbridges, expanding its product portfolio and catering to the growing demand for contactless and automated solutions (Avery Weigh-Tronix Press Release).
- In June 2024, Mettler-Toledo and Endress+Hauser, two major players in the industrial weighing market, announced a strategic partnership to jointly develop and market advanced weighing solutions, aiming to strengthen their market position and enhance their offerings (Mettler-Toledo Press Release).
- In October 2024, Oshkosh Corporation, a leading provider of access equipment, completed the acquisition of Vehicle Weighbridge Solutions, a prominent industrial weighing machine manufacturer, marking a significant expansion into the industrial weighing market and broadening its product offerings (Oshkosh Corporation SEC Filing).
- In January 2025, the European Union implemented new regulations on the use of weighing instruments, requiring stricter calibration and maintenance procedures, creating new opportunities for companies offering advanced weighing solutions and services (European Commission Press Release).
Research Analyst Overview
The market encompasses a range of solutions designed to enhance process efficiency and ensure product quality in various industries. Weighing system customization plays a crucial role in meeting unique application requirements, while industrial weighing safety remains a top priority. Advanced weighing technologies, such as wireless data transmission and remote weight monitoring, enable real-time process optimization and cost-effective solutions. Industrial weighbridge design and high-capacity scales cater to heavy-duty applications, ensuring reliability and precision. Quality assurance systems and sensor calibration are essential components of industrial weighing compliance. Weighing system upgrades and automation contribute to increased efficiency and innovation in industrial process control.
Industrial weighing technology continues to evolve, with automated weighing systems and precision weighing equipment offering improved accuracy and advanced data acquisition software. Industrial weighing trends include the integration of Wireless Connectivity, remote monitoring, and AI-driven analytics to streamline operations and enhance productivity. Weighing system design, maintenance, and upgrades are essential to ensuring industrial weighing reliability and accuracy. Innovations in industrial weighing technology, such as high-capacity sensors and advanced calibration techniques, contribute to the ongoing evolution of the market. Process optimization and cost-effective solutions are key drivers in the industrial weighing market, with a focus on improving efficiency and ensuring regulatory compliance.
Remote weight monitoring and automated weighing systems enable real-time data access, enabling proactive decision-making and streamlined operations. Industrial weighing application areas span various industries, including agriculture, construction, manufacturing, and logistics. Weighing system efficiency and industrial weighing solutions continue to evolve, addressing the diverse needs of these sectors and driving market growth.
Dive into Technavio's robust research methodology, blending expert interviews, extensive data synthesis, and validated models for unparalleled Industrial Weighing Machine Market insights. See full methodology.
|
Market Scope |
|
|
Report Coverage |
Details |
|
Page number |
225 |
|
Base year |
2024 |
|
Historic period |
2019-2023 |
|
Forecast period |
2025-2029 |
|
Growth momentum & CAGR |
Accelerate at a CAGR of 4.6% |
|
Market growth 2025-2029 |
USD 705.3 million |
|
Market structure |
Fragmented |
|
YoY growth 2024-2025(%) |
4.4 |
|
Key countries |
US, China, Japan, Canada, India, UK, South Korea, Germany, Brazil, and Australia |
|
Competitive landscape |
Leading Companies, Market Positioning of Companies, Competitive Strategies, and Industry Risks |
What are the Key Data Covered in this Industrial Weighing Machine Market Research and Growth Report?
- CAGR of the Industrial Weighing Machine industry during the forecast period
- Detailed information on factors that will drive the growth and forecasting between 2025 and 2029
- Precise estimation of the size of the market and its contribution of the industry in focus to the parent market
- Accurate predictions about upcoming growth and trends and changes in consumer behaviour
- Growth of the market across APAC, North America, Europe, South America, and Middle East and Africa
- Thorough analysis of the market's competitive landscape and detailed information about companies
- Comprehensive analysis of factors that will challenge the industrial weighing machine market growth of industry companies
Have questions about our market research report? Connect with our Principal Consultant for exclusive insights.
 RIA -
RIA - 
