Insulated Water Bottles Market Analysis, Size, and Forecast 2026-2030: APAC (China, Japan, and India), North America (US, Canada, and Mexico), Europe (Germany, UK, and France), Middle East and Africa (Saudi Arabia, UAE, and South Africa), South America (Brazil, Argentina, and Colombia), and Rest of World (ROW)

Insulated Water Bottles Market Analysis, Size, and Forecast 2026-2030:
APAC (China, Japan, and India), North America (US, Canada, and Mexico), Europe (Germany, UK, and France), Middle East and Africa (Saudi Arabia, UAE, and South Africa), South America (Brazil, Argentina, and Colombia), and Rest of World (ROW)

Published: May 2026 294 Pages SKU: IRTNTR81174

Market Overview at a Glance

$970.6 Mn
Market Opportunity
4.9%
CAGR 2025 - 2030
38.3%
APAC Growth
$1.66 B
Metal segment 2024

Insulated Water Bottles Market Size and Growth Forecast 2026-2030

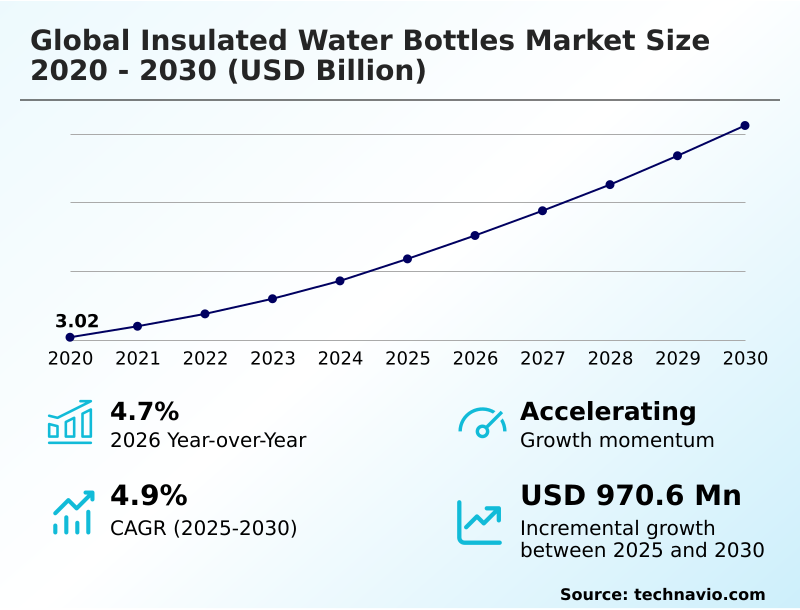
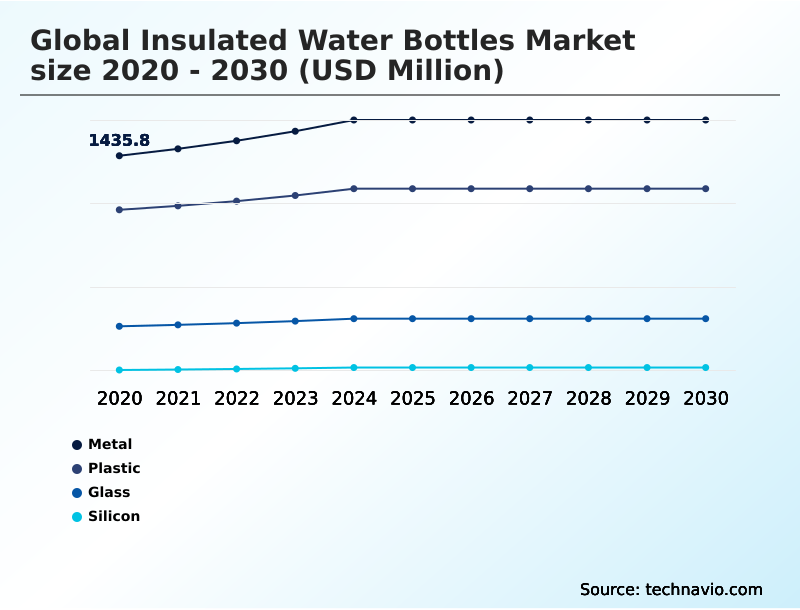
The Insulated Water Bottles Market size was valued at USD 3.59 billion in 2025 growing at a CAGR of 4.9% during the forecast period 2026-2030.

APAC accounts for 38.3% of incremental growth during the forecast period. The Metal segment by Material was valued at USD 1.66 billion in 2024, while the Big mouth segment holds the largest revenue share by Product Type.

The market is projected to grow by USD 1.54 billion from 2020 to 2030, with USD 970.6 million of the growth expected during the forecast period of 2025 to 2030.

Get Key Insights on Market Forecast (PDF) Request Free Sample

Insulated Water Bottles Market Overview

The insulated water bottles market is shaped by a confluence of health-conscious consumerism and stringent environmental mandates. A profound shift away from disposable packaging, driven by regulations like the EU Single-Use Plastics Directive, structurally supports demand for durable, reusable beverage containers. This is complemented by a wellness culture that positions consistent hydration as a key health metric. In practice, a corporate campus implementing a ban on single-use plastics will often provision employees with co-branded bottles featuring a powder coat finish, turning a policy change into a large-scale procurement driver. With APAC accounting for approximately 38% of the incremental growth, the global dynamic is a blend of mature market saturation in the West and rapid first-time adoption in emerging economies. The technical focus remains on enhancing thermal retention through innovations like copper lining and improving user experience with features such as a modular design and advanced leak-proof lid mechanisms. The industry's trajectory is toward creating products that are both high-performance tools and symbols of personal commitment to sustainability and health, integrating non-toxic materials throughout the product lifecycle.

Drivers, Trends, and Challenges in the Insulated Water Bottles Market

Strategic decision-making for firms is increasingly complex, navigating a landscape where the choice between stainless steel vs glass water bottle is no longer just about material but about supply chain resilience and brand positioning.

The EU's Circular Economy Action Plan, for instance, pressures companies to design for longevity and recyclability, influencing material selection toward recycled stainless steel and away from plastics.

An operational scenario involves a product development team evaluating the total cost of ownership for a new line; choosing a durable, chip-resistant coating adds upfront cost but reduces warranty claims and enhances the brand's premium perception, a key factor when creating an insulated tumbler with handle and straw for a competitive market segment.

Sourcing decisions are critical; a reliance on a single region for manufacturing creates vulnerabilities, whereas diversifying suppliers, although potentially increasing costs by 5-10%, mitigates risks from trade tariffs and logistical disruptions.

The question of what is the best insulated bottle for hiking is answered through a combination of lightweight material choice and a secure, leak-proof insulated bottle for travel, demonstrating how use-case-specific engineering drives value.

Ultimately, success hinges on balancing performance, such as creating an insulated water bottle for hot and cold beverages, with a transparent, sustainable narrative that resonates with environmentally conscious consumers.

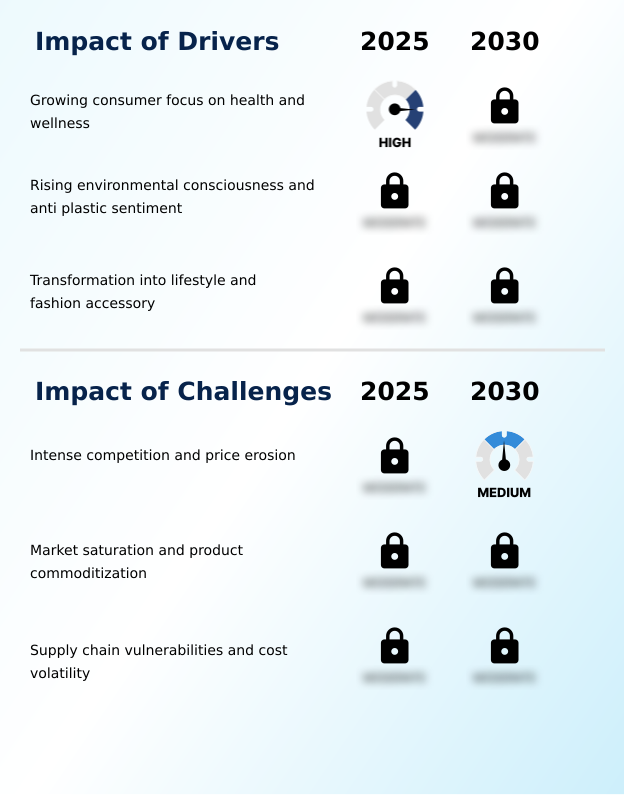
Primary Growth Driver: The market's primary driver is the growing consumer focus on health and wellness, elevating hydration to a central pillar of a healthy lifestyle.

Market growth is fundamentally driven by the product's successful transformation from a utilitarian item into a form of brand identity expression and a key fitness accessory.

This shift, amplified by social media, encourages a replacement cycle based on style and seasonality rather than just product failure. This accessory-fication allows brands to command premium prices.

A parallel driver is the powerful anti-plastic movement, which positions the insulated bottle as a visible and tangible sustainable hydration solution.

This consumer-led momentum is structurally reinforced by corporate wellness programs and institutional bans on disposable plastics, creating a consistent demand pipeline.

This confluence of environmental consciousness and lifestyle branding propels the market forward, turning a simple reusable beverage container into a statement piece with significant cultural and commercial value.

Emerging Market Trend: The integration of smart technology and deep personalization options are transforming insulated water bottles from simple containers into connected wellness devices that reflect individual identity.

Key trends are pushing products into new categories, blurring the lines between drinkware and consumer electronics. The integration of smart bottle technology, utilizing Bluetooth standards for connectivity, enables features like hydration tracking and provides a platform for ongoing user engagement. This move toward a connected personal hydration device is a significant avenue for creating premium product tiers.

Beyond digital enhancements, there is a strong push toward multi-functional design, with innovations like integrated storage compartments for keys or supplements and advanced, all-in-one lids that offer multiple drinking methods. Another prominent trend is the adoption of UV-C self-cleaning technology, which addresses consumer demand for improved hygiene and convenience.

These advancements are indicative of a market that is innovating beyond simple thermal performance to offer enhanced utility and a more integrated wellness experience.

Key Industry Challenge: Intense competition from a fragmented landscape of brands and private labels creates significant price erosion, challenging sustained profitability.

A critical structural challenge is the high dependency on a geographically concentrated supply chain, exposing the market to significant volatility. The majority of manufacturing is centered in a few regions, making the industry susceptible to disruptions from trade policy, geopolitical tensions, and logistical bottlenecks, which can impact the availability of products featuring an ergonomic handle or specific lid types.

Furthermore, the cost of core raw materials, particularly food grade stainless steel, is subject to global commodity price fluctuations, which can directly compress profit margins in a highly competitive retail environment. Navigating these supply chain vulnerabilities requires sophisticated risk management.

Adherence to increasingly stringent ESG reporting standards, like those from the IFRS Foundation, adds another layer of complexity, demanding greater transparency in sourcing and manufacturing processes for all components, including those made of BPA-free plastic.

Explore Full Market Dynamics Analysis Request Free Sample

Insulated Water Bottles Market Segmentation

The insulated water bottles industry research report provides comprehensive data including region-wise segment analysis, with forecasts and analysis for the period 2026-2030, as well as historical data from 2020-2024 for the following segments.

Market Segment by Material
  • Metal
  • Plastic
  • Glass
  • Silicon
Market Segment by Product type
  • Big mouth
  • Fine mouth
  • Tumblers
  • Mugs
Market Segment by Distribution channel
  • Offline
  • Online
Market Segment by Geography
APAC
China, Japan, India, South Korea, Australia, Indonesia
North America
US, Canada, Mexico
Europe
Germany, UK, France, Italy, Spain, The Netherlands
Middle East and Africa
Saudi Arabia, UAE, South Africa, Israel, Turkey
South America
Brazil, Argentina, Colombia

Material Segment Analysis

The metal segment is estimated to witness significant growth during the forecast period.

The metal segment, primarily utilizing food grade stainless steel, forms the foundation of the market. Its dominance is anchored in the superior performance of double wall vacuum insulation, which ensures exceptional thermal retention.

This technology, combined with the inherent durability and flavor neutrality of 18/8 stainless steel, positions these products as a premium, long-lasting choice.

Growth is driven by the alignment with sustainable hydration solution demands, as consumers seek robust alternatives to single-use plastics.

Differentiation is achieved not just through technical prowess but through branding that associates products with an eco-conscious consumerism, advanced powder coat finish options for grip and aesthetics, and innovations in leak-proof lid designs.

The segment's significance is underscored by its substantial contribution to the overall market revenue.

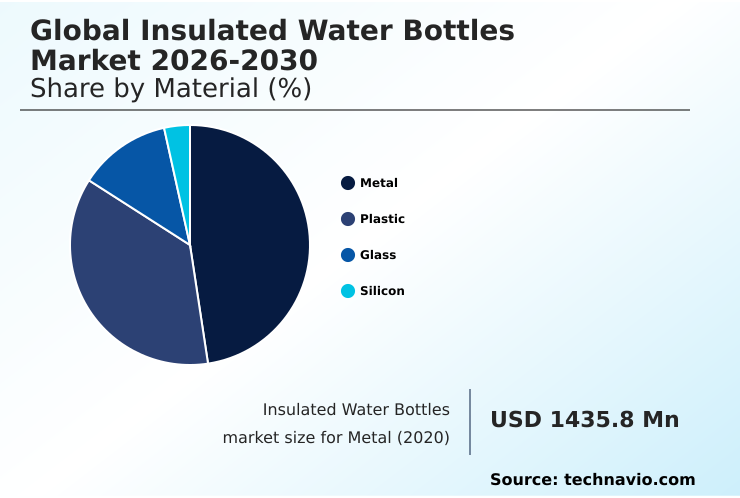
The Metal segment was valued at USD 1.66 billion in 2024 and showed a gradual increase during the forecast period.

Insulated Water Bottles Market by Region: APAC Leads with 38.3% Growth Share

APAC is estimated to contribute 38.3% to the growth of the global market during the forecast period.

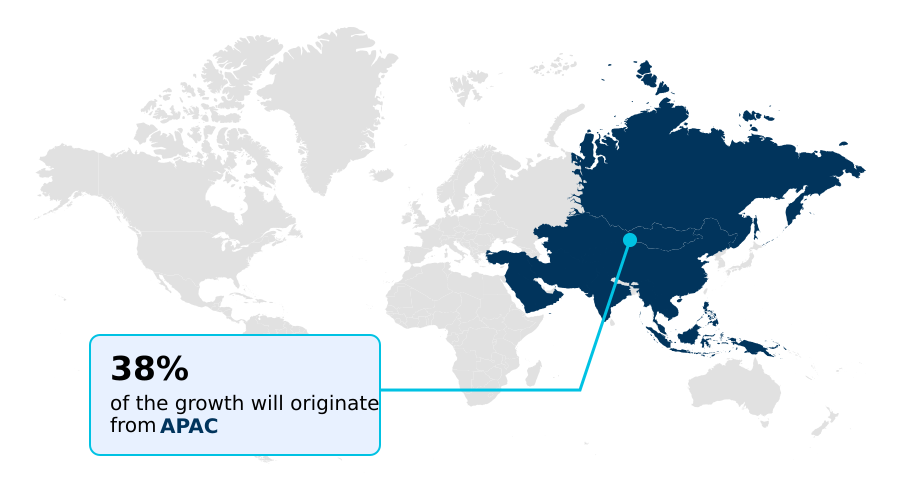
The global geographic landscape is characterized by a divergence between mature and emerging regions. North America and Europe, representing a combined market opportunity of over 51%, are sophisticated markets where growth hinges on replacement cycles and the lifestyle accessory trend.

Here, purchasing decisions are influenced by brand identity and advanced features. In contrast, APAC, which contributes over 38% of the market opportunity, is a high-growth engine fueled by rising disposable incomes and first-time adoption.

Government actions, such as the plastic bottle ban in Assam, India, act as significant catalysts, creating structural demand for a reusable beverage container.

This regional disparity requires manufacturers to employ distinct strategies, balancing premium, feature-rich offerings like a cup holder compatible base for developed markets with durable, cost-effective sustainable hydration solution models for price-sensitive regions.

Customer Landscape Analysis for the Insulated Water Bottles Market

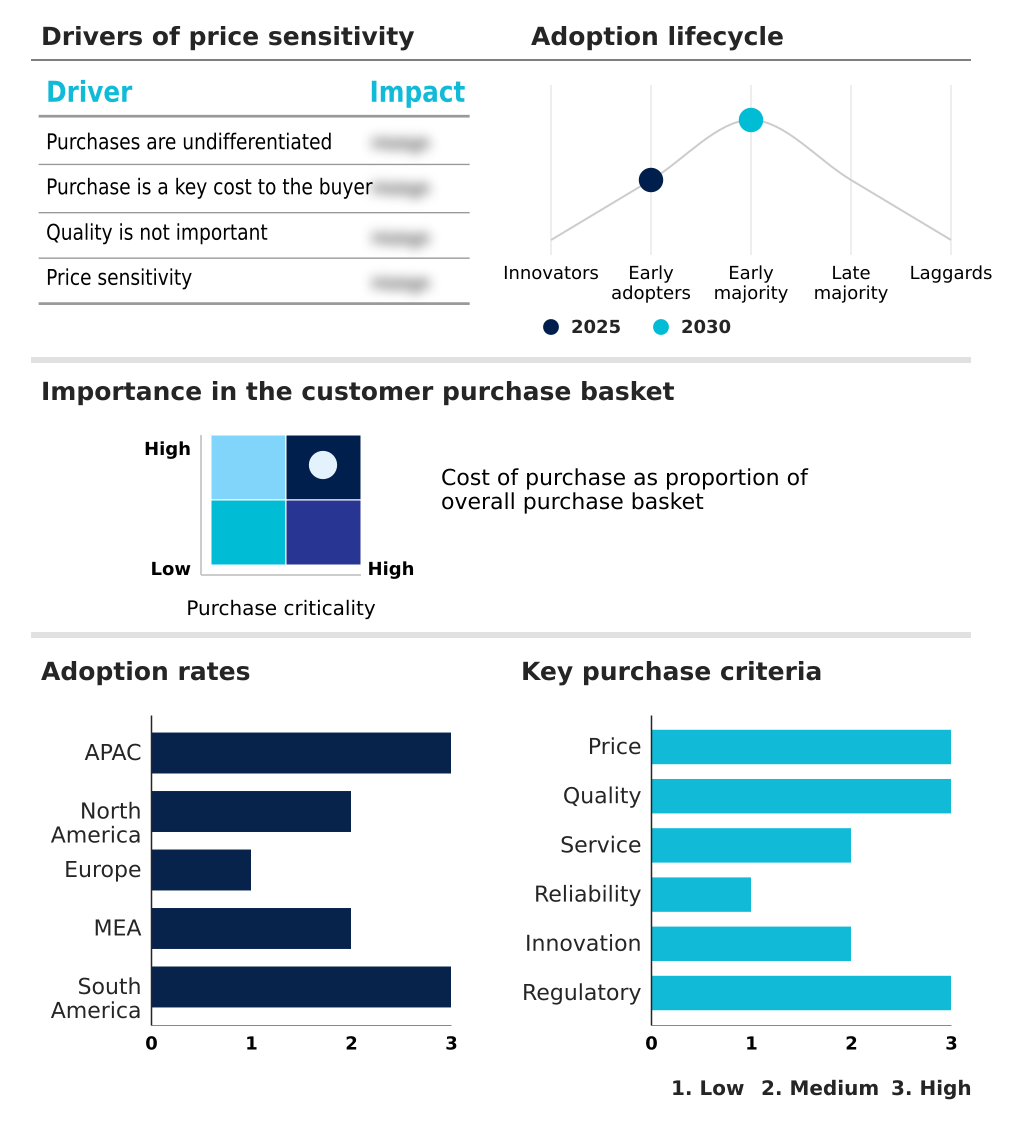
The insulated water bottles market forecasting report includes the adoption lifecycle of the market, covering from the innovator’s stage to the laggard’s stage. It focuses on adoption rates in different regions based on penetration. Furthermore, the insulated water bottles market report also includes key purchase criteria and drivers of price sensitivity to help companies evaluate and develop their market growth analysis strategies.

Competitive Landscape of the Insulated Water Bottles Market

Companies are implementing various strategies, such as strategic alliances, partnerships, mergers and acquisitions, geographical expansion, and product/service launches, to enhance their presence in the insulated water bottles market industry.

Bivo LLC - The company offers performance-engineered hydration solutions specifically designed for the rigorous demands of cycling and outdoor recreational activities.

The industry research and growth report includes detailed analyses of the competitive landscape of the market and information about key companies, including:

  • Bivo LLC
  • Black Blum
  • CamelBak Products
  • Chillys Bottles Ltd.
  • Contigo Brands
  • Klean Kanteen
  • MIRA Brands
  • Nalge Nunc International Corp.
  • Pacific Market International LLC
  • RTIC Outdoors LLC
  • S well
  • SIGG Switzerland Bottles AG
  • Simple Modern LLC
  • Steel Technology LLC
  • Thermos LLC
  • Tiger Corp.
  • Trove Brands LLC.
  • YETI Holdings Inc.
  • Zojirushi America Corp

Qualitative and quantitative analysis of companies has been conducted to help clients understand the wider business environment as well as the strengths and weaknesses of key industry players. Data is qualitatively analyzed to categorize companies as pure play, category-focused, industry-focused, and diversified; it is quantitatively analyzed to categorize companies as dominant, leading, strong, tentative, and weak.

Recent Developments in the Insulated Water Bottles Market

  • In September, 2024, YETI Holdings Inc. announced a multi-year partnership with a major international sports league, becoming the official and exclusive reusable drinkware provider for all teams and venues, a deal valued in the high eight figures.
  • In November, 2024, Trove Brands LLC's Owala brand, launched its 'Owala IQ' line, a new series of smart bottles featuring integrated hydration tracking sensors and a proprietary app that syncs with popular fitness platforms, following a USD 25 million Series B funding round.
  • In February, 2025, Klean Kanteen announced it achieved its goal of constructing 100% of its stainless steel products using certified 90% post-consumer recycled steel, a milestone verified by SCS Global Services.
  • In April, 2025, Pacific Market International LLC's Stanley brand collaborated with a luxury electric vehicle manufacturer to release a limited-edition, co-branded Quencher tumbler designed to fit seamlessly into the vehicle's interior, sold exclusively through the automaker's showrooms.

Research Analyst Overview: Insulated Water Bottles Market

The market has moved beyond simple utility, forcing boardroom decisions to weigh investment in smart bottle technology against the proven returns of aesthetic innovation and material sustainability. While the metal segment remains dominant, its leadership is sustained not by performance alone but by a constant cycle of design-driven updates.

A key strategic challenge is justifying premium pricing in a crowded field. This involves deep integration of non-toxic materials and communicating a commitment to flavor neutrality. Compliance with evolving standards, such as the French Anti-Waste Law (AGEC), compels a focus on the entire product lifecycle, from sourcing recycled stainless steel to ensuring end-of-life recyclability.

For instance, developing a new powder coat finish that is more chip-resistant and eco-friendly is a significant R&D investment but directly addresses consumer concerns about longevity and environmental impact.

Therefore, capital allocation must balance the pursuit of high-tech features like hydration tracking with foundational investments in durability, material safety, and superior thermal retention to defend market share and command premium positioning.

Dive into Technavio’s robust research methodology, blending expert interviews, extensive data synthesis, and validated models for unparalleled Insulated Water Bottles Market insights. See full methodology.

Request Free Sample

Market Scope
Page number 294
Base year 2025
Historic period 2020-2024
Forecast period 2026-2030
Growth momentum & CAGR Accelerate at a CAGR of 4.9%
Market growth 2026-2030 USD 970.6 million
Market structure Fragmented
YoY growth 2025-2026(%) 4.7%
Key countries China, Japan, India, South Korea, Australia, Indonesia, US, Canada, Mexico, Germany, UK, France, Italy, Spain, The Netherlands, Saudi Arabia, UAE, South Africa, Israel, Turkey, Brazil, Argentina and Colombia
Competitive landscape Leading Companies, Market Positioning of Companies, Competitive Strategies, and Industry Risks

Insulated Water Bottles Market: Key Questions Answered in This Report

  • What is the expected growth of the Insulated Water Bottles Market between 2026 and 2030?

    • The Insulated Water Bottles Market is expected to grow by USD 970.6 million during 2026-2030, registering a CAGR of 4.9%. Year-over-year growth in 2026 is estimated at 4.7%%. This acceleration is shaped by growing consumer focus on health and wellness, which is intensifying demand across multiple end-use verticals covered in the report.

  • What segmentation does the market report cover?

    • The report is segmented by Material (Metal, Plastic, Glass, and Silicon), Product Type (Big mouth, Fine mouth, Tumblers, and Mugs), Distribution Channel (Offline, and Online) and Geography (APAC, North America, Europe, Middle East and Africa, South America). Among these, the Metal segment is estimated to witness significant growth during the forecast period, driven by rising adoption across key application areas. Each segment includes detailed qualitative and quantitative analysis, along with historical data from 2020-2024 and forecasts through 2030 with year-over-year growth rates.

  • Which regions are analyzed in the report?

    • The report covers APAC, North America, Europe, Middle East and Africa and South America. APAC is estimated to contribute 38.3% to market growth during the forecast period. Country-level analysis includes China, Japan, India, South Korea, Australia, Indonesia, US, Canada, Mexico, Germany, UK, France, Italy, Spain, The Netherlands, Saudi Arabia, UAE, South Africa, Israel, Turkey, Brazil, Argentina and Colombia, with dedicated market size tables and year-over-year growth for each.

  • What are the key growth drivers and market challenges?

    • The primary driver is growing consumer focus on health and wellness, which is accelerating investment and industry demand. The main challenge is intense competition and price erosion, creating operational barriers for key market participants. The report quantifies the impact of each driver and challenge across 2026 and 2030 with comparative analysis.

  • Who are the major players in the Insulated Water Bottles Market?

    • Key vendors include Bivo LLC, Black Blum, CamelBak Products, Chillys Bottles Ltd., Contigo Brands, Klean Kanteen, MIRA Brands, Nalge Nunc International Corp., Pacific Market International LLC, RTIC Outdoors LLC, S well, SIGG Switzerland Bottles AG, Simple Modern LLC, Steel Technology LLC, Thermos LLC, Tiger Corp., Trove Brands LLC., YETI Holdings Inc. and Zojirushi America Corp. The report provides qualitative and quantitative analysis categorizing companies as dominant, leading, strong, tentative, and weak based on their market positioning. Company profiles include business segment analysis, SWOT assessment, key offerings, and recent strategic developments.

Insulated Water Bottles Market Research Insights

Market dynamics are increasingly governed by the tension between commoditization and brand expression. While the underlying double wall vacuum insulation technology is widely accessible, premium brands differentiate through design, a chip-resistant coating, and by cultivating a strong brand identity expression. This is critical in a landscape where consumer choice is influenced by social media and lifestyle accessory trends.

Geographically, growth is not uniform; the market in APAC is expanding at a faster pace than in North America, reflecting different stages of market maturity and consumer awareness. The ongoing negotiations for a UN global plastics treaty provide a powerful tailwind, reinforcing the market for any single-use plastic alternative and embedding circular economy principles into long-term corporate strategy.

This pressures manufacturers to innovate beyond aesthetics and focus on aspects like product lifecycle sustainability and the use of recycled materials to meet future compliance and consumer expectations.

We can help! Our analysts can customize this insulated water bottles market research report to meet your requirements.

Get in touch

1. Executive Summary

1.1 Market overview

Executive Summary - Chart on Market Overview
Executive Summary - Data Table on Market Overview
Executive Summary - Chart on Global Market Characteristics
Executive Summary - Chart on Market by Geography
Executive Summary - Chart on Market Segmentation by Material
Executive Summary - Chart on Market Segmentation by Product Type
Executive Summary - Chart on Market Segmentation by Distribution Channel
Executive Summary - Chart on Incremental Growth
Executive Summary - Data Table on Incremental Growth
Executive Summary - Chart on Company Market Positioning

2. Technavio Analysis

2.1 Analysis of price sensitivity, lifecycle, customer purchase basket, adoption rates, and purchase criteria

2.2 Criticality of inputs and Factors of differentiation

Chart on Overview on criticality of inputs and factors of differentiation

2.3 Factors of disruption

Chart on Overview on factors of disruption

2.4 Impact of drivers and challenges

Chart on Impact of drivers and challenges in 2025 and 2030

3. Market Landscape

3.1 Market ecosystem

Chart on Parent Market
Data Table on - Parent Market

3.2 Market characteristics

Chart on Market characteristics analysis

3.3 Value chain analysis

Chart on Value chain analysis

4. Market Sizing

4.1 Market definition

Data Table on Offerings of companies included in the market definition

4.2 Market segment analysis

Market segments

4.3 Market size 2025

4.4 Market outlook: Forecast for 2025-2030

Chart on Global - Market size and forecast 2025-2030 ($ million)
Data Table on Global - Market size and forecast 2025-2030 ($ million)
Chart on Global Market: Year-over-year growth 2025-2030 (%)
Data Table on Global Market: Year-over-year growth 2025-2030 (%)

5. Historic Market Size

5.1 Global Insulated Water Bottles Market 2020 - 2024

Historic Market Size - Data Table on Global Insulated Water Bottles Market 2020 - 2024 ($ million)

5.2 Material segment analysis 2020 - 2024

Historic Market Size - Material Segment 2020 - 2024 ($ million)

5.3 Product Type segment analysis 2020 - 2024

Historic Market Size - Product Type Segment 2020 - 2024 ($ million)

5.4 Distribution Channel segment analysis 2020 - 2024

Historic Market Size - Distribution Channel Segment 2020 - 2024 ($ million)

5.5 Geography segment analysis 2020 - 2024

Historic Market Size - Geography Segment 2020 - 2024 ($ million)

5.6 Country segment analysis 2020 - 2024

Historic Market Size - Country Segment 2020 - 2024 ($ million)

6. Qualitative Analysis

6.1 The AI impact on global insulated water bottles market

7. Five Forces Analysis

7.1 Five forces summary

Five forces analysis - Comparison between 2025 and 2030

7.2 Bargaining power of buyers

Bargaining power of buyers - Impact of key factors 2025 and 2030

7.3 Bargaining power of suppliers

Bargaining power of suppliers - Impact of key factors in 2025 and 2030

7.4 Threat of new entrants

Threat of new entrants - Impact of key factors in 2025 and 2030

7.5 Threat of substitutes

Threat of substitutes - Impact of key factors in 2025 and 2030

7.6 Threat of rivalry

Threat of rivalry - Impact of key factors in 2025 and 2030

7.7 Market condition

Chart on Market condition - Five forces 2025 and 2030

8. Market Segmentation by Material

8.1 Market segments

Chart on Material - Market share 2025-2030 (%)
Data Table on Material - Market share 2025-2030 (%)

8.2 Comparison by Material

Chart on Comparison by Material
Data Table on Comparison by Material

8.3 Metal - Market size and forecast 2025-2030

Chart on Metal - Market size and forecast 2025-2030 ($ million)
Data Table on Metal - Market size and forecast 2025-2030 ($ million)
Chart on Metal - Year-over-year growth 2025-2030 (%)
Data Table on Metal - Year-over-year growth 2025-2030 (%)

8.4 Plastic - Market size and forecast 2025-2030

Chart on Plastic - Market size and forecast 2025-2030 ($ million)
Data Table on Plastic - Market size and forecast 2025-2030 ($ million)
Chart on Plastic - Year-over-year growth 2025-2030 (%)
Data Table on Plastic - Year-over-year growth 2025-2030 (%)

8.5 Glass - Market size and forecast 2025-2030

Chart on Glass - Market size and forecast 2025-2030 ($ million)
Data Table on Glass - Market size and forecast 2025-2030 ($ million)
Chart on Glass - Year-over-year growth 2025-2030 (%)
Data Table on Glass - Year-over-year growth 2025-2030 (%)

8.6 Silicon - Market size and forecast 2025-2030

Chart on Silicon - Market size and forecast 2025-2030 ($ million)
Data Table on Silicon - Market size and forecast 2025-2030 ($ million)
Chart on Silicon - Year-over-year growth 2025-2030 (%)
Data Table on Silicon - Year-over-year growth 2025-2030 (%)

8.7 Market opportunity by Material

Market opportunity by Material ($ million)
Data Table on Market opportunity by Material ($ million)

9. Market Segmentation by Product Type

9.1 Market segments

Chart on Product Type - Market share 2025-2030 (%)
Data Table on Product Type - Market share 2025-2030 (%)

9.2 Comparison by Product Type

Chart on Comparison by Product Type
Data Table on Comparison by Product Type

9.3 Big mouth - Market size and forecast 2025-2030

Chart on Big mouth - Market size and forecast 2025-2030 ($ million)
Data Table on Big mouth - Market size and forecast 2025-2030 ($ million)
Chart on Big mouth - Year-over-year growth 2025-2030 (%)
Data Table on Big mouth - Year-over-year growth 2025-2030 (%)

9.4 Fine mouth - Market size and forecast 2025-2030

Chart on Fine mouth - Market size and forecast 2025-2030 ($ million)
Data Table on Fine mouth - Market size and forecast 2025-2030 ($ million)
Chart on Fine mouth - Year-over-year growth 2025-2030 (%)
Data Table on Fine mouth - Year-over-year growth 2025-2030 (%)

9.5 Tumblers - Market size and forecast 2025-2030

Chart on Tumblers - Market size and forecast 2025-2030 ($ million)
Data Table on Tumblers - Market size and forecast 2025-2030 ($ million)
Chart on Tumblers - Year-over-year growth 2025-2030 (%)
Data Table on Tumblers - Year-over-year growth 2025-2030 (%)

9.6 Mugs - Market size and forecast 2025-2030

Chart on Mugs - Market size and forecast 2025-2030 ($ million)
Data Table on Mugs - Market size and forecast 2025-2030 ($ million)
Chart on Mugs - Year-over-year growth 2025-2030 (%)
Data Table on Mugs - Year-over-year growth 2025-2030 (%)

9.7 Market opportunity by Product Type

Market opportunity by Product Type ($ million)
Data Table on Market opportunity by Product Type ($ million)

10. Market Segmentation by Distribution Channel

10.1 Market segments

Chart on Distribution Channel - Market share 2025-2030 (%)
Data Table on Distribution Channel - Market share 2025-2030 (%)

10.2 Comparison by Distribution Channel

Chart on Comparison by Distribution Channel
Data Table on Comparison by Distribution Channel

10.3 Offline - Market size and forecast 2025-2030

Chart on Offline - Market size and forecast 2025-2030 ($ million)
Data Table on Offline - Market size and forecast 2025-2030 ($ million)
Chart on Offline - Year-over-year growth 2025-2030 (%)
Data Table on Offline - Year-over-year growth 2025-2030 (%)

10.4 Online - Market size and forecast 2025-2030

Chart on Online - Market size and forecast 2025-2030 ($ million)
Data Table on Online - Market size and forecast 2025-2030 ($ million)
Chart on Online - Year-over-year growth 2025-2030 (%)
Data Table on Online - Year-over-year growth 2025-2030 (%)

10.5 Market opportunity by Distribution Channel

Market opportunity by Distribution Channel ($ million)
Data Table on Market opportunity by Distribution Channel ($ million)

11. Customer Landscape

11.1 Customer landscape overview

Analysis of price sensitivity, lifecycle, customer purchase basket, adoption rates, and purchase criteria

12. Geographic Landscape

12.1 Geographic segmentation

Chart on Market share by geography 2025-2030 (%)
Data Table on Market share by geography 2025-2030 (%)

12.2 Geographic comparison

Chart on Geographic comparison
Data Table on Geographic comparison

12.3 APAC - Market size and forecast 2025-2030

Chart on APAC - Market size and forecast 2025-2030 ($ million)
Data Table on APAC - Market size and forecast 2025-2030 ($ million)
Chart on APAC - Year-over-year growth 2025-2030 (%)
Data Table on APAC - Year-over-year growth 2025-2030 (%)
Chart on Regional Comparison - APAC
Data Table on Regional Comparison - APAC

12.3.1 China - Market size and forecast 2025-2030

Chart on China - Market size and forecast 2025-2030 ($ million)
Data Table on China - Market size and forecast 2025-2030 ($ million)
Chart on China - Year-over-year growth 2025-2030 (%)
Data Table on China - Year-over-year growth 2025-2030 (%)

12.3.2 Japan - Market size and forecast 2025-2030

Chart on Japan - Market size and forecast 2025-2030 ($ million)
Data Table on Japan - Market size and forecast 2025-2030 ($ million)
Chart on Japan - Year-over-year growth 2025-2030 (%)
Data Table on Japan - Year-over-year growth 2025-2030 (%)

12.3.3 India - Market size and forecast 2025-2030

Chart on India - Market size and forecast 2025-2030 ($ million)
Data Table on India - Market size and forecast 2025-2030 ($ million)
Chart on India - Year-over-year growth 2025-2030 (%)
Data Table on India - Year-over-year growth 2025-2030 (%)

12.3.4 South Korea - Market size and forecast 2025-2030

Chart on South Korea - Market size and forecast 2025-2030 ($ million)
Data Table on South Korea - Market size and forecast 2025-2030 ($ million)
Chart on South Korea - Year-over-year growth 2025-2030 (%)
Data Table on South Korea - Year-over-year growth 2025-2030 (%)

12.3.5 Australia - Market size and forecast 2025-2030

Chart on Australia - Market size and forecast 2025-2030 ($ million)
Data Table on Australia - Market size and forecast 2025-2030 ($ million)
Chart on Australia - Year-over-year growth 2025-2030 (%)
Data Table on Australia - Year-over-year growth 2025-2030 (%)

12.3.6 Indonesia - Market size and forecast 2025-2030

Chart on Indonesia - Market size and forecast 2025-2030 ($ million)
Data Table on Indonesia - Market size and forecast 2025-2030 ($ million)
Chart on Indonesia - Year-over-year growth 2025-2030 (%)
Data Table on Indonesia - Year-over-year growth 2025-2030 (%)

12.4 North America - Market size and forecast 2025-2030

Chart on North America - Market size and forecast 2025-2030 ($ million)
Data Table on North America - Market size and forecast 2025-2030 ($ million)
Chart on North America - Year-over-year growth 2025-2030 (%)
Data Table on North America - Year-over-year growth 2025-2030 (%)
Chart on Regional Comparison - North America
Data Table on Regional Comparison - North America

12.4.1 US - Market size and forecast 2025-2030

Chart on US - Market size and forecast 2025-2030 ($ million)
Data Table on US - Market size and forecast 2025-2030 ($ million)
Chart on US - Year-over-year growth 2025-2030 (%)
Data Table on US - Year-over-year growth 2025-2030 (%)

12.4.2 Canada - Market size and forecast 2025-2030

Chart on Canada - Market size and forecast 2025-2030 ($ million)
Data Table on Canada - Market size and forecast 2025-2030 ($ million)
Chart on Canada - Year-over-year growth 2025-2030 (%)
Data Table on Canada - Year-over-year growth 2025-2030 (%)

12.4.3 Mexico - Market size and forecast 2025-2030

Chart on Mexico - Market size and forecast 2025-2030 ($ million)
Data Table on Mexico - Market size and forecast 2025-2030 ($ million)
Chart on Mexico - Year-over-year growth 2025-2030 (%)
Data Table on Mexico - Year-over-year growth 2025-2030 (%)

12.5 Europe - Market size and forecast 2025-2030

Chart on Europe - Market size and forecast 2025-2030 ($ million)
Data Table on Europe - Market size and forecast 2025-2030 ($ million)
Chart on Europe - Year-over-year growth 2025-2030 (%)
Data Table on Europe - Year-over-year growth 2025-2030 (%)
Chart on Regional Comparison - Europe
Data Table on Regional Comparison - Europe

12.5.1 Germany - Market size and forecast 2025-2030

Chart on Germany - Market size and forecast 2025-2030 ($ million)
Data Table on Germany - Market size and forecast 2025-2030 ($ million)
Chart on Germany - Year-over-year growth 2025-2030 (%)
Data Table on Germany - Year-over-year growth 2025-2030 (%)

12.5.2 UK - Market size and forecast 2025-2030

Chart on UK - Market size and forecast 2025-2030 ($ million)
Data Table on UK - Market size and forecast 2025-2030 ($ million)
Chart on UK - Year-over-year growth 2025-2030 (%)
Data Table on UK - Year-over-year growth 2025-2030 (%)

12.5.3 France - Market size and forecast 2025-2030

Chart on France - Market size and forecast 2025-2030 ($ million)
Data Table on France - Market size and forecast 2025-2030 ($ million)
Chart on France - Year-over-year growth 2025-2030 (%)
Data Table on France - Year-over-year growth 2025-2030 (%)

12.5.4 Italy - Market size and forecast 2025-2030

Chart on Italy - Market size and forecast 2025-2030 ($ million)
Data Table on Italy - Market size and forecast 2025-2030 ($ million)
Chart on Italy - Year-over-year growth 2025-2030 (%)
Data Table on Italy - Year-over-year growth 2025-2030 (%)

12.5.5 Spain - Market size and forecast 2025-2030

Chart on Spain - Market size and forecast 2025-2030 ($ million)
Data Table on Spain - Market size and forecast 2025-2030 ($ million)
Chart on Spain - Year-over-year growth 2025-2030 (%)
Data Table on Spain - Year-over-year growth 2025-2030 (%)

12.5.6 The Netherlands - Market size and forecast 2025-2030

Chart on The Netherlands - Market size and forecast 2025-2030 ($ million)
Data Table on The Netherlands - Market size and forecast 2025-2030 ($ million)
Chart on The Netherlands - Year-over-year growth 2025-2030 (%)
Data Table on The Netherlands - Year-over-year growth 2025-2030 (%)

12.6 Middle East and Africa - Market size and forecast 2025-2030

Chart on Middle East and Africa - Market size and forecast 2025-2030 ($ million)
Data Table on Middle East and Africa - Market size and forecast 2025-2030 ($ million)
Chart on Middle East and Africa - Year-over-year growth 2025-2030 (%)
Data Table on Middle East and Africa - Year-over-year growth 2025-2030 (%)
Chart on Regional Comparison - Middle East and Africa
Data Table on Regional Comparison - Middle East and Africa

12.6.1 Saudi Arabia - Market size and forecast 2025-2030

Chart on Saudi Arabia - Market size and forecast 2025-2030 ($ million)
Data Table on Saudi Arabia - Market size and forecast 2025-2030 ($ million)
Chart on Saudi Arabia - Year-over-year growth 2025-2030 (%)
Data Table on Saudi Arabia - Year-over-year growth 2025-2030 (%)

12.6.2 UAE - Market size and forecast 2025-2030

Chart on UAE - Market size and forecast 2025-2030 ($ million)
Data Table on UAE - Market size and forecast 2025-2030 ($ million)
Chart on UAE - Year-over-year growth 2025-2030 (%)
Data Table on UAE - Year-over-year growth 2025-2030 (%)

12.6.3 South Africa - Market size and forecast 2025-2030

Chart on South Africa - Market size and forecast 2025-2030 ($ million)
Data Table on South Africa - Market size and forecast 2025-2030 ($ million)
Chart on South Africa - Year-over-year growth 2025-2030 (%)
Data Table on South Africa - Year-over-year growth 2025-2030 (%)

12.6.4 Israel - Market size and forecast 2025-2030

Chart on Israel - Market size and forecast 2025-2030 ($ million)
Data Table on Israel - Market size and forecast 2025-2030 ($ million)
Chart on Israel - Year-over-year growth 2025-2030 (%)
Data Table on Israel - Year-over-year growth 2025-2030 (%)

12.6.5 Turkey - Market size and forecast 2025-2030

Chart on Turkey - Market size and forecast 2025-2030 ($ million)
Data Table on Turkey - Market size and forecast 2025-2030 ($ million)
Chart on Turkey - Year-over-year growth 2025-2030 (%)
Data Table on Turkey - Year-over-year growth 2025-2030 (%)

12.7 South America - Market size and forecast 2025-2030

Chart on South America - Market size and forecast 2025-2030 ($ million)
Data Table on South America - Market size and forecast 2025-2030 ($ million)
Chart on South America - Year-over-year growth 2025-2030 (%)
Data Table on South America - Year-over-year growth 2025-2030 (%)
Chart on Regional Comparison - South America
Data Table on Regional Comparison - South America

12.7.1 Brazil - Market size and forecast 2025-2030

Chart on Brazil - Market size and forecast 2025-2030 ($ million)
Data Table on Brazil - Market size and forecast 2025-2030 ($ million)
Chart on Brazil - Year-over-year growth 2025-2030 (%)
Data Table on Brazil - Year-over-year growth 2025-2030 (%)

12.7.2 Argentina - Market size and forecast 2025-2030

Chart on Argentina - Market size and forecast 2025-2030 ($ million)
Data Table on Argentina - Market size and forecast 2025-2030 ($ million)
Chart on Argentina - Year-over-year growth 2025-2030 (%)
Data Table on Argentina - Year-over-year growth 2025-2030 (%)

12.7.3 Colombia - Market size and forecast 2025-2030

Chart on Colombia - Market size and forecast 2025-2030 ($ million)
Data Table on Colombia - Market size and forecast 2025-2030 ($ million)
Chart on Colombia - Year-over-year growth 2025-2030 (%)
Data Table on Colombia - Year-over-year growth 2025-2030 (%)

12.8 Market opportunity by geography

Market opportunity by geography ($ million)
Data Tables on Market opportunity by geography ($ million)

13. Drivers, Challenges, and Opportunity

13.1 Market drivers

Growing consumer focus on health and wellness
Rising environmental consciousness and anti plastic sentiment
Transformation into lifestyle and fashion accessory

13.2 Market challenges

Intense competition and price erosion
Market saturation and product commoditization
Supply chain vulnerabilities and cost volatility

13.3 Impact of drivers and challenges

Impact of drivers and challenges in 2025 and 2030

13.4 Market opportunities

Smart technology integration and deep personalization
Ascent of hybrid and multi-functional designs
Emphasis on advanced materials and circular economy principles

14. Competitive Landscape

14.1 Overview

14.2

Overview on criticality of inputs and factors of differentiation

14.3 Landscape disruption

Overview on factors of disruption

14.4 Industry risks

Impact of key risks on business

15. Competitive Analysis

15.1 Companies profiled

Companies covered

15.2 Company ranking index

15.3 Market positioning of companies

Matrix on companies position and classification

15.4 Bivo LLC

Bivo LLC - Overview
Bivo LLC - Product / Service
Bivo LLC - Key offerings
SWOT

15.5 Black Blum

Black Blum - Overview
Black Blum - Product / Service
Black Blum - Key offerings
SWOT

15.6 CamelBak Products

CamelBak Products - Overview
CamelBak Products - Product / Service
CamelBak Products - Key offerings
SWOT

15.7 Chillys Bottles Ltd.

Chillys Bottles Ltd. - Overview
Chillys Bottles Ltd. - Product / Service
Chillys Bottles Ltd. - Key offerings
SWOT

15.8 Contigo Brands

Contigo Brands - Overview
Contigo Brands - Product / Service
Contigo Brands - Key offerings
SWOT

15.9 Klean Kanteen

Klean Kanteen - Overview
Klean Kanteen - Product / Service
Klean Kanteen - Key offerings
SWOT

15.10 Pacific Market International LLC

Pacific Market International LLC - Overview
Pacific Market International LLC - Product / Service
Pacific Market International LLC - Key offerings
SWOT

15.11 RTIC Outdoors LLC

RTIC Outdoors LLC - Overview
RTIC Outdoors LLC - Product / Service
RTIC Outdoors LLC - Key offerings
SWOT

15.12 S well

S well - Overview
S well - Product / Service
S well - Key offerings
SWOT

15.13 SIGG Switzerland Bottles AG

SIGG Switzerland Bottles AG - Overview
SIGG Switzerland Bottles AG - Product / Service
SIGG Switzerland Bottles AG - Key offerings
SWOT

15.14 Simple Modern LLC

Simple Modern LLC - Overview
Simple Modern LLC - Product / Service
Simple Modern LLC - Key offerings
SWOT

15.15 Steel Technology LLC

Steel Technology LLC - Overview
Steel Technology LLC - Product / Service
Steel Technology LLC - Key offerings
SWOT

15.16 Thermos LLC

Thermos LLC - Overview
Thermos LLC - Product / Service
Thermos LLC - Key offerings
SWOT

15.17 Trove Brands LLC.

Trove Brands LLC. - Overview
Trove Brands LLC. - Product / Service
Trove Brands LLC. - Key offerings
SWOT

15.18 YETI Holdings Inc.

YETI Holdings Inc. - Overview
YETI Holdings Inc. - Product / Service
YETI Holdings Inc. - Key offerings
SWOT

16. Appendix

16.1 Scope of the report

Market definition
Objectives
Notes and caveats

16.2 Inclusions and exclusions checklist

Inclusions checklist
Exclusions checklist

16.3 Currency conversion rates for US$

16.4 Research methodology

16.5 Data procurement

Information sources

16.6 Data validation

16.7 Validation techniques employed for market sizing

16.8 Data synthesis

16.9 360 degree market analysis

16.10 List of abbreviations

Research Methodology

Technavio presents a detailed picture of the market by way of study, synthesis, and summation of data from multiple sources. The analysts have presented the various facets of the market with a particular focus on identifying the key industry influencers. The data thus presented is comprehensive, reliable, and the result of extensive research, both primary and secondary.

INFORMATION SOURCES

Primary sources

  • Manufacturers and suppliers
  • Channel partners
  • Industry experts
  • Strategic decision makers

Secondary sources

  • Industry journals and periodicals
  • Government data
  • Financial reports of key industry players
  • Historical data
  • Press releases

DATA ANALYSIS

Data Synthesis

  • Collation of data
  • Estimation of key figures
  • Analysis of derived insights

Data Validation

  • Triangulation with data models
  • Reference against proprietary databases
  • Corroboration with industry experts

REPORT WRITING

Qualitative

  • Market drivers
  • Market challenges
  • Market trends
  • Five forces analysis

Quantitative

  • Market size and forecast
  • Market segmentation
  • Geographical insights
  • Competitive landscape

Interested in this report?

Get your sample now to see our research methodology and insights!

Download Now

Frequently Asked Questions

Insulated Water Bottles market growth will increase by USD 970.6 million during 2026-2030.

The Insulated Water Bottles market is expected to grow at a CAGR of 4.9% during 2026-2030.

Insulated Water Bottles market is segmented by Material (Metal, Plastic, Glass, Silicon) Product type (Big mouth, Fine mouth, Tumblers, Mugs) Distribution channel (Offline, Online)

Bivo LLC, Black Blum, CamelBak Products, Chillys Bottles Ltd., Contigo Brands, Klean Kanteen, MIRA Brands, Nalge Nunc International Corp., Pacific Market International LLC, RTIC Outdoors LLC, S well, SIGG Switzerland Bottles AG, Simple Modern LLC, Steel Technology LLC, Thermos LLC, Tiger Corp., Trove Brands LLC., YETI Holdings Inc., Zojirushi America Corp are a few of the key vendors in the Insulated Water Bottles market.

APAC will register the highest growth rate of 38.3% among the other regions. Therefore, the Insulated Water Bottles market in APAC is expected to garner significant business opportunities for the vendors during the forecast period.

China, Japan, India, South Korea, Australia, Indonesia, US, Canada, Mexico, Germany, UK, France, Italy, Spain, The Netherlands, Saudi Arabia, UAE, South Africa, Israel, Turkey, Brazil, Argentina, Colombia

  • Growing consumer focus on health and wellness is the driving factor this market.

The Insulated Water Bottles market vendors should focus on grabbing business opportunities from the Material segment as it accounted for the largest market share in the base year.
RIA - Research AI Assistant
Ask RIA