Intravenous (IV) Fluid Bags Market Analysis, Size, and Forecast 2026-2030: North America (US, Canada, and Mexico), Europe (Germany, France, and UK), APAC (China, Japan, and India), South America (Brazil), Middle East and Africa (South Africa, UAE, and Saudi Arabia), Asia, Rest of World (ROW)

Intravenous (IV) Fluid Bags Market Analysis, Size, and Forecast 2026-2030:
North America (US, Canada, and Mexico), Europe (Germany, France, and UK), APAC (China, Japan, and India), South America (Brazil), Middle East and Africa (South Africa, UAE, and Saudi Arabia), Asia, Rest of World (ROW)

Published: Mar 2026 284 Pages SKU: IRTNTR40565

Market Overview at a Glance

$1.01 B
Market Opportunity
6.4%
CAGR 2025 - 2030
30.9%
Asia Growth
$1.36 B
PVC material segment 2024

Intravenous (IV) Fluid Bags Market Size 2026-2030

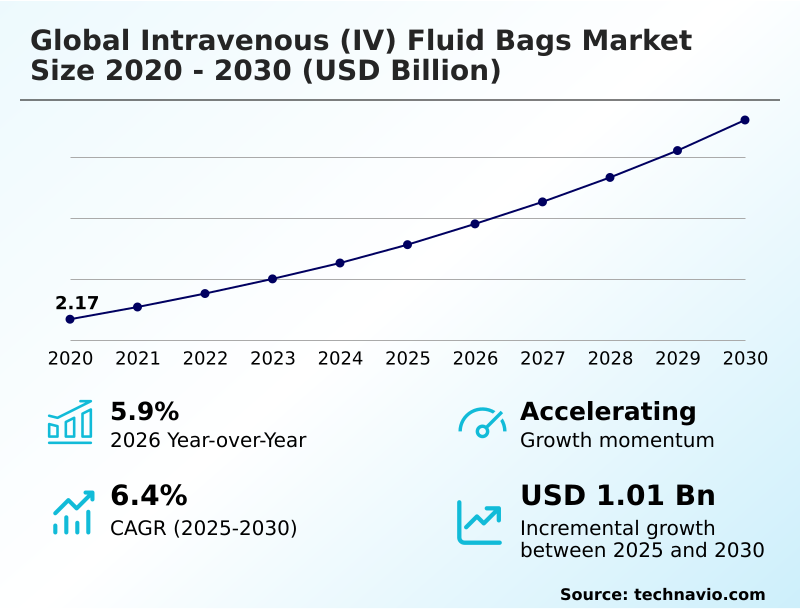
The intravenous (iv) fluid bags market size is valued to increase by USD 1.01 billion, at a CAGR of 6.4% from 2025 to 2030. Rising prevalence of chronic diseases will drive the intravenous (iv) fluid bags market.

Major Market Trends & Insights

  • Asia dominated the market and accounted for a 30.9% growth during the forecast period.
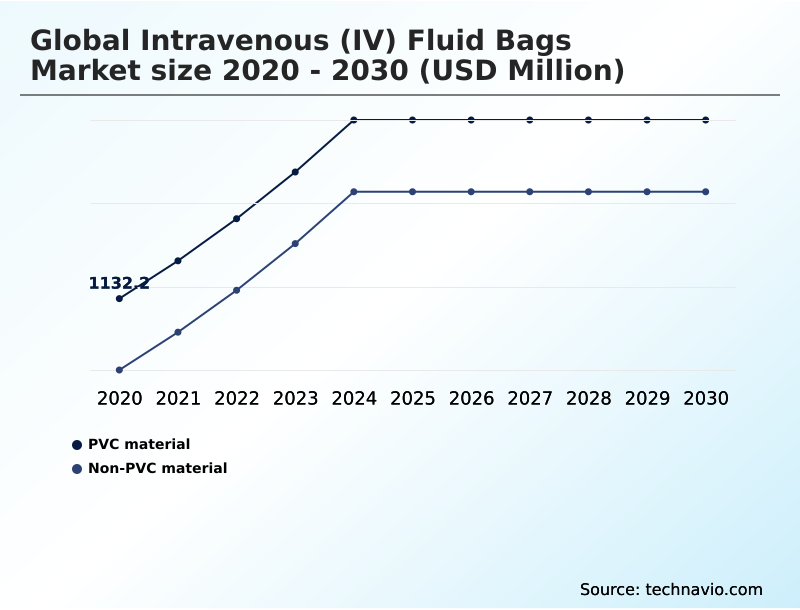
  • By Product - PVC material segment was valued at USD 1.36 billion in 2024
  • By End-user - Hospitals segment accounted for the largest market revenue share in 2024

Market Size & Forecast

  • Market Opportunities: USD 1.63 billion
  • Market Future Opportunities: USD 1.01 billion
  • CAGR from 2025 to 2030 : 6.4%

Market Summary

  • The intravenous (IV) fluid bags market is defined by a consistent need for sterile, reliable fluid delivery systems across global healthcare settings. Growth is fundamentally driven by the rising prevalence of chronic diseases requiring long-term therapy and an expanding volume of surgical procedures.
  • In response, a key trend is the shift toward value-added products, such as premixed solutions that minimize medication errors and multi-chamber bags for complex nutritional therapies. However, the industry grapples with significant challenges, including supply chain fragility exposed by regional disruptions and regulatory pressure to transition toward safer, non-PVC materials.
  • A common business scenario involves hospital procurement teams balancing the cost-effectiveness of traditional PVC bags for general hydration against the clinical necessity and higher expense of advanced, DEHP-free containers for sensitive drug administration. This decision-making is further complicated by the need to secure a resilient supply chain, often requiring a dual-sourcing strategy to mitigate risks from single-point manufacturing failures.
  • The market's evolution hinges on balancing innovation in materials and smart technology with the overriding imperatives of cost control, patient safety, and supply continuity.

What will be the Size of the Intravenous (IV) Fluid Bags Market during the forecast period?

Get Key Insights on Market Forecast (PDF) Request Free Sample

How is the Intravenous (IV) Fluid Bags Market Segmented?

The intravenous (iv) fluid bags industry research report provides comprehensive data (region-wise segment analysis), with forecasts and estimates in "USD million" for the period 2026-2030, as well as historical data from 2020-2024 for the following segments.

  • Product
    • PVC material
    • Non-PVC material
  • End-user
    • Hospitals
    • Home healthcare
    • Others
  • Product type
    • Single-chamber IV bags
    • Multi-chamber IV bags
  • Geography
    • North America
      • US
      • Canada
      • Mexico
    • Europe
      • Germany
      • France
      • UK
    • Asia
    • Rest of World (ROW)

By Product Insights

The pvc material segment is estimated to witness significant growth during the forecast period.

The market is segmented by material, with non-pvc material options driving significant evolution in product design.

Healthcare facilities are increasingly adopting these advanced polymer formulations, including polypropylene films and polyethylene films, to mitigate risks associated with traditional plastics and align with sustainable medical packaging goals.

The emphasis on biocompatible materials is a response to both regulatory pressures and a clinical focus on patient safety. This transition supports circular economy principles by simplifying medical waste management and reducing the environmental impact of pvc medical waste.

While the cost analysis of dehp-free iv bags remains a consideration, facilities that have adopted these ecofriendly medical supplies report an over 70% reduction in harmful emissions during disposal, making multilayer films a strategic choice.

Request Free Sample

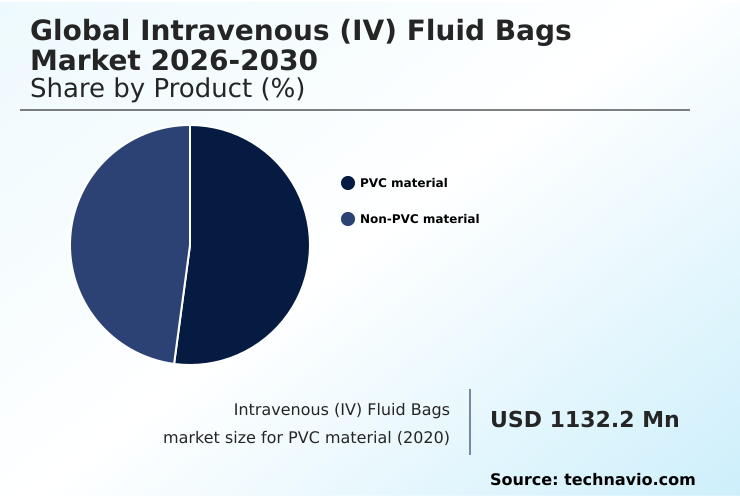
The PVC material segment was valued at USD 1.36 billion in 2024 and showed a gradual increase during the forecast period.

Request Free Sample

Regional Analysis

Asia is estimated to contribute 30.9% to the growth of the global market during the forecast period.Technavio’s analysts have elaborately explained the regional trends and drivers that shape the market during the forecast period.

See How Intravenous (IV) Fluid Bags Market Demand is Rising in Asia Request Free Sample

The geographic landscape is dynamic, with Asia poised to capture over 30% of incremental growth, driven by investments in healthcare infrastructure and a focus on building domestic manufacturing capacity.

This region shows accelerated adoption of advanced intravenous therapy solutions for applications like surgical fluid management and emergency fluid resuscitation.

In contrast, North America remains a mature market where the emphasis is on optimizing existing fluid administration systems and ensuring regulatory compliance for medical grade polymers. The push for dehp-free packaging and innovations in aseptic filling and sealing are prominent.

This bifurcation highlights a global need for reliable intravenous medication delivery, from single-use fluid transfer systems for biopharmaceutical fluid transfer to long-term parenteral nutrition bags, with a universal goal of preventing contamination in iv fluid bags.

Market Dynamics

Our researchers analyzed the data with 2025 as the base year, along with the key drivers, trends, and challenges. A holistic analysis of drivers will help companies refine their marketing strategies to gain a competitive advantage.

  • Strategic decision-making in the market requires a nuanced understanding of evolving product technologies and their specific applications. The benefits of non-pvc iv bags, for instance, are most pronounced in sensitive applications like pediatric and neonatal iv fluid solutions, where the biocompatibility of iv bag materials is paramount.
  • Advancements in multi-chamber iv bag design are critical for delivering long-term parenteral nutrition bags and complex drug regimens, particularly in the role of iv bags in chemotherapy. At the same time, the industry is addressing key operational hurdles.
  • The challenges in medical plastic recycling and the overall environmental impact of pvc medical waste are driving innovation toward more sustainable materials and disposal protocols. From a business perspective, a thorough cost analysis of dehp-free iv bags is essential for budget-conscious healthcare systems.
  • Technologically, the adoption of smart iv bags for inventory management is transforming hospital logistics, with facilities using such systems reporting a reduction in expired stock write-offs by more than 50%. Innovations like forward osmosis technology for iv bags are opening new possibilities for decentralized intravenous therapy models, especially for intravenous fluid bags for home healthcare.
  • Ensuring safety across the supply chain involves a focus on preventing contamination in iv fluid bags through techniques like aseptic filling and sealing of iv bags and the use of specialized aseptic connectors for iv administration.
  • Furthermore, regulatory compliance for medical grade polymers and the development of single-use systems for bioprocessing are shaping the future of both clinical and manufacturing practices. These factors collectively influence the market's trajectory, demanding that companies balance innovation, cost, and regulatory adherence to maintain a competitive edge.

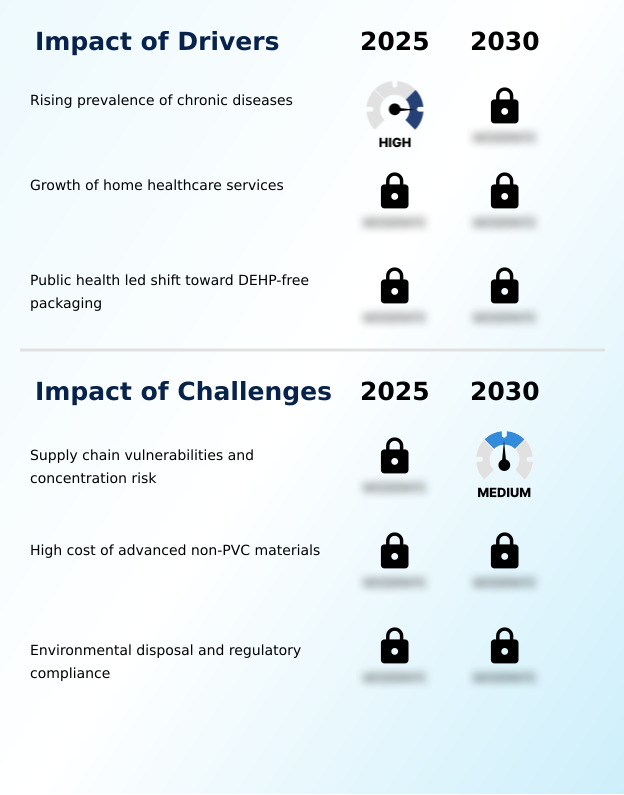
What are the key market drivers leading to the rise in the adoption of Intravenous (IV) Fluid Bags Industry?

  • The rising prevalence of chronic diseases is a foundational driver propelling growth in the intravenous fluid bags market.

  • The rising prevalence of chronic conditions is a primary driver, sustaining demand for single-chamber iv bags and specialized multi-chamber iv bags used for clinical nutrition solutions.
  • This trend is amplified by the expansion of decentralized healthcare models, where ambulatory infusion services and home infusion therapy supplies are essential.
  • The market for intravenous fluid bags for home healthcare is expanding, with demand for parenteral nutrition bags used in the role of iv bags in chemotherapy and other long-term treatments growing by over 15% in certain demographics.
  • Medical packaging innovation, such as the forward osmosis iv bag, addresses logistical challenges in remote settings. This shift also supports specialized needs like pediatric and neonatal iv fluid solutions and strengthens the push for greater domestic manufacturing capacity.

What are the market trends shaping the Intravenous (IV) Fluid Bags Industry?

  • A key trend influencing the market is the increasing adoption of smart intravenous fluid bags integrated with RFID technology, which enhances inventory management and reduces medication administration errors.

  • The adoption of smart intravenous bags is reshaping infusion therapy standards, with innovations like rfid tracking for intravenous fluid bags enabling enhanced hospital inventory management. This technology facilitates a closed loop medication administration process, which has been shown to improve dispensing accuracy by over 95%.
  • Concurrently, the shift toward premixed iv solutions and user-friendly medical devices with advanced closure systems simplifies workflows and is critical for reducing medication errors. These trends, including advancements in multi-chamber iv bag design, align with patient-centered care models by supporting automated dispensing systems and enhancing safety.
  • The integration of a digital fluid monitoring system further optimizes clinical oversight and resource allocation.

What challenges does the Intravenous (IV) Fluid Bags Industry face during its growth?

  • Significant supply chain vulnerabilities and manufacturing concentration risk present a primary challenge affecting the intravenous fluid bags market’s stability.

  • Significant challenges persist around supply chain resilience for iv fluids, as disruptions can impact hospital fluid delivery of essential medical infusion bags used for fluid resuscitation techniques. Production concentration has led to shortages where over 85% of facilities are affected during a single event.
  • Concurrently, environmental concerns regarding medical plastic recycling of medical grade plastic bags and sterile medical containers are intensifying. Disposal of specialized polymer films and other materials used in sterile packaging solutions requires complex protocols.
  • Proper aseptic fluid handling for both gravity based infusion and pump assisted infusion systems generates substantial waste, complicating logistics for items like containers for plasma-derived therapies and creating regulatory hurdles for providers.

Exclusive Technavio Analysis on Customer Landscape

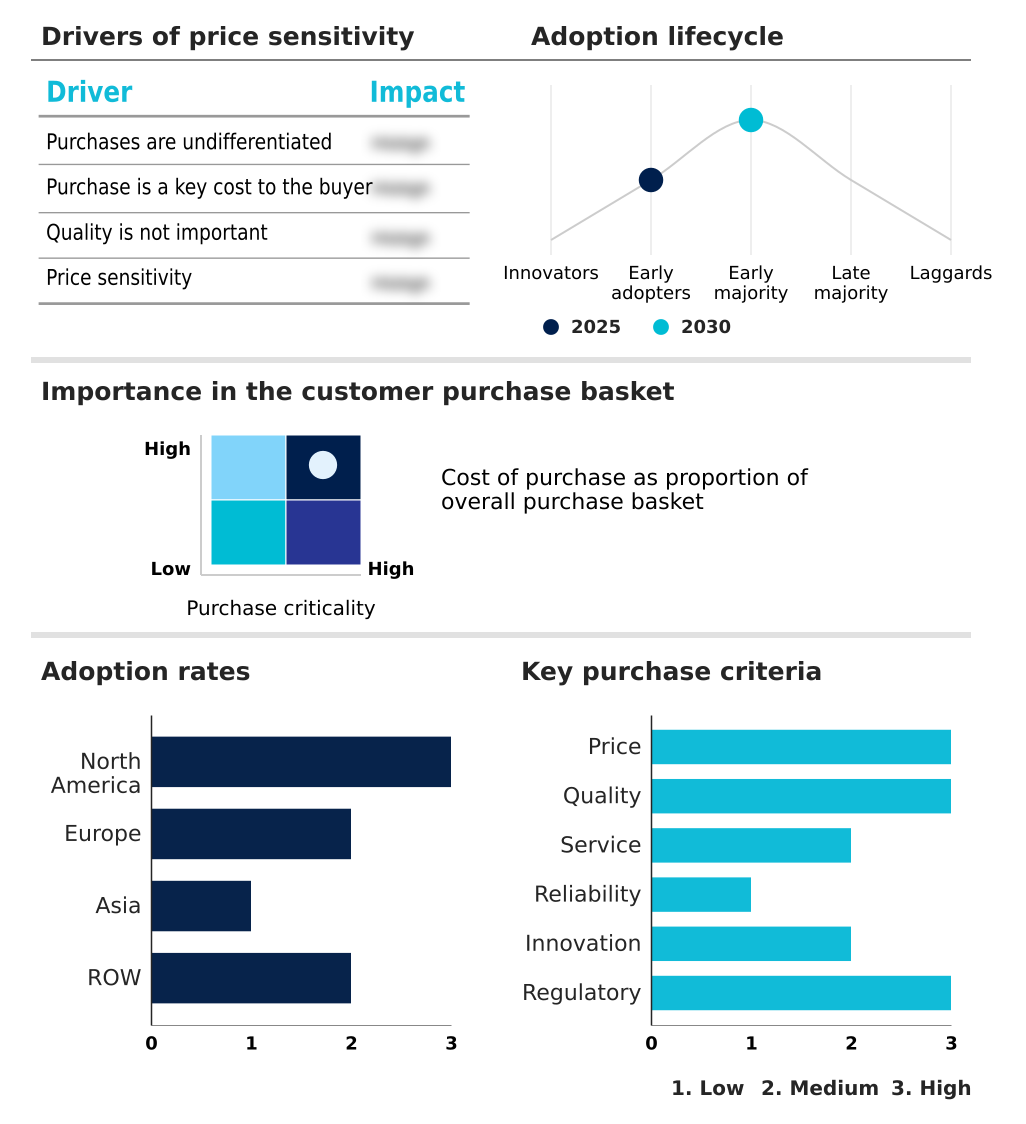
The intravenous (iv) fluid bags market forecasting report includes the adoption lifecycle of the market, covering from the innovator’s stage to the laggard’s stage. It focuses on adoption rates in different regions based on penetration. Furthermore, the intravenous (iv) fluid bags market report also includes key purchase criteria and drivers of price sensitivity to help companies evaluate and develop their market growth analysis strategies.

Customer Landscape of Intravenous (IV) Fluid Bags Industry

Competitive Landscape

Companies are implementing various strategies, such as strategic alliances, intravenous (iv) fluid bags market forecast, partnerships, mergers and acquisitions, geographical expansion, and product/service launches, to enhance their presence in the industry.

Adagia Partners - Provides a comprehensive portfolio of premixed intravenous fluids and empty flexible containers for clinical fluid management and medication delivery.

The industry research and growth report includes detailed analyses of the competitive landscape of the market and information about key companies, including:

  • Adagia Partners
  • B.Braun SE
  • Baxter International Inc.
  • Becton Dickinson and Co.
  • Fosmo Med
  • Fresenius SE and Co. KGaA
  • ICU Medical Inc.
  • Medicopack
  • Medline Inc.
  • Mitra Industries Pvt. Ltd.
  • Otsuka Holdings Co. Ltd.
  • POLYCINE GmbH
  • Puerto Life Sciences Pvt. Ltd.
  • RENOLIT SE
  • Rusoma Laboratories Pvt. Ltd.
  • Sanisure
  • Sartorius AG
  • Sippex
  • The Metrix Co.
  • Vioser SA

Qualitative and quantitative analysis of companies has been conducted to help clients understand the wider business environment as well as the strengths and weaknesses of key industry players. Data is qualitatively analyzed to categorize companies as pure play, category-focused, industry-focused, and diversified; it is quantitatively analyzed to categorize companies as dominant, leading, strong, tentative, and weak.

Recent Development and News in Intravenous (iv) fluid bags market

  • In September, 2024, Baxter International faced significant production disruptions after its North Cove, North Carolina facility, a major source of intravenous fluids for the US, was severely damaged by Hurricane Helene, leading to nationwide shortages and allocation limits.
  • In December, 2024, Endo International introduced the first FDA-approved, manufacturer-prepared ADRENALIN (epinephrine) premixed intravenous bag in the United States, designed to reduce preparation errors and simplify use in clinical settings.
  • In January, 2025, Akkad Holdings announced a $200 million investment to construct an intravenous fluid factory in Mecca, Saudi Arabia, a strategic move to address global supply constraints through localized manufacturing and enhance regional self-reliance.
  • In May, 2025, ICU Medical and Otsuka Pharmaceutical Factory finalized their joint venture, creating Otsuka ICU Medical LLC, which establishes one of the largest global manufacturing networks for intravenous solutions with an estimated combined annual production of 1.4 billion units.

Dive into Technavio’s robust research methodology, blending expert interviews, extensive data synthesis, and validated models for unparalleled Intravenous (IV) Fluid Bags Market insights. See full methodology.

Market Scope
Page number 284
Base year 2025
Historic period 2020-2024
Forecast period 2026-2030
Growth momentum & CAGR Accelerate at a CAGR of 6.4%
Market growth 2026-2030 USD 1014.8 million
Market structure Fragmented
YoY growth 2025-2026(%) 5.9%
Key countries US, Canada, Mexico, Germany, France, UK, Italy, Spain, The Netherlands, Russia, China, Japan, India, South Korea, Indonesia, Thailand, Singapore, Australia, Brazil, South Africa, UAE, Saudi Arabia and Turkey
Competitive landscape Leading Companies, Market Positioning of Companies, Competitive Strategies, and Industry Risks

Request Free Sample

Research Analyst Overview

  • The intravenous (IV) fluid bags market is evolving beyond a commodity-driven model, propelled by technological integration and material science advancements. The adoption of smart intravenous bags and digital fluid monitoring system technologies enables a closed loop medication administration process, enhancing patient safety.
  • Concurrently, a decisive shift toward non-pvc material is underway, driven by demand for dehp-free packaging and more biocompatible materials like polypropylene films and polyethylene films. This transition requires significant boardroom-level capital investment decisions to retool manufacturing lines for these specialized polymer films and multilayer films, ensuring compliance with tightening regulations.
  • Innovations such as advanced closure systems, which can reduce contamination risks by up to 75%, are becoming standard. From single-chamber iv bags for gravity based infusion to complex multi-chamber iv bags for parenteral nutrition bags and clinical nutrition solutions, the focus is on safety and efficiency.
  • The market is also seeing niche growth in products like the forward osmosis iv bag for remote care and ecofriendly medical supplies to address medical plastic recycling challenges.
  • The entire value chain, from aseptic fluid handling and aseptic filling and sealing of medical grade plastic bags and sterile medical containers to final intravenous medication delivery via pump assisted infusion, is being optimized. This extends to specialized applications like ambulatory infusion services, biopharmaceutical fluid transfer, surgical fluid management, and emergency fluid resuscitation.
  • Ultimately, the industry's direction is toward creating safer, more efficient fluid administration systems and user-friendly medical devices through sustained medical packaging innovation.

What are the Key Data Covered in this Intravenous (IV) Fluid Bags Market Research and Growth Report?

  • What is the expected growth of the Intravenous (IV) Fluid Bags Market between 2026 and 2030?

    • USD 1.01 billion, at a CAGR of 6.4%

  • What segmentation does the market report cover?

    • The report is segmented by Product (PVC material, and Non-PVC material), End-user (Hospitals, Home healthcare, and Others), Product Type (Single-chamber IV bags, and Multi-chamber IV bags) and Geography (North America, Europe, Asia, Rest of World (ROW))

  • Which regions are analyzed in the report?

    • North America, Europe, Asia and Rest of World (ROW)

  • What are the key growth drivers and market challenges?

    • Rising prevalence of chronic diseases, Supply chain vulnerabilities and concentration risk

  • Who are the major players in the Intravenous (IV) Fluid Bags Market?

    • Adagia Partners, B.Braun SE, Baxter International Inc., Becton Dickinson and Co., Fosmo Med, Fresenius SE and Co. KGaA, ICU Medical Inc., Medicopack, Medline Inc., Mitra Industries Pvt. Ltd., Otsuka Holdings Co. Ltd., POLYCINE GmbH, Puerto Life Sciences Pvt. Ltd., RENOLIT SE, Rusoma Laboratories Pvt. Ltd., Sanisure, Sartorius AG, Sippex, The Metrix Co. and Vioser SA

Market Research Insights

  • Market dynamics are shaped by a pronounced tension between persistent demand and supply chain fragility. The expansion of home infusion therapy supplies and decentralized healthcare models fuels consumption, yet reliance on concentrated manufacturing hubs creates significant risk. During recent disruptions, over 86% of hospitals reported shortages, with some suppliers imposing allocation limits as low as 60% of normal volumes.
  • This volatility accelerates the adoption of innovations aimed at improving efficiency and safety. For instance, the use of premixed intravenous therapy solutions has been shown to reduce preparation errors by over 90% compared to manual compounding, directly impacting patient-centered care models.
  • Strategic focus is therefore shifting toward enhancing supply chain resilience for iv fluids and investing in technologies that support safer, more efficient hospital fluid delivery and automated dispensing systems.

We can help! Our analysts can customize this intravenous (iv) fluid bags market research report to meet your requirements.

Get in touch

1. Executive Summary

1.1 Market overview

Executive Summary - Chart on Market Overview
Executive Summary - Data Table on Market Overview
Executive Summary - Chart on Global Market Characteristics
Executive Summary - Chart on Market by Geography
Executive Summary - Chart on Market Segmentation by Product
Executive Summary - Chart on Market Segmentation by End-user
Executive Summary - Chart on Market Segmentation by Product Type
Executive Summary - Chart on Incremental Growth
Executive Summary - Data Table on Incremental Growth
Executive Summary - Chart on Company Market Positioning

2. Technavio Analysis

2.1 Analysis of price sensitivity, lifecycle, customer purchase basket, adoption rates, and purchase criteria

2.2 Criticality of inputs and Factors of differentiation

Chart on Overview on criticality of inputs and factors of differentiation

2.3 Factors of disruption

Chart on Overview on factors of disruption

2.4 Impact of drivers and challenges

Chart on Impact of drivers and challenges in 2025 and 2030

3. Market Landscape

3.1 Market ecosystem

Chart on Parent Market
Data Table on - Parent Market

3.2 Market characteristics

Chart on Market characteristics analysis

3.3 Value chain analysis

Chart on Value chain analysis

4. Market Sizing

4.1 Market definition

Data Table on Offerings of companies included in the market definition

4.2 Market segment analysis

Market segments

4.3 Market size 2025

4.4 Market outlook: Forecast for 2025-2030

Chart on Global - Market size and forecast 2025-2030 ($ million)
Data Table on Global - Market size and forecast 2025-2030 ($ million)
Chart on Global Market: Year-over-year growth 2025-2030 (%)
Data Table on Global Market: Year-over-year growth 2025-2030 (%)

5. Historic Market Size

5.1 Global Intravenous (IV) Fluid Bags Market 2020 - 2024

Historic Market Size - Data Table on Global Intravenous (IV) Fluid Bags Market 2020 - 2024 ($ million)

5.2 Product segment analysis 2020 - 2024

Historic Market Size - Product Segment 2020 - 2024 ($ million)

5.3 End-user segment analysis 2020 - 2024

Historic Market Size - End-user Segment 2020 - 2024 ($ million)

5.4 Product Type segment analysis 2020 - 2024

Historic Market Size - Product Type Segment 2020 - 2024 ($ million)

5.5 Geography segment analysis 2020 - 2024

Historic Market Size - Geography Segment 2020 - 2024 ($ million)

5.6 Country segment analysis 2020 - 2024

Historic Market Size - Country Segment 2020 - 2024 ($ million)

6. Qualitative Analysis

6.1 Impact of AI on Global Intravenous Fluid Bags Market

7. Five Forces Analysis

7.1 Five forces summary

Five forces analysis - Comparison between 2025 and 2030

7.2 Bargaining power of buyers

Bargaining power of buyers - Impact of key factors 2025 and 2030

7.3 Bargaining power of suppliers

Bargaining power of suppliers - Impact of key factors in 2025 and 2030

7.4 Threat of new entrants

Threat of new entrants - Impact of key factors in 2025 and 2030

7.5 Threat of substitutes

Threat of substitutes - Impact of key factors in 2025 and 2030

7.6 Threat of rivalry

Threat of rivalry - Impact of key factors in 2025 and 2030

7.7 Market condition

Chart on Market condition - Five forces 2025 and 2030

8. Market Segmentation by Product

8.1 Market segments

Chart on Product - Market share 2025-2030 (%)
Data Table on Product - Market share 2025-2030 (%)

8.2 Comparison by Product

Chart on Comparison by Product
Data Table on Comparison by Product

8.3 PVC material - Market size and forecast 2025-2030

Chart on PVC material - Market size and forecast 2025-2030 ($ million)
Data Table on PVC material - Market size and forecast 2025-2030 ($ million)
Chart on PVC material - Year-over-year growth 2025-2030 (%)
Data Table on PVC material - Year-over-year growth 2025-2030 (%)

8.4 Non-PVC material - Market size and forecast 2025-2030

Chart on Non-PVC material - Market size and forecast 2025-2030 ($ million)
Data Table on Non-PVC material - Market size and forecast 2025-2030 ($ million)
Chart on Non-PVC material - Year-over-year growth 2025-2030 (%)
Data Table on Non-PVC material - Year-over-year growth 2025-2030 (%)

8.5 Market opportunity by Product

Market opportunity by Product ($ million)
Data Table on Market opportunity by Product ($ million)

9. Market Segmentation by End-user

9.1 Market segments

Chart on End-user - Market share 2025-2030 (%)
Data Table on End-user - Market share 2025-2030 (%)

9.2 Comparison by End-user

Chart on Comparison by End-user
Data Table on Comparison by End-user

9.3 Hospitals - Market size and forecast 2025-2030

Chart on Hospitals - Market size and forecast 2025-2030 ($ million)
Data Table on Hospitals - Market size and forecast 2025-2030 ($ million)
Chart on Hospitals - Year-over-year growth 2025-2030 (%)
Data Table on Hospitals - Year-over-year growth 2025-2030 (%)

9.4 Home healthcare - Market size and forecast 2025-2030

Chart on Home healthcare - Market size and forecast 2025-2030 ($ million)
Data Table on Home healthcare - Market size and forecast 2025-2030 ($ million)
Chart on Home healthcare - Year-over-year growth 2025-2030 (%)
Data Table on Home healthcare - Year-over-year growth 2025-2030 (%)

9.5 Others - Market size and forecast 2025-2030

Chart on Others - Market size and forecast 2025-2030 ($ million)
Data Table on Others - Market size and forecast 2025-2030 ($ million)
Chart on Others - Year-over-year growth 2025-2030 (%)
Data Table on Others - Year-over-year growth 2025-2030 (%)

9.6 Market opportunity by End-user

Market opportunity by End-user ($ million)
Data Table on Market opportunity by End-user ($ million)

10. Market Segmentation by Product Type

10.1 Market segments

Chart on Product Type - Market share 2025-2030 (%)
Data Table on Product Type - Market share 2025-2030 (%)

10.2 Comparison by Product Type

Chart on Comparison by Product Type
Data Table on Comparison by Product Type

10.3 Single-chamber IV bags - Market size and forecast 2025-2030

Chart on Single-chamber IV bags - Market size and forecast 2025-2030 ($ million)
Data Table on Single-chamber IV bags - Market size and forecast 2025-2030 ($ million)
Chart on Single-chamber IV bags - Year-over-year growth 2025-2030 (%)
Data Table on Single-chamber IV bags - Year-over-year growth 2025-2030 (%)

10.4 Multi-chamber IV bags - Market size and forecast 2025-2030

Chart on Multi-chamber IV bags - Market size and forecast 2025-2030 ($ million)
Data Table on Multi-chamber IV bags - Market size and forecast 2025-2030 ($ million)
Chart on Multi-chamber IV bags - Year-over-year growth 2025-2030 (%)
Data Table on Multi-chamber IV bags - Year-over-year growth 2025-2030 (%)

10.5 Market opportunity by Product Type

Market opportunity by Product Type ($ million)
Data Table on Market opportunity by Product Type ($ million)

11. Customer Landscape

11.1 Customer landscape overview

Analysis of price sensitivity, lifecycle, customer purchase basket, adoption rates, and purchase criteria

12. Geographic Landscape

12.1 Geographic segmentation

Chart on Market share by geography 2025-2030 (%)
Data Table on Market share by geography 2025-2030 (%)

12.2 Geographic comparison

Chart on Geographic comparison
Data Table on Geographic comparison

12.3 North America - Market size and forecast 2025-2030

Chart on North America - Market size and forecast 2025-2030 ($ million)
Data Table on North America - Market size and forecast 2025-2030 ($ million)
Chart on North America - Year-over-year growth 2025-2030 (%)
Data Table on North America - Year-over-year growth 2025-2030 (%)
Chart on Regional Comparison - North America
Data Table on Regional Comparison - North America

12.3.1 US - Market size and forecast 2025-2030

Chart on US - Market size and forecast 2025-2030 ($ million)
Data Table on US - Market size and forecast 2025-2030 ($ million)
Chart on US - Year-over-year growth 2025-2030 (%)
Data Table on US - Year-over-year growth 2025-2030 (%)

12.3.2 Canada - Market size and forecast 2025-2030

Chart on Canada - Market size and forecast 2025-2030 ($ million)
Data Table on Canada - Market size and forecast 2025-2030 ($ million)
Chart on Canada - Year-over-year growth 2025-2030 (%)
Data Table on Canada - Year-over-year growth 2025-2030 (%)

12.3.3 Mexico - Market size and forecast 2025-2030

Chart on Mexico - Market size and forecast 2025-2030 ($ million)
Data Table on Mexico - Market size and forecast 2025-2030 ($ million)
Chart on Mexico - Year-over-year growth 2025-2030 (%)
Data Table on Mexico - Year-over-year growth 2025-2030 (%)

12.4 Europe - Market size and forecast 2025-2030

Chart on Europe - Market size and forecast 2025-2030 ($ million)
Data Table on Europe - Market size and forecast 2025-2030 ($ million)
Chart on Europe - Year-over-year growth 2025-2030 (%)
Data Table on Europe - Year-over-year growth 2025-2030 (%)
Chart on Regional Comparison - Europe
Data Table on Regional Comparison - Europe

12.4.1 Germany - Market size and forecast 2025-2030

Chart on Germany - Market size and forecast 2025-2030 ($ million)
Data Table on Germany - Market size and forecast 2025-2030 ($ million)
Chart on Germany - Year-over-year growth 2025-2030 (%)
Data Table on Germany - Year-over-year growth 2025-2030 (%)

12.4.2 France - Market size and forecast 2025-2030

Chart on France - Market size and forecast 2025-2030 ($ million)
Data Table on France - Market size and forecast 2025-2030 ($ million)
Chart on France - Year-over-year growth 2025-2030 (%)
Data Table on France - Year-over-year growth 2025-2030 (%)

12.4.3 UK - Market size and forecast 2025-2030

Chart on UK - Market size and forecast 2025-2030 ($ million)
Data Table on UK - Market size and forecast 2025-2030 ($ million)
Chart on UK - Year-over-year growth 2025-2030 (%)
Data Table on UK - Year-over-year growth 2025-2030 (%)

12.4.4 Italy - Market size and forecast 2025-2030

Chart on Italy - Market size and forecast 2025-2030 ($ million)
Data Table on Italy - Market size and forecast 2025-2030 ($ million)
Chart on Italy - Year-over-year growth 2025-2030 (%)
Data Table on Italy - Year-over-year growth 2025-2030 (%)

12.4.5 Spain - Market size and forecast 2025-2030

Chart on Spain - Market size and forecast 2025-2030 ($ million)
Data Table on Spain - Market size and forecast 2025-2030 ($ million)
Chart on Spain - Year-over-year growth 2025-2030 (%)
Data Table on Spain - Year-over-year growth 2025-2030 (%)

12.4.6 The Netherlands - Market size and forecast 2025-2030

Chart on The Netherlands - Market size and forecast 2025-2030 ($ million)
Data Table on The Netherlands - Market size and forecast 2025-2030 ($ million)
Chart on The Netherlands - Year-over-year growth 2025-2030 (%)
Data Table on The Netherlands - Year-over-year growth 2025-2030 (%)

12.4.7 Russia - Market size and forecast 2025-2030

Chart on Russia - Market size and forecast 2025-2030 ($ million)
Data Table on Russia - Market size and forecast 2025-2030 ($ million)
Chart on Russia - Year-over-year growth 2025-2030 (%)
Data Table on Russia - Year-over-year growth 2025-2030 (%)

12.5 Asia - Market size and forecast 2025-2030

Chart on Asia - Market size and forecast 2025-2030 ($ million)
Data Table on Asia - Market size and forecast 2025-2030 ($ million)
Chart on Asia - Year-over-year growth 2025-2030 (%)
Data Table on Asia - Year-over-year growth 2025-2030 (%)
Chart on Regional Comparison - Asia
Data Table on Regional Comparison - Asia

12.5.1 China - Market size and forecast 2025-2030

Chart on China - Market size and forecast 2025-2030 ($ million)
Data Table on China - Market size and forecast 2025-2030 ($ million)
Chart on China - Year-over-year growth 2025-2030 (%)
Data Table on China - Year-over-year growth 2025-2030 (%)

12.5.2 Japan - Market size and forecast 2025-2030

Chart on Japan - Market size and forecast 2025-2030 ($ million)
Data Table on Japan - Market size and forecast 2025-2030 ($ million)
Chart on Japan - Year-over-year growth 2025-2030 (%)
Data Table on Japan - Year-over-year growth 2025-2030 (%)

12.5.3 India - Market size and forecast 2025-2030

Chart on India - Market size and forecast 2025-2030 ($ million)
Data Table on India - Market size and forecast 2025-2030 ($ million)
Chart on India - Year-over-year growth 2025-2030 (%)
Data Table on India - Year-over-year growth 2025-2030 (%)

12.5.4 South Korea - Market size and forecast 2025-2030

Chart on South Korea - Market size and forecast 2025-2030 ($ million)
Data Table on South Korea - Market size and forecast 2025-2030 ($ million)
Chart on South Korea - Year-over-year growth 2025-2030 (%)
Data Table on South Korea - Year-over-year growth 2025-2030 (%)

12.5.5 Indonesia - Market size and forecast 2025-2030

Chart on Indonesia - Market size and forecast 2025-2030 ($ million)
Data Table on Indonesia - Market size and forecast 2025-2030 ($ million)
Chart on Indonesia - Year-over-year growth 2025-2030 (%)
Data Table on Indonesia - Year-over-year growth 2025-2030 (%)

12.5.6 Thailand - Market size and forecast 2025-2030

Chart on Thailand - Market size and forecast 2025-2030 ($ million)
Data Table on Thailand - Market size and forecast 2025-2030 ($ million)
Chart on Thailand - Year-over-year growth 2025-2030 (%)
Data Table on Thailand - Year-over-year growth 2025-2030 (%)

12.5.7 Singapore - Market size and forecast 2025-2030

Chart on Singapore - Market size and forecast 2025-2030 ($ million)
Data Table on Singapore - Market size and forecast 2025-2030 ($ million)
Chart on Singapore - Year-over-year growth 2025-2030 (%)
Data Table on Singapore - Year-over-year growth 2025-2030 (%)

12.6 Rest of World (ROW) - Market size and forecast 2025-2030

Chart on Rest of World (ROW) - Market size and forecast 2025-2030 ($ million)
Data Table on Rest of World (ROW) - Market size and forecast 2025-2030 ($ million)
Chart on Rest of World (ROW) - Year-over-year growth 2025-2030 (%)
Data Table on Rest of World (ROW) - Year-over-year growth 2025-2030 (%)
Chart on Regional Comparison - Rest of World (ROW)
Data Table on Regional Comparison - Rest of World (ROW)

12.6.1 Australia - Market size and forecast 2025-2030

Chart on Australia - Market size and forecast 2025-2030 ($ million)
Data Table on Australia - Market size and forecast 2025-2030 ($ million)
Chart on Australia - Year-over-year growth 2025-2030 (%)
Data Table on Australia - Year-over-year growth 2025-2030 (%)

12.6.2 Brazil - Market size and forecast 2025-2030

Chart on Brazil - Market size and forecast 2025-2030 ($ million)
Data Table on Brazil - Market size and forecast 2025-2030 ($ million)
Chart on Brazil - Year-over-year growth 2025-2030 (%)
Data Table on Brazil - Year-over-year growth 2025-2030 (%)

12.6.3 South Africa - Market size and forecast 2025-2030

Chart on South Africa - Market size and forecast 2025-2030 ($ million)
Data Table on South Africa - Market size and forecast 2025-2030 ($ million)
Chart on South Africa - Year-over-year growth 2025-2030 (%)
Data Table on South Africa - Year-over-year growth 2025-2030 (%)

12.6.4 UAE - Market size and forecast 2025-2030

Chart on UAE - Market size and forecast 2025-2030 ($ million)
Data Table on UAE - Market size and forecast 2025-2030 ($ million)
Chart on UAE - Year-over-year growth 2025-2030 (%)
Data Table on UAE - Year-over-year growth 2025-2030 (%)

12.6.5 Saudi Arabia - Market size and forecast 2025-2030

Chart on Saudi Arabia - Market size and forecast 2025-2030 ($ million)
Data Table on Saudi Arabia - Market size and forecast 2025-2030 ($ million)
Chart on Saudi Arabia - Year-over-year growth 2025-2030 (%)
Data Table on Saudi Arabia - Year-over-year growth 2025-2030 (%)

12.6.6 Turkey - Market size and forecast 2025-2030

Chart on Turkey - Market size and forecast 2025-2030 ($ million)
Data Table on Turkey - Market size and forecast 2025-2030 ($ million)
Chart on Turkey - Year-over-year growth 2025-2030 (%)
Data Table on Turkey - Year-over-year growth 2025-2030 (%)

12.7 Market opportunity by geography

Market opportunity by geography ($ million)
Data Tables on Market opportunity by geography ($ million)

13. Drivers, Challenges, and Opportunity

13.1 Market drivers

Rising prevalence of chronic diseases
Growth of home healthcare services
Public health led shift toward DEHP-free packaging

13.2 Market challenges

Supply chain vulnerabilities and concentration risk
High cost of advanced non-PVC materials
Environmental disposal and regulatory compliance

13.3 Impact of drivers and challenges

Impact of drivers and challenges in 2025 and 2030

13.4 Market opportunities

Adoption of smart IV bags with RFID technology
Shift towards premixed IV solutions
Localization and regionalization of manufacturing capacity

14. Competitive Landscape

14.1 Overview

14.2

Overview on criticality of inputs and factors of differentiation

14.3 Landscape disruption

Overview on factors of disruption

14.4 Industry risks

Impact of key risks on business

15. Competitive Analysis

15.1 Companies profiled

Companies covered

15.2 Company ranking index

15.3 Market positioning of companies

Matrix on companies position and classification

15.4 B.Braun SE

B.Braun SE - Overview
B.Braun SE - Product / Service
B.Braun SE - Key news
B.Braun SE - Key offerings
SWOT

15.5 Baxter International Inc.

Baxter International Inc. - Overview
Baxter International Inc. - Business segments
Baxter International Inc. - Key news
Baxter International Inc. - Key offerings
Baxter International Inc. - Segment focus
SWOT

15.6 Becton Dickinson and Co.

Becton Dickinson and Co. - Overview
Becton Dickinson and Co. - Business segments
Becton Dickinson and Co. - Key news
Becton Dickinson and Co. - Key offerings
Becton Dickinson and Co. - Segment focus
SWOT

15.7 Fosmo Med

Fosmo Med - Overview
Fosmo Med - Product / Service
Fosmo Med - Key offerings
SWOT

15.8 Fresenius SE and Co. KGaA

Fresenius SE and Co. KGaA - Overview
Fresenius SE and Co. KGaA - Business segments
Fresenius SE and Co. KGaA - Key news
Fresenius SE and Co. KGaA - Key offerings
Fresenius SE and Co. KGaA - Segment focus
SWOT

15.9 ICU Medical Inc.

ICU Medical Inc. - Overview
ICU Medical Inc. - Product / Service
ICU Medical Inc. - Key offerings
SWOT

15.10 Medicopack

Medicopack - Overview
Medicopack - Product / Service
Medicopack - Key offerings
SWOT

15.11 Medline Inc.

Medline Inc. - Overview
Medline Inc. - Product / Service
Medline Inc. - Key offerings
SWOT

15.12 Otsuka Holdings Co. Ltd.

Otsuka Holdings Co. Ltd. - Overview
Otsuka Holdings Co. Ltd. - Business segments
Otsuka Holdings Co. Ltd. - Key news
Otsuka Holdings Co. Ltd. - Key offerings
Otsuka Holdings Co. Ltd. - Segment focus
SWOT

15.13 POLYCINE GmbH

POLYCINE GmbH - Overview
POLYCINE GmbH - Product / Service
POLYCINE GmbH - Key offerings
SWOT

15.14 Puerto Life Sciences Pvt. Ltd.

Puerto Life Sciences Pvt. Ltd. - Overview
Puerto Life Sciences Pvt. Ltd. - Product / Service
Puerto Life Sciences Pvt. Ltd. - Key offerings
SWOT

15.15 RENOLIT SE

RENOLIT SE - Overview
RENOLIT SE - Product / Service
RENOLIT SE - Key offerings
SWOT

15.16 Sanisure

Sanisure - Overview
Sanisure - Product / Service
Sanisure - Key offerings
SWOT

15.17 Sartorius AG

Sartorius AG - Overview
Sartorius AG - Business segments
Sartorius AG - Key news
Sartorius AG - Key offerings
Sartorius AG - Segment focus
SWOT

15.18 Sippex

Sippex - Overview
Sippex - Product / Service
Sippex - Key offerings
SWOT

16. Appendix

16.1 Scope of the report

Market definition
Objectives
Notes and caveats

16.2 Inclusions and exclusions checklist

Inclusions checklist
Exclusions checklist

16.3 Currency conversion rates for US$

16.4 Research methodology

16.5 Data procurement

Information sources

16.6 Data validation

16.7 Validation techniques employed for market sizing

16.8 Data synthesis

16.9 360 degree market analysis

16.10 List of abbreviations

Research Methodology

Technavio presents a detailed picture of the market by way of study, synthesis, and summation of data from multiple sources. The analysts have presented the various facets of the market with a particular focus on identifying the key industry influencers. The data thus presented is comprehensive, reliable, and the result of extensive research, both primary and secondary.

INFORMATION SOURCES

Primary sources

  • Manufacturers and suppliers
  • Channel partners
  • Industry experts
  • Strategic decision makers

Secondary sources

  • Industry journals and periodicals
  • Government data
  • Financial reports of key industry players
  • Historical data
  • Press releases

DATA ANALYSIS

Data Synthesis

  • Collation of data
  • Estimation of key figures
  • Analysis of derived insights

Data Validation

  • Triangulation with data models
  • Reference against proprietary databases
  • Corroboration with industry experts

REPORT WRITING

Qualitative

  • Market drivers
  • Market challenges
  • Market trends
  • Five forces analysis

Quantitative

  • Market size and forecast
  • Market segmentation
  • Geographical insights
  • Competitive landscape

Interested in this report?

Get your sample now to see our research methodology and insights!

Download Now

Frequently Asked Questions

Intravenous (IV) Fluid Bags market growth will increase by USD 1014.8 million during 2026-2030.

The Intravenous (IV) Fluid Bags market is expected to grow at a CAGR of 6.4% during 2026-2030.

Intravenous (IV) Fluid Bags market is segmented by Product (PVC material, Non-PVC material) End-user (Hospitals, Home healthcare, Others) Product type (Single-chamber IV bags, Multi-chamber IV bags)

Adagia Partners, B.Braun SE, Baxter International Inc., Becton Dickinson and Co., Fosmo Med, Fresenius SE and Co. KGaA, ICU Medical Inc., Medicopack, Medline Inc., Mitra Industries Pvt. Ltd., Otsuka Holdings Co. Ltd., POLYCINE GmbH, Puerto Life Sciences Pvt. Ltd., RENOLIT SE, Rusoma Laboratories Pvt. Ltd., Sanisure, Sartorius AG, Sippex, The Metrix Co., Vioser SA are a few of the key vendors in the Intravenous (IV) Fluid Bags market.

Asia will register the highest growth rate of 30.9% among the other regions. Therefore, the Intravenous (IV) Fluid Bags market in Asia is expected to garner significant business opportunities for the vendors during the forecast period.

US, Canada, Mexico, Germany, France, UK, Italy, Spain, The Netherlands, Russia, China, Japan, India, South Korea, Indonesia, Thailand, Singapore, Australia, Brazil, South Africa, UAE, Saudi Arabia, Turkey

  • Rising prevalence of chronic diseases is the driving factor this market.

The Intravenous (IV) Fluid Bags market vendors should focus on grabbing business opportunities from the Product segment as it accounted for the largest market share in the base year.
RIA - Research AI Assistant
Ask RIA