Inventory Management Market Analysis, Size, and Forecast 2026-2030: North America (US, Canada, and Mexico), Europe (Germany, UK, and France), APAC (China, Japan, and India), Middle East and Africa (Saudi Arabia, UAE, and South Africa), South America (Brazil, Argentina, and Colombia), and Rest of World (ROW)

Inventory Management Market Analysis, Size, and Forecast 2026-2030:
North America (US, Canada, and Mexico), Europe (Germany, UK, and France), APAC (China, Japan, and India), Middle East and Africa (Saudi Arabia, UAE, and South Africa), South America (Brazil, Argentina, and Colombia), and Rest of World (ROW)

Published: Apr 2026 307 Pages SKU: IRTNTR81416

Market Overview at a Glance

$1.38 B
Market Opportunity
8.1%
CAGR 2025 - 2030
38.6%
North America Growth
$1.84 B
Software segment 2024

Inventory Management Market Size 2026-2030

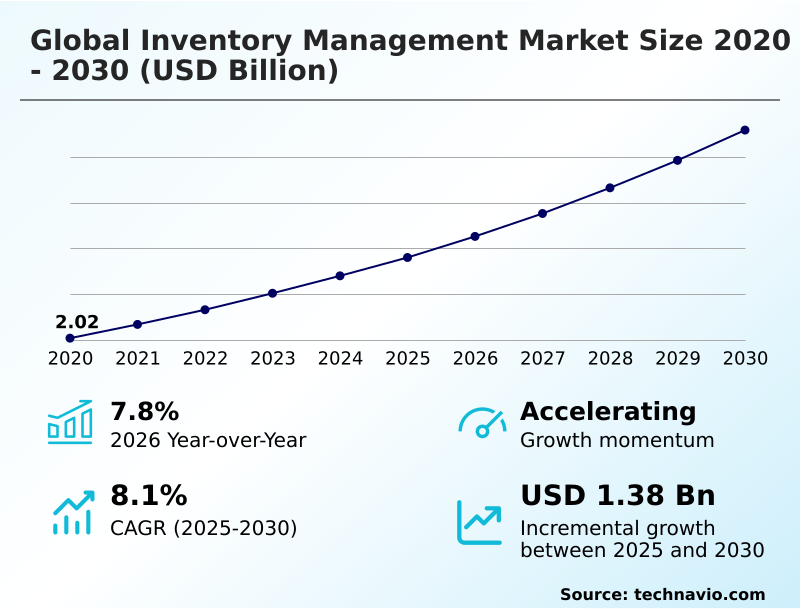
The inventory management market size is valued to increase by USD 1.38 billion, at a CAGR of 8.1% from 2025 to 2030. Expansion of omnichannel retailing strategies will drive the inventory management market.

Major Market Trends & Insights

  • North America dominated the market and accounted for a 38.6% growth during the forecast period.
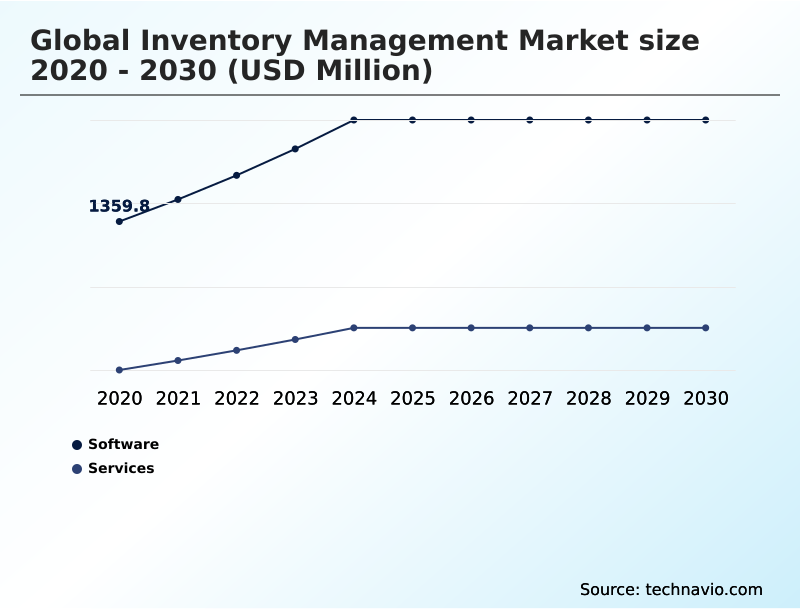
  • By Component - Software segment was valued at USD 1.84 billion in 2024
  • By Deployment - Cloud based segment accounted for the largest market revenue share in 2024

Market Size & Forecast

  • Market Opportunities: USD 2.27 billion
  • Market Future Opportunities: USD 1.38 billion
  • CAGR from 2025 to 2030 : 8.1%

Market Summary

  • The inventory management market is driven by the need for operational efficiency and supply chain resilience. The transition to automated systems is a strategic necessity for businesses aiming to achieve real-time visibility across complex distribution networks.
  • This shift is motivated by the rise of omnichannel commerce, which demands synchronized stock levels between digital storefronts and physical locations to prevent stockouts and optimize fulfillment. For instance, a global retailer utilizes a unified platform to maintain stock accuracy across its e-commerce site and brick-and-mortar stores, enabling efficient ship-from-store strategies and enhancing customer satisfaction.
  • Key trends include the integration of AI-driven demand forecasting for more accurate replenishment and the use of blockchain for enhanced traceability. However, challenges such as high implementation costs for inventory management software and the complexities of integrating with legacy systems persist.
  • The adoption of cloud based deployment models is helping to mitigate these barriers by offering scalable and more accessible solutions for enterprises of all sizes.

What will be the Size of the Inventory Management Market during the forecast period?

Get Key Insights on Market Forecast (PDF) Request Free Sample

How is the Inventory Management Market Segmented?

The inventory management industry research report provides comprehensive data (region-wise segment analysis), with forecasts and estimates in "USD million" for the period 2026-2030, as well as historical data from 2020-2024 for the following segments.

  • Component
    • Software
    • Services
  • Deployment
    • Cloud based
    • On premises
    • Hybrid
  • Application
    • Inventory control and tracking
    • Order management
    • Asset management
    • Scanning and barcoding
    • Others
  • Geography
    • North America
      • US
      • Canada
      • Mexico
    • Europe
      • Germany
      • UK
      • France
    • APAC
      • China
      • Japan
      • India
    • Middle East and Africa
      • Saudi Arabia
      • UAE
      • South Africa
    • South America
      • Brazil
      • Argentina
      • Colombia
    • Rest of World (ROW)

By Component Insights

The software segment is estimated to witness significant growth during the forecast period.

The global inventory management market is segmented by component, deployment, application, and geography. The software segment has evolved from basic databases into sophisticated platforms offering real-time inventory visibility.

Modern inventory management software integrates AI-driven demand forecasting and predictive analytics models to improve operational efficiency. Cloud based deployment is prevalent, providing scalability for enterprises to manage inventory control and tracking.

These systems, utilizing radio frequency identification (RFID) and barcode scanning technology, facilitate data-driven decision making and support complex circular logistics management.

The integration of such advanced software has been shown to reduce manual data entry errors by over 95%, which is critical for maintaining accurate perpetual inventory systems and ensuring warehouse space utilization.

Request Free Sample

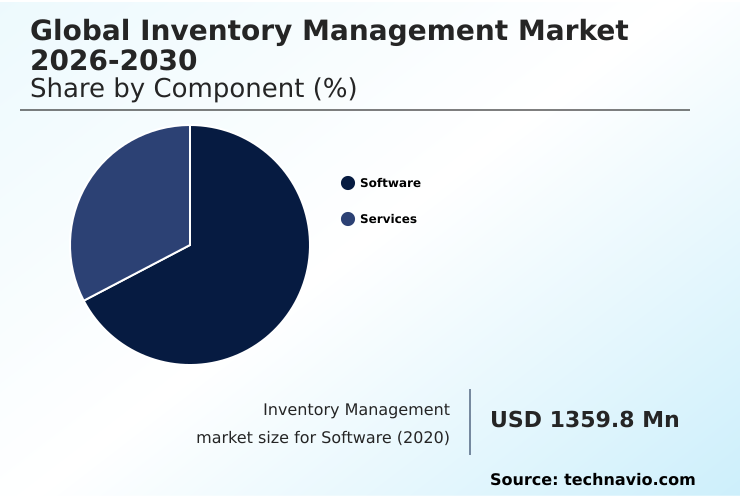
The Software segment was valued at USD 1.84 billion in 2024 and showed a gradual increase during the forecast period.

Request Free Sample

Regional Analysis

North America is estimated to contribute 38.6% to the growth of the global market during the forecast period.Technavio’s analysts have elaborately explained the regional trends and drivers that shape the market during the forecast period.

See How Inventory Management Market Demand is Rising in North America Request Free Sample

The geographic landscape of the global inventory management market is diverse, with North America representing the largest share of incremental growth at nearly 39%.

This maturity is driven by early adoption of advanced technologies for omnichannel fulfillment strategies and robotic process automation (RPA).

In contrast, the APAC region is the fastest-growing market, fueled by the expansion of e-commerce and manufacturing, which demands robust order management systems (OMS) and efficient last-mile delivery optimization.

Europe focuses on regulatory compliance burdens, with a strong emphasis on sustainability and the digital product passport, leading to increased investment in blockchain-based tracking and carbon footprint reporting.

European firms leveraging circular logistics report an average 10% reduction in material waste. Across all regions, the push for operational cost reduction and warehouse management systems (WMS) remains a universal driver.

Market Dynamics

Our researchers analyzed the data with 2025 as the base year, along with the key drivers, trends, and challenges. A holistic analysis of drivers will help companies refine their marketing strategies to gain a competitive advantage.

  • As businesses evaluate the global inventory management market 2026-2030, a primary consideration is the on-premise vs cloud inventory software debate, with many SMBs favoring cloud inventory management for SMBs due to lower upfront costs and scalability.
  • The decision to integrate AI into inventory management is no longer a question of if, but how, with best practices for omnichannel fulfillment now relying on machine learning for demand forecasting. To improve supply chain resilience, organizations are implementing a perpetual inventory system, which, when combined with the precise data from RFID, significantly boosts inventory accuracy.
  • This is especially true for inventory control for perishable goods, where real-time tracking is essential. The challenges of legacy system integration are being addressed through modern APIs, allowing for smoother adoption of advanced warehouse management systems. Firms are increasingly using blockchain for supply chain transparency and leveraging predictive analytics to reduce stockouts.
  • Automating replenishment with inventory software that is capable of calculating safety stock for volatile demand is now standard. Enterprises that implement these systems often see a twofold increase in order accuracy compared to legacy batch processing, demonstrating a clear return on investment.

What are the key market drivers leading to the rise in the adoption of Inventory Management Industry?

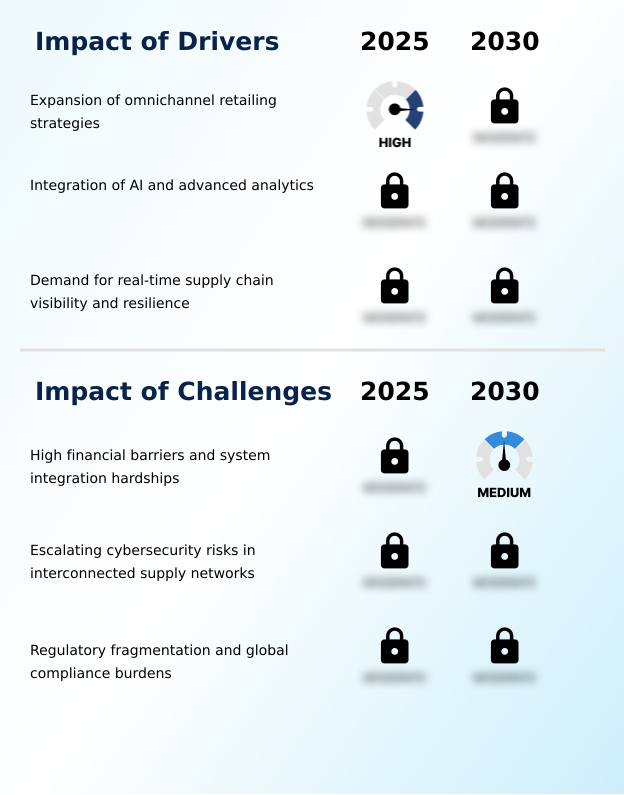
  • The expansion of omnichannel retailing strategies is a key driver for the inventory management market.

  • Key drivers are reshaping the global inventory management market, compelling organizations to adopt more advanced systems.
  • The expansion of omnichannel retailing necessitates real-time data synchronization and end-to-end supply chain visibility, with effective integration leading to a 5% lift in customer retention.
  • The adoption of AI and advanced analytics facilitates a shift to proactive operational models, where AI-driven demand forecasting improves accuracy by over 20%. This allows for better stockout prevention and inventory turnover optimization.
  • Furthermore, frequent global disruptions have prioritized supply chain resilience, leading to the adoption of just-in-case inventory strategies.
  • The implementation of an inventory control tower providing real-time visibility has been shown to cut disruption recovery times by half, supported by technologies like lot tracking and traceability and economic order quantity (EOQ) models.

What are the market trends shaping the Inventory Management Industry?

  • The proliferation of generative AI and autonomous agents is emerging as a significant market trend. This is transforming inventory management from predictive analytics to more sophisticated, agentic workflows.

  • The global inventory management market is increasingly shaped by the integration of sophisticated technologies. The rise of generative AI integration and autonomous agent workflows is shifting operations from predictive to proactive, with automated decision-making reducing procurement planning times by up to 40%.
  • This trend is complemented by the expansion of micro-fulfillment center operations and edge computing integration, which together can improve last-mile delivery speeds by an average of 50% in dense urban areas. Sustainability is another key driver, with a focus on environmental impact tracking and circular logistics.
  • This requires advanced asset management solutions and supports reverse logistics processes, turning returned goods into valuable stock. These trends are enabled by foundational technologies like multi-echelon inventory optimization and vendor-managed inventory (VMI) strategies.

What challenges does the Inventory Management Industry face during its growth?

  • High financial barriers and system integration hardships represent a key challenge affecting the industry's growth.

  • Significant challenges constrain growth in the global inventory management market, primarily related to cost and complexity. High financial barriers and the difficulty of legacy system integration remain critical issues, with integration efforts often accounting for over 60% of the total implementation cost for a new system.
  • This complexity is compounded by escalating supply chain cybersecurity risks, as interconnected networks create more vulnerabilities. A single breach can halt supply chain operations, leading to significant financial loss. Moreover, regulatory fragmentation and global compliance burdens add another layer of difficulty.
  • The administrative overhead to comply with diverse international mandates, such as those for data residency and carbon footprint reporting, can increase operational costs by up to 20%, demanding highly adaptable inventory valuation methods and robust digital twin simulation capabilities.

Exclusive Technavio Analysis on Customer Landscape

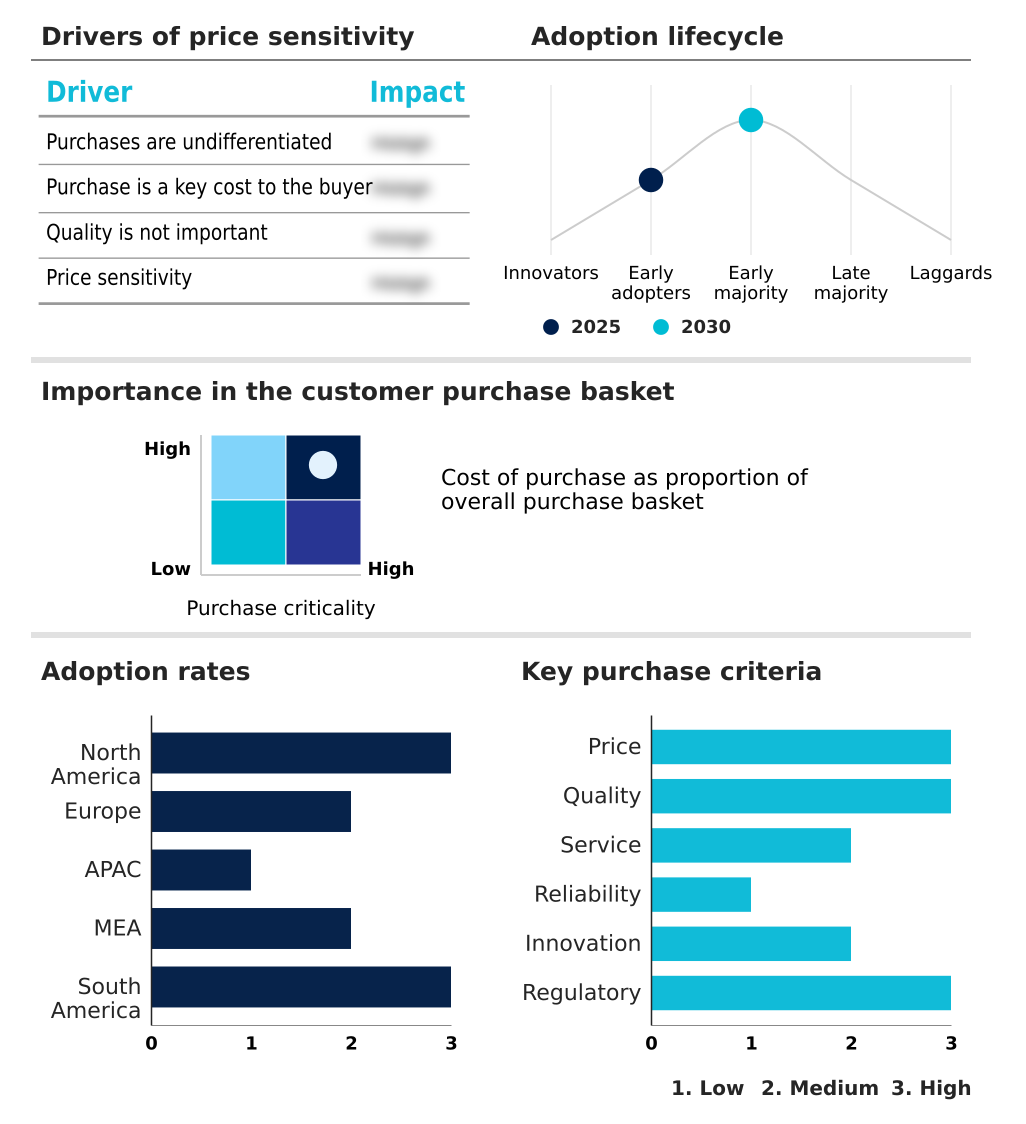
The inventory management market forecasting report includes the adoption lifecycle of the market, covering from the innovator’s stage to the laggard’s stage. It focuses on adoption rates in different regions based on penetration. Furthermore, the inventory management market report also includes key purchase criteria and drivers of price sensitivity to help companies evaluate and develop their market growth analysis strategies.

Customer Landscape of Inventory Management Industry

Competitive Landscape

Companies are implementing various strategies, such as strategic alliances, inventory management market forecast, partnerships, mergers and acquisitions, geographical expansion, and product/service launches, to enhance their presence in the industry.

Acumatica Inc. - Solutions provide control over multi-location inventories, automating replenishment and enabling real-time visibility for streamlined stock tracking.

The industry research and growth report includes detailed analyses of the competitive landscape of the market and information about key companies, including:

  • Acumatica Inc.
  • Aptean
  • Blue Yonder Group Inc.
  • Descartes Systems Group Inc.
  • E2open Parent Holdings Inc.
  • Epicor Software Corp.
  • IBM Corp.
  • Infor Inc.
  • Koerber AG
  • Logility SCS Inc.
  • Manhattan Associates Inc.
  • Microsoft Corp.
  • Odoo SA
  • Oracle Corp.
  • Sage Group Plc
  • SAP SE
  • ShipHero LLC Inc.
  • SYSPRO Pty. Ltd.
  • Zebra Technologies Corp.
  • Zoho Corp. Pvt. Ltd.

Qualitative and quantitative analysis of companies has been conducted to help clients understand the wider business environment as well as the strengths and weaknesses of key industry players. Data is qualitatively analyzed to categorize companies as pure play, category-focused, industry-focused, and diversified; it is quantitatively analyzed to categorize companies as dominant, leading, strong, tentative, and weak.

Recent Development and News in Inventory management market

  • In June, 2025, SAP SE integrated advanced generative AI capabilities into its S/4HANA Cloud Public Edition, enabling users to interact with inventory databases using natural language and receive automated stock health summaries.
  • In July, 2025, Oracle Corp. introduced a major update to its NetSuite platform featuring a generative AI assistant designed to help procurement managers identify potential stockouts by analyzing historical supplier data.
  • In September, 2025, Maersk launched the Inventory Control Tower, a digital visibility tool allowing customers to monitor stock movements across international shipping lanes and inland distribution centers from a single interface.
  • In May, 2025, Walmart enhanced its proprietary Global Inventory Platform by integrating advanced computer vision and machine learning to reconcile physical shelf stock with online availability in real-time for improved fulfillment promises.

Dive into Technavio’s robust research methodology, blending expert interviews, extensive data synthesis, and validated models for unparalleled Inventory Management Market insights. See full methodology.

Market Scope
Page number 307
Base year 2025
Historic period 2020-2024
Forecast period 2026-2030
Growth momentum & CAGR Accelerate at a CAGR of 8.1%
Market growth 2026-2030 USD 1381.7 million
Market structure Fragmented
YoY growth 2025-2026(%) 7.8%
Key countries US, Canada, Mexico, Germany, UK, France, Italy, Spain, The Netherlands, China, Japan, India, South Korea, Australia, Indonesia, Saudi Arabia, UAE, South Africa, Israel, Turkey, Brazil, Argentina and Colombia
Competitive landscape Leading Companies, Market Positioning of Companies, Competitive Strategies, and Industry Risks

Request Free Sample

Research Analyst Overview

  • The inventory management market is undergoing a fundamental transformation, moving from a reactive, record-keeping function to a proactive, strategic enabler of business agility. Boardroom decisions are now heavily influenced by the need for advanced inventory management software, as executives must allocate capital for solutions that support supply chain resilience and ESG compliance.
  • The integration of generative AI is not just a trend but a core competency, enabling automated replenishment systems that optimize inventory turnover. Enterprises adopting AI-powered demand forecasting have demonstrated an ability to reduce carrying costs by over 15% by minimizing the need for excessive safety stock calculation and preventing stockouts.
  • This shift is supported by technologies such as radio frequency identification (RFID) and blockchain-based tracking, which provide the granular data needed for perpetual inventory systems.
  • As organizations navigate the complexities of omnichannel fulfillment strategies and circular logistics management, the choice between cloud based deployment, on premises deployment, or a hybrid deployment model becomes a critical strategic decision impacting everything from legacy system integration to supply chain cybersecurity.

What are the Key Data Covered in this Inventory Management Market Research and Growth Report?

  • What is the expected growth of the Inventory Management Market between 2026 and 2030?

    • USD 1.38 billion, at a CAGR of 8.1%

  • What segmentation does the market report cover?

    • The report is segmented by Component (Software, and Services), Deployment (Cloud based, On premises, and Hybrid), Application (Inventory control and tracking, Order management, Asset management, Scanning and barcoding, and Others) and Geography (North America, Europe, APAC, Middle East and Africa, South America)

  • Which regions are analyzed in the report?

    • North America, Europe, APAC, Middle East and Africa and South America

  • What are the key growth drivers and market challenges?

    • Expansion of omnichannel retailing strategies, High financial barriers and system integration hardships

  • Who are the major players in the Inventory Management Market?

    • Acumatica Inc., Aptean, Blue Yonder Group Inc., Descartes Systems Group Inc., E2open Parent Holdings Inc., Epicor Software Corp., IBM Corp., Infor Inc., Koerber AG, Logility SCS Inc., Manhattan Associates Inc., Microsoft Corp., Odoo SA, Oracle Corp., Sage Group Plc, SAP SE, ShipHero LLC Inc., SYSPRO Pty. Ltd., Zebra Technologies Corp. and Zoho Corp. Pvt. Ltd.

Market Research Insights

  • Market dynamics are shaped by a strategic shift toward proactive operational models. The adoption of an end-to-end supply chain visibility approach allows organizations to anticipate disruptions, with some firms reducing recovery times by up to 30%. Concurrently, intelligent order routing systems are enhancing omnichannel fulfillment, improving order accuracy by over 15% through automated stock rebalancing.
  • These advancements facilitate data-driven decision making for better warehouse slotting optimization and available-to-promise (ATP) calculation. The implementation of just-in-case inventory strategies, supported by real-time data synchronization and SKU-level tracking, provides a buffer against volatility.
  • Furthermore, the focus on sustainable supply chain practices is compelling businesses to adopt tools for environmental impact tracking, aligning operational efficiency with corporate responsibility goals and improving overall asset utilization.

We can help! Our analysts can customize this inventory management market research report to meet your requirements.

Get in touch

1. Executive Summary

1.1 Market overview

Executive Summary - Chart on Market Overview
Executive Summary - Data Table on Market Overview
Executive Summary - Chart on Global Market Characteristics
Executive Summary - Chart on Market by Geography
Executive Summary - Chart on Market Segmentation by Component
Executive Summary - Chart on Market Segmentation by Deployment
Executive Summary - Chart on Market Segmentation by Application
Executive Summary - Chart on Incremental Growth
Executive Summary - Data Table on Incremental Growth
Executive Summary - Chart on Company Market Positioning

2. Technavio Analysis

2.1 Analysis of price sensitivity, lifecycle, customer purchase basket, adoption rates, and purchase criteria

2.2 Criticality of inputs and Factors of differentiation

Chart on Overview on criticality of inputs and factors of differentiation

2.3 Factors of disruption

Chart on Overview on factors of disruption

2.4 Impact of drivers and challenges

Chart on Impact of drivers and challenges in 2025 and 2030

3. Market Landscape

3.1 Market ecosystem

Chart on Parent Market
Data Table on - Parent Market

3.2 Market characteristics

Chart on Market characteristics analysis

3.3 Value chain analysis

Chart on Value chain analysis

4. Market Sizing

4.1 Market definition

Data Table on Offerings of companies included in the market definition

4.2 Market segment analysis

Market segments

4.3 Market size 2025

4.4 Market outlook: Forecast for 2025-2030

Chart on Global - Market size and forecast 2025-2030 ($ million)
Data Table on Global - Market size and forecast 2025-2030 ($ million)
Chart on Global Market: Year-over-year growth 2025-2030 (%)
Data Table on Global Market: Year-over-year growth 2025-2030 (%)

5. Historic Market Size

5.1 Global Inventory Management Market 2020 - 2024

Historic Market Size - Data Table on Global Inventory Management Market 2020 - 2024 ($ million)

5.2 Component segment analysis 2020 - 2024

Historic Market Size - Component Segment 2020 - 2024 ($ million)

5.3 Deployment segment analysis 2020 - 2024

Historic Market Size - Deployment Segment 2020 - 2024 ($ million)

5.4 Application segment analysis 2020 - 2024

Historic Market Size - Application Segment 2020 - 2024 ($ million)

5.5 Geography segment analysis 2020 - 2024

Historic Market Size - Geography Segment 2020 - 2024 ($ million)

5.6 Country segment analysis 2020 - 2024

Historic Market Size - Country Segment 2020 - 2024 ($ million)

6. Qualitative Analysis

6.1 Impact of AI on Global Inventory Management Market

6.2 Impact of geopolitical conflicts on Global Inventory Management Market

7. Five Forces Analysis

7.1 Five forces summary

Five forces analysis - Comparison between 2025 and 2030

7.2 Bargaining power of buyers

Bargaining power of buyers - Impact of key factors 2025 and 2030

7.3 Bargaining power of suppliers

Bargaining power of suppliers - Impact of key factors in 2025 and 2030

7.4 Threat of new entrants

Threat of new entrants - Impact of key factors in 2025 and 2030

7.5 Threat of substitutes

Threat of substitutes - Impact of key factors in 2025 and 2030

7.6 Threat of rivalry

Threat of rivalry - Impact of key factors in 2025 and 2030

7.7 Market condition

Chart on Market condition - Five forces 2025 and 2030

8. Market Segmentation by Component

8.1 Market segments

Chart on Component - Market share 2025-2030 (%)
Data Table on Component - Market share 2025-2030 (%)

8.2 Comparison by Component

Chart on Comparison by Component
Data Table on Comparison by Component

8.3 Software - Market size and forecast 2025-2030

Chart on Software - Market size and forecast 2025-2030 ($ million)
Data Table on Software - Market size and forecast 2025-2030 ($ million)
Chart on Software - Year-over-year growth 2025-2030 (%)
Data Table on Software - Year-over-year growth 2025-2030 (%)

8.4 Services - Market size and forecast 2025-2030

Chart on Services - Market size and forecast 2025-2030 ($ million)
Data Table on Services - Market size and forecast 2025-2030 ($ million)
Chart on Services - Year-over-year growth 2025-2030 (%)
Data Table on Services - Year-over-year growth 2025-2030 (%)

8.5 Market opportunity by Component

Market opportunity by Component ($ million)
Data Table on Market opportunity by Component ($ million)

9. Market Segmentation by Deployment

9.1 Market segments

Chart on Deployment - Market share 2025-2030 (%)
Data Table on Deployment - Market share 2025-2030 (%)

9.2 Comparison by Deployment

Chart on Comparison by Deployment
Data Table on Comparison by Deployment

9.3 Cloud based - Market size and forecast 2025-2030

Chart on Cloud based - Market size and forecast 2025-2030 ($ million)
Data Table on Cloud based - Market size and forecast 2025-2030 ($ million)
Chart on Cloud based - Year-over-year growth 2025-2030 (%)
Data Table on Cloud based - Year-over-year growth 2025-2030 (%)

9.4 On premises - Market size and forecast 2025-2030

Chart on On premises - Market size and forecast 2025-2030 ($ million)
Data Table on On premises - Market size and forecast 2025-2030 ($ million)
Chart on On premises - Year-over-year growth 2025-2030 (%)
Data Table on On premises - Year-over-year growth 2025-2030 (%)

9.5 Hybrid - Market size and forecast 2025-2030

Chart on Hybrid - Market size and forecast 2025-2030 ($ million)
Data Table on Hybrid - Market size and forecast 2025-2030 ($ million)
Chart on Hybrid - Year-over-year growth 2025-2030 (%)
Data Table on Hybrid - Year-over-year growth 2025-2030 (%)

9.6 Market opportunity by Deployment

Market opportunity by Deployment ($ million)
Data Table on Market opportunity by Deployment ($ million)

10. Market Segmentation by Application

10.1 Market segments

Chart on Application - Market share 2025-2030 (%)
Data Table on Application - Market share 2025-2030 (%)

10.2 Comparison by Application

Chart on Comparison by Application
Data Table on Comparison by Application

10.3 Inventory control and tracking - Market size and forecast 2025-2030

Chart on Inventory control and tracking - Market size and forecast 2025-2030 ($ million)
Data Table on Inventory control and tracking - Market size and forecast 2025-2030 ($ million)
Chart on Inventory control and tracking - Year-over-year growth 2025-2030 (%)
Data Table on Inventory control and tracking - Year-over-year growth 2025-2030 (%)

10.4 Order management - Market size and forecast 2025-2030

Chart on Order management - Market size and forecast 2025-2030 ($ million)
Data Table on Order management - Market size and forecast 2025-2030 ($ million)
Chart on Order management - Year-over-year growth 2025-2030 (%)
Data Table on Order management - Year-over-year growth 2025-2030 (%)

10.5 Asset management - Market size and forecast 2025-2030

Chart on Asset management - Market size and forecast 2025-2030 ($ million)
Data Table on Asset management - Market size and forecast 2025-2030 ($ million)
Chart on Asset management - Year-over-year growth 2025-2030 (%)
Data Table on Asset management - Year-over-year growth 2025-2030 (%)

10.6 Scanning and barcoding - Market size and forecast 2025-2030

Chart on Scanning and barcoding - Market size and forecast 2025-2030 ($ million)
Data Table on Scanning and barcoding - Market size and forecast 2025-2030 ($ million)
Chart on Scanning and barcoding - Year-over-year growth 2025-2030 (%)
Data Table on Scanning and barcoding - Year-over-year growth 2025-2030 (%)

10.7 Others - Market size and forecast 2025-2030

Chart on Others - Market size and forecast 2025-2030 ($ million)
Data Table on Others - Market size and forecast 2025-2030 ($ million)
Chart on Others - Year-over-year growth 2025-2030 (%)
Data Table on Others - Year-over-year growth 2025-2030 (%)

10.8 Market opportunity by Application

Market opportunity by Application ($ million)
Data Table on Market opportunity by Application ($ million)

11. Customer Landscape

11.1 Customer landscape overview

Analysis of price sensitivity, lifecycle, customer purchase basket, adoption rates, and purchase criteria

12. Geographic Landscape

12.1 Geographic segmentation

Chart on Market share by geography 2025-2030 (%)
Data Table on Market share by geography 2025-2030 (%)

12.2 Geographic comparison

Chart on Geographic comparison
Data Table on Geographic comparison

12.3 North America - Market size and forecast 2025-2030

Chart on North America - Market size and forecast 2025-2030 ($ million)
Data Table on North America - Market size and forecast 2025-2030 ($ million)
Chart on North America - Year-over-year growth 2025-2030 (%)
Data Table on North America - Year-over-year growth 2025-2030 (%)
Chart on Regional Comparison - North America
Data Table on Regional Comparison - North America

12.3.1 US - Market size and forecast 2025-2030

Chart on US - Market size and forecast 2025-2030 ($ million)
Data Table on US - Market size and forecast 2025-2030 ($ million)
Chart on US - Year-over-year growth 2025-2030 (%)
Data Table on US - Year-over-year growth 2025-2030 (%)

12.3.2 Canada - Market size and forecast 2025-2030

Chart on Canada - Market size and forecast 2025-2030 ($ million)
Data Table on Canada - Market size and forecast 2025-2030 ($ million)
Chart on Canada - Year-over-year growth 2025-2030 (%)
Data Table on Canada - Year-over-year growth 2025-2030 (%)

12.3.3 Mexico - Market size and forecast 2025-2030

Chart on Mexico - Market size and forecast 2025-2030 ($ million)
Data Table on Mexico - Market size and forecast 2025-2030 ($ million)
Chart on Mexico - Year-over-year growth 2025-2030 (%)
Data Table on Mexico - Year-over-year growth 2025-2030 (%)

12.4 Europe - Market size and forecast 2025-2030

Chart on Europe - Market size and forecast 2025-2030 ($ million)
Data Table on Europe - Market size and forecast 2025-2030 ($ million)
Chart on Europe - Year-over-year growth 2025-2030 (%)
Data Table on Europe - Year-over-year growth 2025-2030 (%)
Chart on Regional Comparison - Europe
Data Table on Regional Comparison - Europe

12.4.1 Germany - Market size and forecast 2025-2030

Chart on Germany - Market size and forecast 2025-2030 ($ million)
Data Table on Germany - Market size and forecast 2025-2030 ($ million)
Chart on Germany - Year-over-year growth 2025-2030 (%)
Data Table on Germany - Year-over-year growth 2025-2030 (%)

12.4.2 UK - Market size and forecast 2025-2030

Chart on UK - Market size and forecast 2025-2030 ($ million)
Data Table on UK - Market size and forecast 2025-2030 ($ million)
Chart on UK - Year-over-year growth 2025-2030 (%)
Data Table on UK - Year-over-year growth 2025-2030 (%)

12.4.3 France - Market size and forecast 2025-2030

Chart on France - Market size and forecast 2025-2030 ($ million)
Data Table on France - Market size and forecast 2025-2030 ($ million)
Chart on France - Year-over-year growth 2025-2030 (%)
Data Table on France - Year-over-year growth 2025-2030 (%)

12.4.4 Italy - Market size and forecast 2025-2030

Chart on Italy - Market size and forecast 2025-2030 ($ million)
Data Table on Italy - Market size and forecast 2025-2030 ($ million)
Chart on Italy - Year-over-year growth 2025-2030 (%)
Data Table on Italy - Year-over-year growth 2025-2030 (%)

12.4.5 Spain - Market size and forecast 2025-2030

Chart on Spain - Market size and forecast 2025-2030 ($ million)
Data Table on Spain - Market size and forecast 2025-2030 ($ million)
Chart on Spain - Year-over-year growth 2025-2030 (%)
Data Table on Spain - Year-over-year growth 2025-2030 (%)

12.4.6 The Netherlands - Market size and forecast 2025-2030

Chart on The Netherlands - Market size and forecast 2025-2030 ($ million)
Data Table on The Netherlands - Market size and forecast 2025-2030 ($ million)
Chart on The Netherlands - Year-over-year growth 2025-2030 (%)
Data Table on The Netherlands - Year-over-year growth 2025-2030 (%)

12.5 APAC - Market size and forecast 2025-2030

Chart on APAC - Market size and forecast 2025-2030 ($ million)
Data Table on APAC - Market size and forecast 2025-2030 ($ million)
Chart on APAC - Year-over-year growth 2025-2030 (%)
Data Table on APAC - Year-over-year growth 2025-2030 (%)
Chart on Regional Comparison - APAC
Data Table on Regional Comparison - APAC

12.5.1 China - Market size and forecast 2025-2030

Chart on China - Market size and forecast 2025-2030 ($ million)
Data Table on China - Market size and forecast 2025-2030 ($ million)
Chart on China - Year-over-year growth 2025-2030 (%)
Data Table on China - Year-over-year growth 2025-2030 (%)

12.5.2 Japan - Market size and forecast 2025-2030

Chart on Japan - Market size and forecast 2025-2030 ($ million)
Data Table on Japan - Market size and forecast 2025-2030 ($ million)
Chart on Japan - Year-over-year growth 2025-2030 (%)
Data Table on Japan - Year-over-year growth 2025-2030 (%)

12.5.3 India - Market size and forecast 2025-2030

Chart on India - Market size and forecast 2025-2030 ($ million)
Data Table on India - Market size and forecast 2025-2030 ($ million)
Chart on India - Year-over-year growth 2025-2030 (%)
Data Table on India - Year-over-year growth 2025-2030 (%)

12.5.4 South Korea - Market size and forecast 2025-2030

Chart on South Korea - Market size and forecast 2025-2030 ($ million)
Data Table on South Korea - Market size and forecast 2025-2030 ($ million)
Chart on South Korea - Year-over-year growth 2025-2030 (%)
Data Table on South Korea - Year-over-year growth 2025-2030 (%)

12.5.5 Australia - Market size and forecast 2025-2030

Chart on Australia - Market size and forecast 2025-2030 ($ million)
Data Table on Australia - Market size and forecast 2025-2030 ($ million)
Chart on Australia - Year-over-year growth 2025-2030 (%)
Data Table on Australia - Year-over-year growth 2025-2030 (%)

12.5.6 Indonesia - Market size and forecast 2025-2030

Chart on Indonesia - Market size and forecast 2025-2030 ($ million)
Data Table on Indonesia - Market size and forecast 2025-2030 ($ million)
Chart on Indonesia - Year-over-year growth 2025-2030 (%)
Data Table on Indonesia - Year-over-year growth 2025-2030 (%)

12.6 Middle East and Africa - Market size and forecast 2025-2030

Chart on Middle East and Africa - Market size and forecast 2025-2030 ($ million)
Data Table on Middle East and Africa - Market size and forecast 2025-2030 ($ million)
Chart on Middle East and Africa - Year-over-year growth 2025-2030 (%)
Data Table on Middle East and Africa - Year-over-year growth 2025-2030 (%)
Chart on Regional Comparison - Middle East and Africa
Data Table on Regional Comparison - Middle East and Africa

12.6.1 Saudi Arabia - Market size and forecast 2025-2030

Chart on Saudi Arabia - Market size and forecast 2025-2030 ($ million)
Data Table on Saudi Arabia - Market size and forecast 2025-2030 ($ million)
Chart on Saudi Arabia - Year-over-year growth 2025-2030 (%)
Data Table on Saudi Arabia - Year-over-year growth 2025-2030 (%)

12.6.2 UAE - Market size and forecast 2025-2030

Chart on UAE - Market size and forecast 2025-2030 ($ million)
Data Table on UAE - Market size and forecast 2025-2030 ($ million)
Chart on UAE - Year-over-year growth 2025-2030 (%)
Data Table on UAE - Year-over-year growth 2025-2030 (%)

12.6.3 South Africa - Market size and forecast 2025-2030

Chart on South Africa - Market size and forecast 2025-2030 ($ million)
Data Table on South Africa - Market size and forecast 2025-2030 ($ million)
Chart on South Africa - Year-over-year growth 2025-2030 (%)
Data Table on South Africa - Year-over-year growth 2025-2030 (%)

12.6.4 Israel - Market size and forecast 2025-2030

Chart on Israel - Market size and forecast 2025-2030 ($ million)
Data Table on Israel - Market size and forecast 2025-2030 ($ million)
Chart on Israel - Year-over-year growth 2025-2030 (%)
Data Table on Israel - Year-over-year growth 2025-2030 (%)

12.6.5 Turkey - Market size and forecast 2025-2030

Chart on Turkey - Market size and forecast 2025-2030 ($ million)
Data Table on Turkey - Market size and forecast 2025-2030 ($ million)
Chart on Turkey - Year-over-year growth 2025-2030 (%)
Data Table on Turkey - Year-over-year growth 2025-2030 (%)

12.7 South America - Market size and forecast 2025-2030

Chart on South America - Market size and forecast 2025-2030 ($ million)
Data Table on South America - Market size and forecast 2025-2030 ($ million)
Chart on South America - Year-over-year growth 2025-2030 (%)
Data Table on South America - Year-over-year growth 2025-2030 (%)
Chart on Regional Comparison - South America
Data Table on Regional Comparison - South America

12.7.1 Brazil - Market size and forecast 2025-2030

Chart on Brazil - Market size and forecast 2025-2030 ($ million)
Data Table on Brazil - Market size and forecast 2025-2030 ($ million)
Chart on Brazil - Year-over-year growth 2025-2030 (%)
Data Table on Brazil - Year-over-year growth 2025-2030 (%)

12.7.2 Argentina - Market size and forecast 2025-2030

Chart on Argentina - Market size and forecast 2025-2030 ($ million)
Data Table on Argentina - Market size and forecast 2025-2030 ($ million)
Chart on Argentina - Year-over-year growth 2025-2030 (%)
Data Table on Argentina - Year-over-year growth 2025-2030 (%)

12.7.3 Colombia - Market size and forecast 2025-2030

Chart on Colombia - Market size and forecast 2025-2030 ($ million)
Data Table on Colombia - Market size and forecast 2025-2030 ($ million)
Chart on Colombia - Year-over-year growth 2025-2030 (%)
Data Table on Colombia - Year-over-year growth 2025-2030 (%)

12.8 Market opportunity by geography

Market opportunity by geography ($ million)
Data Tables on Market opportunity by geography ($ million)

13. Drivers, Challenges, and Opportunity

13.1 Market drivers

Expansion of omnichannel retailing strategies
Integration of AI and advanced analytics
Demand for real-time supply chain visibility and resilience

13.2 Market challenges

High financial barriers and system integration hardships
Escalating cybersecurity risks in interconnected supply networks
Regulatory fragmentation and global compliance burdens

13.3 Impact of drivers and challenges

Impact of drivers and challenges in 2025 and 2030

13.4 Market opportunities

Proliferation of generative AI and autonomous agents
Adoption of sustainability-driven inventory tracking and circular logistics
Expansion of micro-fulfillment centers and edge computing integration

14. Competitive Landscape

14.1 Overview

14.2

Overview on criticality of inputs and factors of differentiation

14.3 Landscape disruption

Overview on factors of disruption

14.4 Industry risks

Impact of key risks on business

15. Competitive Analysis

15.1 Companies profiled

Companies covered

15.2 Company ranking index

15.3 Market positioning of companies

Matrix on companies position and classification

15.4 Acumatica Inc.

Acumatica Inc. - Overview
Acumatica Inc. - Product / Service
Acumatica Inc. - Key news
Acumatica Inc. - Key offerings
SWOT

15.5 Aptean

Aptean - Overview
Aptean - Product / Service
Aptean - Key offerings
SWOT

15.6 Blue Yonder Group Inc.

Blue Yonder Group Inc. - Overview
Blue Yonder Group Inc. - Product / Service
Blue Yonder Group Inc. - Key offerings
SWOT

15.7 Descartes Systems Group Inc.

Descartes Systems Group Inc. - Overview
Descartes Systems Group Inc. - Business segments
Descartes Systems Group Inc. - Key offerings
Descartes Systems Group Inc. - Segment focus
SWOT

15.8 E2open Parent Holdings Inc.

E2open Parent Holdings Inc. - Overview
E2open Parent Holdings Inc. - Business segments
E2open Parent Holdings Inc. - Key news
E2open Parent Holdings Inc. - Key offerings
E2open Parent Holdings Inc. - Segment focus
SWOT

15.9 Epicor Software Corp.

Epicor Software Corp. - Overview
Epicor Software Corp. - Product / Service
Epicor Software Corp. - Key news
Epicor Software Corp. - Key offerings
SWOT

15.10 IBM Corp.

IBM Corp. - Overview
IBM Corp. - Business segments
IBM Corp. - Key news
IBM Corp. - Key offerings
IBM Corp. - Segment focus
SWOT

15.11 Infor Inc.

Infor Inc. - Overview
Infor Inc. - Product / Service
Infor Inc. - Key offerings
SWOT

15.12 Koerber AG

Koerber AG - Overview
Koerber AG - Product / Service
Koerber AG - Key offerings
SWOT

15.13 Logility SCS Inc.

Logility SCS Inc. - Overview
Logility SCS Inc. - Product / Service
Logility SCS Inc. - Key offerings
SWOT

15.14 Manhattan Associates Inc.

Manhattan Associates Inc. - Overview
Manhattan Associates Inc. - Business segments
Manhattan Associates Inc. - Key offerings
Manhattan Associates Inc. - Segment focus
SWOT

15.15 Microsoft Corp.

Microsoft Corp. - Overview
Microsoft Corp. - Business segments
Microsoft Corp. - Key news
Microsoft Corp. - Key offerings
Microsoft Corp. - Segment focus
SWOT

15.16 Odoo SA

Odoo SA - Overview
Odoo SA - Product / Service
Odoo SA - Key offerings
SWOT

15.17 Oracle Corp.

Oracle Corp. - Overview
Oracle Corp. - Business segments
Oracle Corp. - Key news
Oracle Corp. - Key offerings
Oracle Corp. - Segment focus
SWOT

15.18 Sage Group Plc

Sage Group Plc - Overview
Sage Group Plc - Business segments
Sage Group Plc - Key news
Sage Group Plc - Key offerings
Sage Group Plc - Segment focus
SWOT

16. Appendix

16.1 Scope of the report

Market definition
Objectives
Notes and caveats

16.2 Inclusions and exclusions checklist

Inclusions checklist
Exclusions checklist

16.3 Currency conversion rates for US$

16.4 Research methodology

16.5 Data procurement

Information sources

16.6 Data validation

16.7 Validation techniques employed for market sizing

16.8 Data synthesis

16.9 360 degree market analysis

16.10 List of abbreviations

Research Methodology

Technavio presents a detailed picture of the market by way of study, synthesis, and summation of data from multiple sources. The analysts have presented the various facets of the market with a particular focus on identifying the key industry influencers. The data thus presented is comprehensive, reliable, and the result of extensive research, both primary and secondary.

INFORMATION SOURCES

Primary sources

  • Manufacturers and suppliers
  • Channel partners
  • Industry experts
  • Strategic decision makers

Secondary sources

  • Industry journals and periodicals
  • Government data
  • Financial reports of key industry players
  • Historical data
  • Press releases

DATA ANALYSIS

Data Synthesis

  • Collation of data
  • Estimation of key figures
  • Analysis of derived insights

Data Validation

  • Triangulation with data models
  • Reference against proprietary databases
  • Corroboration with industry experts

REPORT WRITING

Qualitative

  • Market drivers
  • Market challenges
  • Market trends
  • Five forces analysis

Quantitative

  • Market size and forecast
  • Market segmentation
  • Geographical insights
  • Competitive landscape

Interested in this report?

Get your sample now to see our research methodology and insights!

Download Now

Frequently Asked Questions

Inventory Management market growth will increase by USD 1381.7 million during 2026-2030.

The Inventory Management market is expected to grow at a CAGR of 8.1% during 2026-2030.

Inventory Management market is segmented by Component (Software, Services) Deployment (Cloud based, On premises, Hybrid) Application (Inventory control and tracking, Order management, Asset management, Scanning and barcoding, Others)

Acumatica Inc., Aptean, Blue Yonder Group Inc., Descartes Systems Group Inc., E2open Parent Holdings Inc., Epicor Software Corp., IBM Corp., Infor Inc., Koerber AG, Logility SCS Inc., Manhattan Associates Inc., Microsoft Corp., Odoo SA, Oracle Corp., Sage Group Plc, SAP SE, ShipHero LLC Inc., SYSPRO Pty. Ltd., Zebra Technologies Corp., Zoho Corp. Pvt. Ltd. are a few of the key vendors in the Inventory Management market.

North America will register the highest growth rate of 38.6% among the other regions. Therefore, the Inventory Management market in North America is expected to garner significant business opportunities for the vendors during the forecast period.

US, Canada, Mexico, Germany, UK, France, Italy, Spain, The Netherlands, China, Japan, India, South Korea, Australia, Indonesia, Saudi Arabia, UAE, South Africa, Israel, Turkey, Brazil, Argentina, Colombia

  • Expansion of omnichannel retailing strategies is the driving factor this market.

The Inventory Management market vendors should focus on grabbing business opportunities from the Component segment as it accounted for the largest market share in the base year.
RIA - Research AI Assistant
Ask RIA