Laboratory Balances Scales Market Analysis, Size, and Forecast 2026-2030: North America (US, Canada, and Mexico), APAC (China, India, and Japan), Europe (Germany, UK, and France), South America (Brazil), Middle East and Africa (South Africa, UAE, and Saudi Arabia), Asia, Rest of World (ROW)

Laboratory Balances Scales Market Analysis, Size, and Forecast 2026-2030:
North America (US, Canada, and Mexico), APAC (China, India, and Japan), Europe (Germany, UK, and France), South America (Brazil), Middle East and Africa (South Africa, UAE, and Saudi Arabia), Asia, Rest of World (ROW)

Published: Dec 2025 304 Pages SKU: IRTNTR81215

Market Overview at a Glance

$246 Mn
Market Opportunity
3.5%
CAGR 2025 - 2030
35.7%
Asia Growth
$512.5 Mn
Analytical balance segment 2024

Laboratory Balances Scales Market Size 2026-2030

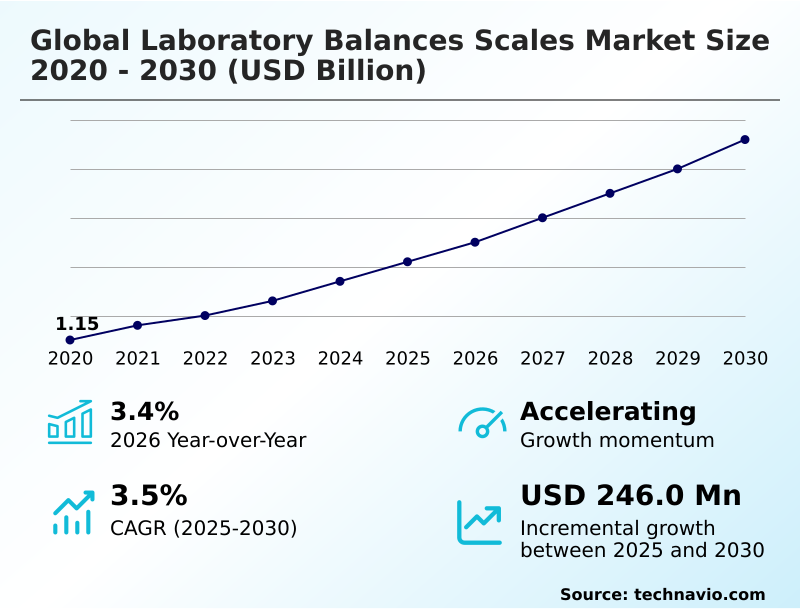
The laboratory balances scales market size is valued to increase by USD 246 million, at a CAGR of 3.5% from 2025 to 2030. Integration of internet of things and laboratory automation will drive the laboratory balances scales market.

Major Market Trends & Insights

  • Asia dominated the market and accounted for a 35.7% growth during the forecast period.
  • By Product - Analytical balance segment was valued at USD 512.5 million in 2024
  • By Capacity - Medium capacity segment accounted for the largest market revenue share in 2024

Market Size & Forecast

  • Market Opportunities: USD 401.6 million
  • Market Future Opportunities: USD 246 million
  • CAGR from 2025 to 2030 : 3.5%

Market Summary

  • The laboratory balances scales market is defined by a relentless push for precision, regulatory adherence, and operational efficiency. The core of the market is driven by expanding research and development pipelines in pharmaceuticals and biotechnology, where accurate gravimetric analysis is foundational. Instruments using technologies like electromagnetic force restoration and tuning-fork sensor technology are critical.
  • A major trend is the integration of advanced connectivity, transforming standalone devices into nodes within a laboratory information management systems (LIMS) network. This shift to the 'Lab of the Future' supports stringent data integrity compliance, driven by ALCOA+ principles.
  • For example, a contract research organization handling high-potency active ingredients can leverage automated weighing systems with touchless sensor operation to eliminate cross-contamination risks and ensure operator safety, while built-in internal calibration routines and predictive maintenance sensors guarantee consistent instrument performance verification and minimize downtime.
  • However, the high capital cost of instruments with features like static elimination technology and the need for skilled operators present significant adoption hurdles, especially for smaller labs. Equipment longevity also creates a challenge, as labs may delay upgrades, impacting the replacement cycle for new sales.

What will be the Size of the Laboratory Balances Scales Market during the forecast period?

Get Key Insights on Market Forecast (PDF) Request Free Sample

How is the Laboratory Balances Scales Market Segmented?

The laboratory balances scales industry research report provides comprehensive data (region-wise segment analysis), with forecasts and estimates in "USD million" for the period 2026-2030, as well as historical data from 2020-2024 for the following segments.

  • Product
    • Analytical balance
    • Micro balance
    • Compact scale
    • Moisture balance
    • Others
  • Capacity
    • Medium capacity
    • High capacity
    • Micro capacity
  • End-user
    • Manufacturers
    • Research and diagnostic lab
    • Academic institutes
  • Geography
    • North America
      • US
      • Canada
      • Mexico
    • Asia
    • Europe
      • Germany
      • UK
      • France
    • Rest of World (ROW)

By Product Insights

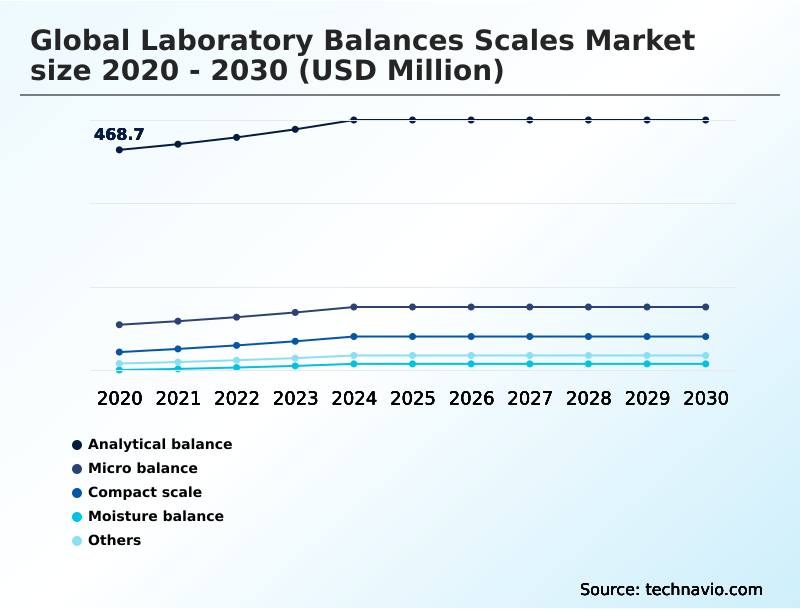
The analytical balance segment is estimated to witness significant growth during the forecast period.

The global laboratory balances scales market 2026-2030 is segmented by product, capacity, end-user, and geography. Analytical balances, crucial for quantitative chemical analysis, represent a cornerstone segment.

These instruments primarily leverage electromagnetic force restoration for superior accuracy in gravimetric analysis, essential for formulation process control and analytical method validation.

Modern units feature advanced digital filtering algorithms to ensure stability, while software supports user management features and comprehensive audit trail documentation to meet stringent data integrity compliance standards.

The integration of these balances into sample preparation automation protocols has streamlined quality control workflows, with some labs reporting a 30% reduction in manual data entry errors.

This focus on compliance and efficiency, backed by robust instrument performance verification, defines the segment's trajectory, ensuring precision in critical scientific and industrial applications.

Request Free Sample

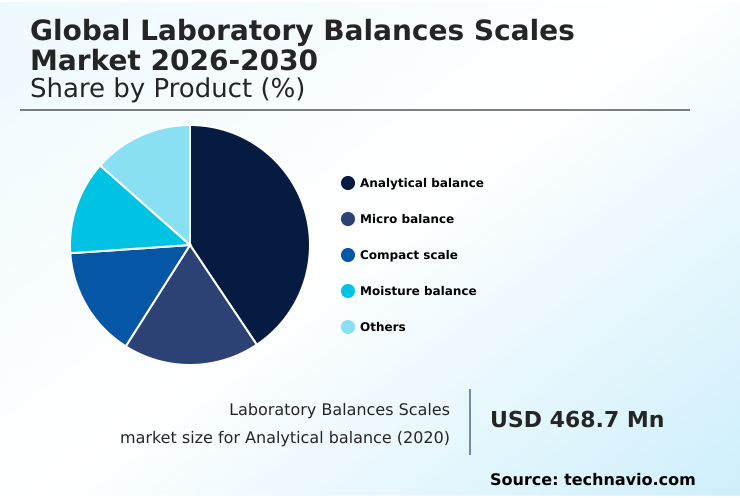
The Analytical balance segment was valued at USD 512.5 million in 2024 and showed a gradual increase during the forecast period.

Request Free Sample

Regional Analysis

Asia is estimated to contribute 35.7% to the growth of the global market during the forecast period.Technavio’s analysts have elaborately explained the regional trends and drivers that shape the market during the forecast period.

See How Laboratory Balances Scales Market Demand is Rising in Asia Request Free Sample

The geographic landscape is shifting, with North America's mature market focused on upgrading to systems compliant with FDA 21 CFR Part 11, while Asia emerges as the fastest-growing region, contributing over 35% of the incremental growth.

This is driven by supply chain diversification and the expansion of manufacturing, which requires robust raw material tracking and finished product verification.

In Europe, the emphasis is on integration into the smart factory ecosystem, with weigh modules integration into automated lines improving efficiency.

In contrast, emerging economies often prioritize versatile instruments like the moisture balance and those using durable strain gauge load cells for essential quality control.

This regional divergence highlights different adoption priorities, from high-end automation to fundamental adherence to mass metrology standards.

Market Dynamics

Our researchers analyzed the data with 2025 as the base year, along with the key drivers, trends, and challenges. A holistic analysis of drivers will help companies refine their marketing strategies to gain a competitive advantage.

  • The global laboratory balances scales market 2026-2030 is increasingly defined by specialized applications and user requirements. For instance, laboratory balances for pharmaceutical qc must provide flawless data integrity, making scales with lims integration capabilities essential for compliance. When selecting balances for university labs, durability and ease of use are prioritized over microgram precision.
  • In advanced research, preventing static in micro-weighing is a critical challenge, driving demand for balances with built-in ionizers, especially for microbalance for hpapi handling. The food sector relies on the moisture analyzer for food industry to ensure product quality and shelf-life. In contrast, industrial applications often require a high capacity balance for pilot plants.
  • The path to procurement is also evolving; many organizations now favor comprehensive balance calibration and service contracts to ensure long-term performance and regulatory adherence. For high-tech applications, the focus is on deploying automated powder dosing systems and finding usp compliant weighing solutions.
  • The use of portable scales for field research is growing in environmental science, while the core of gravimetric analysis in materials science continues to demand high-precision instruments. Weighing solutions for biotech startups often need to be scalable and cost-effective.
  • Ultimately, understanding the nuances of balance performance qualification process and how environmental factors affecting weighing impact accuracy is crucial for reducing error in analytical weighing and ensuring reliable data integrity in weighing records.
  • Organizations adopting smart balances for industry 4.0 report up to a 15% improvement in process consistency compared to those using non-integrated systems, highlighting a strategic shift toward connected metrology.

What are the key market drivers leading to the rise in the adoption of Laboratory Balances Scales Industry?

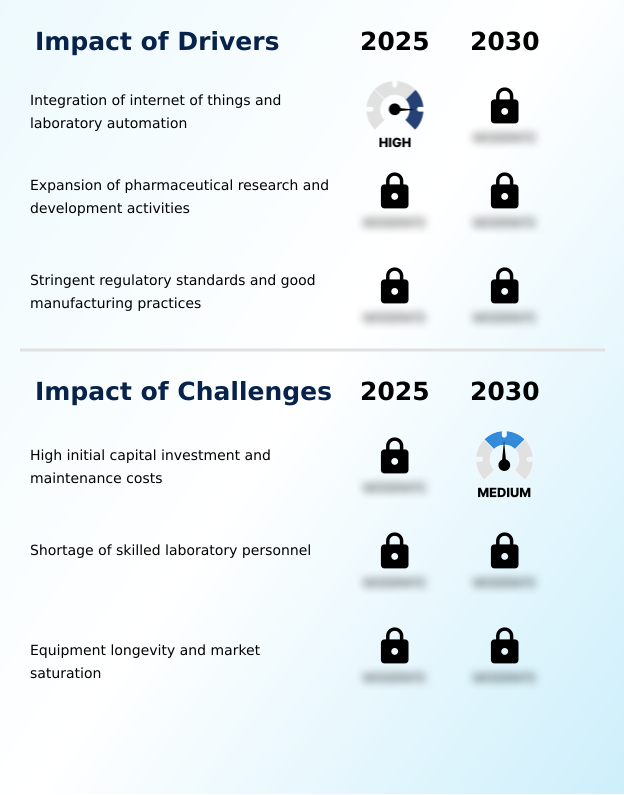
  • The integration of the Internet of Things and laboratory automation is a key driver, enabling connected ecosystems that improve data accuracy and operational throughput.

  • The expansion of research and development pipelines, particularly in personalized medicine research, is a major driver. This growth, amplified by contract research organizations and contract manufacturing organizations, necessitates strict regulatory standard adherence.
  • Compliance with good manufacturing practice (GMP) and good laboratory practice (GLP), guided by ALCOA+ principles and standards like the united states pharmacopeia, compels investment in compliant hardware.
  • Many labs are seeking ISO 17025 accreditation, driving demand for instruments with advanced technologies like the super hybrid sensor and unibloc mass sensor. These drivers also support greater supply chain resilience, as accurate weighing is critical for quality control.
  • Instruments that automate compliance checks can accelerate product release times by up to 15%.

What are the market trends shaping the Laboratory Balances Scales Industry?

  • The integration of advanced connectivity is transforming laboratory weighing. This evolution toward interconnected systems enhances data integrity and operational efficiency.

  • A primary trend is the focus on enhanced precision for high-potency active ingredients and biopharmaceutical formulation. This drives demand for advanced weighing cell technology with integrated static elimination technology to ensure accuracy in high-throughput screening.
  • The adoption of smart features, such as internal calibration routines and real-time monitoring of environmental conditions, supports preventative instrument maintenance, with some labs reducing unscheduled downtime by 20%. These capabilities, including remote troubleshooting capabilities, enhance operational uptime enhancement and contribute to better equipment lifecycle management.
  • Another significant trend is the use of specialized instruments for thermogravimetric analysis that are fully integrated into automated laboratory workflow optimization systems.

What challenges does the Laboratory Balances Scales Industry face during its growth?

  • High initial capital investment and subsequent maintenance costs present a key challenge, potentially limiting the adoption of advanced weighing technologies for budget-constrained organizations.

  • A key challenge is the high total cost of ownership, which includes not only the initial investment but also maintenance and calibration. Another hurdle is the shortage of skilled personnel with sufficient hands-on instrumental analysis training to operate complex robotic weighing systems or correctly perform minimum weight determination. Equipment longevity also slows replacement cycles.
  • While advanced features like touchless sensor operation and weigh modules integration into a smart factory ecosystem offer efficiency, labs with stable workflows may not see the ROI. For example, a lab focused on basic raw material tracking using parts counting functionality might defer upgrading, impacting new sales.
  • This dynamic pushes manufacturers to justify upgrades that support finished product verification and other high-value tasks.

Exclusive Technavio Analysis on Customer Landscape

The laboratory balances scales market forecasting report includes the adoption lifecycle of the market, covering from the innovator’s stage to the laggard’s stage. It focuses on adoption rates in different regions based on penetration. Furthermore, the laboratory balances scales market report also includes key purchase criteria and drivers of price sensitivity to help companies evaluate and develop their market growth analysis strategies.

Customer Landscape of Laboratory Balances Scales Industry

Competitive Landscape

Companies are implementing various strategies, such as strategic alliances, laboratory balances scales market forecast, partnerships, mergers and acquisitions, geographical expansion, and product/service launches, to enhance their presence in the industry.

A and D HOLON HC Ltd. - Patented sensor technology offers rapid stabilization and high durability for a range of precision and analytical weighing applications.

The industry research and growth report includes detailed analyses of the competitive landscape of the market and information about key companies, including:

  • A and D HOLON HC Ltd.
  • Adam Equipment Inc.
  • Avantor Inc.
  • AXIS
  • BEL Engineering srl
  • Cole Parmer
  • Gibertini Elettronica s.r.l.
  • GRAM GROUP
  • KERN and SOHN GmbH
  • METTLER TOLEDO
  • OHAUS Corp.
  • PCE Holding GmbH
  • Precisa Gravimetrics AG
  • Radwag Wagi Elektroniczne
  • Rice Lake weighing systems
  • Sartorius AG
  • Scientific Industries Inc.
  • Setra Systems
  • Shimadzu Corp.
  • Shinko Denshi Co. Ltd

Qualitative and quantitative analysis of companies has been conducted to help clients understand the wider business environment as well as the strengths and weaknesses of key industry players. Data is qualitatively analyzed to categorize companies as pure play, category-focused, industry-focused, and diversified; it is quantitatively analyzed to categorize companies as dominant, leading, strong, tentative, and weak.

Recent Development and News in Laboratory balances scales market

  • In November, 2024, Novo Nordisk announced a major investment in expanding its manufacturing facilities, requiring extensive procurement of quality control equipment, including industrial and laboratory scales.
  • In February, 2025, Mettler Toledo launched a new iteration of its XPR micro-analytical balances with advanced static detection systems to support the handling of small, potent compounds in biotech.
  • In March, 2025, Sartorius expanded its Cubis II portfolio with new software features enabling bi-directional communication with various LIMS providers for software-defined weighing hardware.
  • In May, 2025, Mettler Toledo showcased advancements in its LabX software, emphasizing secure data handling and instrument management for regulated laboratory environments.

Dive into Technavio’s robust research methodology, blending expert interviews, extensive data synthesis, and validated models for unparalleled Laboratory Balances Scales Market insights. See full methodology.

Market Scope
Page number 304
Base year 2025
Historic period 2020-2024
Forecast period 2026-2030
Growth momentum & CAGR Accelerate at a CAGR of 3.5%
Market growth 2026-2030 USD 246.0 million
Market structure Fragmented
YoY growth 2025-2026(%) 3.4%
Key countries US, Canada, Mexico, China, India, Japan, South Korea, Indonesia, Thailand, Singapore, Germany, UK, France, The Netherlands, Italy, Spain, Russia, Australia, Brazil, South Africa, UAE, Saudi Arabia and Turkey
Competitive landscape Leading Companies, Market Positioning of Companies, Competitive Strategies, and Industry Risks

Request Free Sample

Research Analyst Overview

  • The laboratory balances scales market is shaped by the convergence of advanced instrumentation and stringent data management requirements. Core technologies like electromagnetic force restoration and the tuning-fork sensor technology continue to evolve, offering greater precision in gravimetric analysis.
  • The market's trajectory is heavily influenced by the need for compliance with standards such as good manufacturing practice and good laboratory practice, which mandate rigorous minimum weight determination and traceable mass metrology standards.
  • A key trend is the integration with laboratory information management systems and electronic laboratory notebooks, which transforms instruments from standalone devices to critical data points in a connected ecosystem. This shift addresses the ALCOA+ principles by enabling features like user management and automated weighing systems.
  • For instance, laboratories implementing systems with predictive maintenance sensors have seen a 20% reduction in unscheduled downtime. Boardroom decisions are now centered on the total cost of ownership, where investments in modular instrument design and robotic weighing systems are justified by long-term gains in throughput, data integrity, and compliance, moving beyond the initial capital expense.

What are the Key Data Covered in this Laboratory Balances Scales Market Research and Growth Report?

  • What is the expected growth of the Laboratory Balances Scales Market between 2026 and 2030?

    • USD 246 million, at a CAGR of 3.5%

  • What segmentation does the market report cover?

    • The report is segmented by Product (Analytical balance, Micro balance, Compact scale, Moisture balance, and Others), Capacity (Medium capacity, High capacity, and Micro capacity), End-user (Manufacturers, Research and diagnostic lab, and Academic institutes) and Geography (North America, Asia, Europe, Rest of World (ROW))

  • Which regions are analyzed in the report?

    • North America, Asia, Europe and Rest of World (ROW)

  • What are the key growth drivers and market challenges?

    • Integration of internet of things and laboratory automation, High initial capital investment and maintenance costs

  • Who are the major players in the Laboratory Balances Scales Market?

    • A and D HOLON HC Ltd., Adam Equipment Inc., Avantor Inc., AXIS, BEL Engineering srl, Cole Parmer, Gibertini Elettronica s.r.l., GRAM GROUP, KERN and SOHN GmbH, METTLER TOLEDO, OHAUS Corp., PCE Holding GmbH, Precisa Gravimetrics AG, Radwag Wagi Elektroniczne, Rice Lake weighing systems, Sartorius AG, Scientific Industries Inc., Setra Systems, Shimadzu Corp. and Shinko Denshi Co. Ltd

Market Research Insights

  • Market dynamics are shaped by the convergence of stringent regulatory demands and the pursuit of operational excellence. Adherence to evolving standards is paramount, driving investment in instruments that facilitate analytical method validation and ensure robust data integrity compliance.
  • This focus on compliance has led to a 40% increase in the adoption of systems with integrated audit trail documentation over the last three years. In parallel, the expansion of contract research organizations and contract manufacturing organizations is fueling demand for high-throughput solutions. Implementing laboratory workflow optimization through connected devices can reduce sample processing times by up to 25%.
  • This push for efficiency and compliance underscores the market's trajectory toward smarter, more integrated weighing solutions that enhance research and development pipelines.

We can help! Our analysts can customize this laboratory balances scales market research report to meet your requirements.

Get in touch

1. Executive Summary

1.1 Market overview

Executive Summary - Chart on Market Overview
Executive Summary - Data Table on Market Overview
Executive Summary - Chart on Global Market Characteristics
Executive Summary - Chart on Market by Geography
Executive Summary - Chart on Market Segmentation by Product
Executive Summary - Chart on Market Segmentation by Capacity
Executive Summary - Chart on Market Segmentation by End-user
Executive Summary - Chart on Incremental Growth
Executive Summary - Data Table on Incremental Growth
Executive Summary - Chart on Company Market Positioning

2. Technavio Analysis

2.1 Analysis of price sensitivity, lifecycle, customer purchase basket, adoption rates, and purchase criteria

2.2 Criticality of inputs and Factors of differentiation

Chart on Overview on criticality of inputs and factors of differentiation

2.3 Factors of disruption

Chart on Overview on factors of disruption

2.4 Impact of drivers and challenges

Chart on Impact of drivers and challenges in 2025 and 2030

3. Market Landscape

3.1 Market ecosystem

Chart on Parent Market
Data Table on - Parent Market

3.2 Market characteristics

Chart on Market characteristics analysis

3.3 Value chain analysis

Chart on Value chain analysis

4. Market Sizing

4.1 Market definition

Data Table on Offerings of companies included in the market definition

4.2 Market segment analysis

Market segments

4.3 Market size 2025

4.4 Market outlook: Forecast for 2025-2030

Chart on Global - Market size and forecast 2025-2030 ($ million)
Data Table on Global - Market size and forecast 2025-2030 ($ million)
Chart on Global Market: Year-over-year growth 2025-2030 (%)
Data Table on Global Market: Year-over-year growth 2025-2030 (%)

5. Historic Market Size

5.1 Global Laboratory Balances Scales Market 2020 - 2024

Historic Market Size - Data Table on Global Laboratory Balances Scales Market 2020 - 2024 ($ million)

5.2 Product segment analysis 2020 - 2024

Historic Market Size - Product Segment 2020 - 2024 ($ million)

5.3 Capacity segment analysis 2020 - 2024

Historic Market Size - Capacity Segment 2020 - 2024 ($ million)

5.4 End-user segment analysis 2020 - 2024

Historic Market Size - End-user Segment 2020 - 2024 ($ million)

5.5 Geography segment analysis 2020 - 2024

Historic Market Size - Geography Segment 2020 - 2024 ($ million)

5.6 Country segment analysis 2020 - 2024

Historic Market Size - Country Segment 2020 - 2024 ($ million)

6. Qualitative Analysis

6.1 Impact of AI on the Global Laboratory Balances Scales Market

7. Five Forces Analysis

7.1 Five forces summary

Five forces analysis - Comparison between 2025 and 2030

7.2 Bargaining power of buyers

Bargaining power of buyers - Impact of key factors 2025 and 2030

7.3 Bargaining power of suppliers

Bargaining power of suppliers - Impact of key factors in 2025 and 2030

7.4 Threat of new entrants

Threat of new entrants - Impact of key factors in 2025 and 2030

7.5 Threat of substitutes

Threat of substitutes - Impact of key factors in 2025 and 2030

7.6 Threat of rivalry

Threat of rivalry - Impact of key factors in 2025 and 2030

7.7 Market condition

Chart on Market condition - Five forces 2025 and 2030

8. Market Segmentation by Product

8.1 Market segments

Chart on Product - Market share 2025-2030 (%)
Data Table on Product - Market share 2025-2030 (%)

8.2 Comparison by Product

Chart on Comparison by Product
Data Table on Comparison by Product

8.3 Analytical balance - Market size and forecast 2025-2030

Chart on Analytical balance - Market size and forecast 2025-2030 ($ million)
Data Table on Analytical balance - Market size and forecast 2025-2030 ($ million)
Chart on Analytical balance - Year-over-year growth 2025-2030 (%)
Data Table on Analytical balance - Year-over-year growth 2025-2030 (%)

8.4 Micro balance - Market size and forecast 2025-2030

Chart on Micro balance - Market size and forecast 2025-2030 ($ million)
Data Table on Micro balance - Market size and forecast 2025-2030 ($ million)
Chart on Micro balance - Year-over-year growth 2025-2030 (%)
Data Table on Micro balance - Year-over-year growth 2025-2030 (%)

8.5 Compact scale - Market size and forecast 2025-2030

Chart on Compact scale - Market size and forecast 2025-2030 ($ million)
Data Table on Compact scale - Market size and forecast 2025-2030 ($ million)
Chart on Compact scale - Year-over-year growth 2025-2030 (%)
Data Table on Compact scale - Year-over-year growth 2025-2030 (%)

8.6 Moisture balance - Market size and forecast 2025-2030

Chart on Moisture balance - Market size and forecast 2025-2030 ($ million)
Data Table on Moisture balance - Market size and forecast 2025-2030 ($ million)
Chart on Moisture balance - Year-over-year growth 2025-2030 (%)
Data Table on Moisture balance - Year-over-year growth 2025-2030 (%)

8.7 Others - Market size and forecast 2025-2030

Chart on Others - Market size and forecast 2025-2030 ($ million)
Data Table on Others - Market size and forecast 2025-2030 ($ million)
Chart on Others - Year-over-year growth 2025-2030 (%)
Data Table on Others - Year-over-year growth 2025-2030 (%)

8.8 Market opportunity by Product

Market opportunity by Product ($ million)
Data Table on Market opportunity by Product ($ million)

9. Market Segmentation by Capacity

9.1 Market segments

Chart on Capacity - Market share 2025-2030 (%)
Data Table on Capacity - Market share 2025-2030 (%)

9.2 Comparison by Capacity

Chart on Comparison by Capacity
Data Table on Comparison by Capacity

9.3 Medium capacity - Market size and forecast 2025-2030

Chart on Medium capacity - Market size and forecast 2025-2030 ($ million)
Data Table on Medium capacity - Market size and forecast 2025-2030 ($ million)
Chart on Medium capacity - Year-over-year growth 2025-2030 (%)
Data Table on Medium capacity - Year-over-year growth 2025-2030 (%)

9.4 High capacity - Market size and forecast 2025-2030

Chart on High capacity - Market size and forecast 2025-2030 ($ million)
Data Table on High capacity - Market size and forecast 2025-2030 ($ million)
Chart on High capacity - Year-over-year growth 2025-2030 (%)
Data Table on High capacity - Year-over-year growth 2025-2030 (%)

9.5 Micro capacity - Market size and forecast 2025-2030

Chart on Micro capacity - Market size and forecast 2025-2030 ($ million)
Data Table on Micro capacity - Market size and forecast 2025-2030 ($ million)
Chart on Micro capacity - Year-over-year growth 2025-2030 (%)
Data Table on Micro capacity - Year-over-year growth 2025-2030 (%)

9.6 Market opportunity by Capacity

Market opportunity by Capacity ($ million)
Data Table on Market opportunity by Capacity ($ million)

10. Market Segmentation by End-user

10.1 Market segments

Chart on End-user - Market share 2025-2030 (%)
Data Table on End-user - Market share 2025-2030 (%)

10.2 Comparison by End-user

Chart on Comparison by End-user
Data Table on Comparison by End-user

10.3 Manufacturers - Market size and forecast 2025-2030

Chart on Manufacturers - Market size and forecast 2025-2030 ($ million)
Data Table on Manufacturers - Market size and forecast 2025-2030 ($ million)
Chart on Manufacturers - Year-over-year growth 2025-2030 (%)
Data Table on Manufacturers - Year-over-year growth 2025-2030 (%)

10.4 Research and diagnostic lab - Market size and forecast 2025-2030

Chart on Research and diagnostic lab - Market size and forecast 2025-2030 ($ million)
Data Table on Research and diagnostic lab - Market size and forecast 2025-2030 ($ million)
Chart on Research and diagnostic lab - Year-over-year growth 2025-2030 (%)
Data Table on Research and diagnostic lab - Year-over-year growth 2025-2030 (%)

10.5 Academic institutes - Market size and forecast 2025-2030

Chart on Academic institutes - Market size and forecast 2025-2030 ($ million)
Data Table on Academic institutes - Market size and forecast 2025-2030 ($ million)
Chart on Academic institutes - Year-over-year growth 2025-2030 (%)
Data Table on Academic institutes - Year-over-year growth 2025-2030 (%)

10.6 Market opportunity by End-user

Market opportunity by End-user ($ million)
Data Table on Market opportunity by End-user ($ million)

11. Customer Landscape

11.1 Customer landscape overview

Analysis of price sensitivity, lifecycle, customer purchase basket, adoption rates, and purchase criteria

12. Geographic Landscape

12.1 Geographic segmentation

Chart on Market share by geography 2025-2030 (%)
Data Table on Market share by geography 2025-2030 (%)

12.2 Geographic comparison

Chart on Geographic comparison
Data Table on Geographic comparison

12.3 North America - Market size and forecast 2025-2030

Chart on North America - Market size and forecast 2025-2030 ($ million)
Data Table on North America - Market size and forecast 2025-2030 ($ million)
Chart on North America - Year-over-year growth 2025-2030 (%)
Data Table on North America - Year-over-year growth 2025-2030 (%)
Chart on Regional Comparison - North America
Data Table on Regional Comparison - North America

12.3.1 US - Market size and forecast 2025-2030

Chart on US - Market size and forecast 2025-2030 ($ million)
Data Table on US - Market size and forecast 2025-2030 ($ million)
Chart on US - Year-over-year growth 2025-2030 (%)
Data Table on US - Year-over-year growth 2025-2030 (%)

12.3.2 Canada - Market size and forecast 2025-2030

Chart on Canada - Market size and forecast 2025-2030 ($ million)
Data Table on Canada - Market size and forecast 2025-2030 ($ million)
Chart on Canada - Year-over-year growth 2025-2030 (%)
Data Table on Canada - Year-over-year growth 2025-2030 (%)

12.3.3 Mexico - Market size and forecast 2025-2030

Chart on Mexico - Market size and forecast 2025-2030 ($ million)
Data Table on Mexico - Market size and forecast 2025-2030 ($ million)
Chart on Mexico - Year-over-year growth 2025-2030 (%)
Data Table on Mexico - Year-over-year growth 2025-2030 (%)

12.4 Asia - Market size and forecast 2025-2030

Chart on Asia - Market size and forecast 2025-2030 ($ million)
Data Table on Asia - Market size and forecast 2025-2030 ($ million)
Chart on Asia - Year-over-year growth 2025-2030 (%)
Data Table on Asia - Year-over-year growth 2025-2030 (%)
Chart on Regional Comparison - Asia
Data Table on Regional Comparison - Asia

12.4.1 China - Market size and forecast 2025-2030

Chart on China - Market size and forecast 2025-2030 ($ million)
Data Table on China - Market size and forecast 2025-2030 ($ million)
Chart on China - Year-over-year growth 2025-2030 (%)
Data Table on China - Year-over-year growth 2025-2030 (%)

12.4.2 India - Market size and forecast 2025-2030

Chart on India - Market size and forecast 2025-2030 ($ million)
Data Table on India - Market size and forecast 2025-2030 ($ million)
Chart on India - Year-over-year growth 2025-2030 (%)
Data Table on India - Year-over-year growth 2025-2030 (%)

12.4.3 Japan - Market size and forecast 2025-2030

Chart on Japan - Market size and forecast 2025-2030 ($ million)
Data Table on Japan - Market size and forecast 2025-2030 ($ million)
Chart on Japan - Year-over-year growth 2025-2030 (%)
Data Table on Japan - Year-over-year growth 2025-2030 (%)

12.4.4 South Korea - Market size and forecast 2025-2030

Chart on South Korea - Market size and forecast 2025-2030 ($ million)
Data Table on South Korea - Market size and forecast 2025-2030 ($ million)
Chart on South Korea - Year-over-year growth 2025-2030 (%)
Data Table on South Korea - Year-over-year growth 2025-2030 (%)

12.4.5 Indonesia - Market size and forecast 2025-2030

Chart on Indonesia - Market size and forecast 2025-2030 ($ million)
Data Table on Indonesia - Market size and forecast 2025-2030 ($ million)
Chart on Indonesia - Year-over-year growth 2025-2030 (%)
Data Table on Indonesia - Year-over-year growth 2025-2030 (%)

12.4.6 Thailand - Market size and forecast 2025-2030

Chart on Thailand - Market size and forecast 2025-2030 ($ million)
Data Table on Thailand - Market size and forecast 2025-2030 ($ million)
Chart on Thailand - Year-over-year growth 2025-2030 (%)
Data Table on Thailand - Year-over-year growth 2025-2030 (%)

12.4.7 Singapore - Market size and forecast 2025-2030

Chart on Singapore - Market size and forecast 2025-2030 ($ million)
Data Table on Singapore - Market size and forecast 2025-2030 ($ million)
Chart on Singapore - Year-over-year growth 2025-2030 (%)
Data Table on Singapore - Year-over-year growth 2025-2030 (%)

12.5 Europe - Market size and forecast 2025-2030

Chart on Europe - Market size and forecast 2025-2030 ($ million)
Data Table on Europe - Market size and forecast 2025-2030 ($ million)
Chart on Europe - Year-over-year growth 2025-2030 (%)
Data Table on Europe - Year-over-year growth 2025-2030 (%)
Chart on Regional Comparison - Europe
Data Table on Regional Comparison - Europe

12.5.1 Germany - Market size and forecast 2025-2030

Chart on Germany - Market size and forecast 2025-2030 ($ million)
Data Table on Germany - Market size and forecast 2025-2030 ($ million)
Chart on Germany - Year-over-year growth 2025-2030 (%)
Data Table on Germany - Year-over-year growth 2025-2030 (%)

12.5.2 UK - Market size and forecast 2025-2030

Chart on UK - Market size and forecast 2025-2030 ($ million)
Data Table on UK - Market size and forecast 2025-2030 ($ million)
Chart on UK - Year-over-year growth 2025-2030 (%)
Data Table on UK - Year-over-year growth 2025-2030 (%)

12.5.3 France - Market size and forecast 2025-2030

Chart on France - Market size and forecast 2025-2030 ($ million)
Data Table on France - Market size and forecast 2025-2030 ($ million)
Chart on France - Year-over-year growth 2025-2030 (%)
Data Table on France - Year-over-year growth 2025-2030 (%)

12.5.4 The Netherlands - Market size and forecast 2025-2030

Chart on The Netherlands - Market size and forecast 2025-2030 ($ million)
Data Table on The Netherlands - Market size and forecast 2025-2030 ($ million)
Chart on The Netherlands - Year-over-year growth 2025-2030 (%)
Data Table on The Netherlands - Year-over-year growth 2025-2030 (%)

12.5.5 Italy - Market size and forecast 2025-2030

Chart on Italy - Market size and forecast 2025-2030 ($ million)
Data Table on Italy - Market size and forecast 2025-2030 ($ million)
Chart on Italy - Year-over-year growth 2025-2030 (%)
Data Table on Italy - Year-over-year growth 2025-2030 (%)

12.5.6 Spain - Market size and forecast 2025-2030

Chart on Spain - Market size and forecast 2025-2030 ($ million)
Data Table on Spain - Market size and forecast 2025-2030 ($ million)
Chart on Spain - Year-over-year growth 2025-2030 (%)
Data Table on Spain - Year-over-year growth 2025-2030 (%)

12.5.7 Russia - Market size and forecast 2025-2030

Chart on Russia - Market size and forecast 2025-2030 ($ million)
Data Table on Russia - Market size and forecast 2025-2030 ($ million)
Chart on Russia - Year-over-year growth 2025-2030 (%)
Data Table on Russia - Year-over-year growth 2025-2030 (%)

12.6 Rest of World (ROW) - Market size and forecast 2025-2030

Chart on Rest of World (ROW) - Market size and forecast 2025-2030 ($ million)
Data Table on Rest of World (ROW) - Market size and forecast 2025-2030 ($ million)
Chart on Rest of World (ROW) - Year-over-year growth 2025-2030 (%)
Data Table on Rest of World (ROW) - Year-over-year growth 2025-2030 (%)
Chart on Regional Comparison - Rest of World (ROW)
Data Table on Regional Comparison - Rest of World (ROW)

12.6.1 Australia - Market size and forecast 2025-2030

Chart on Australia - Market size and forecast 2025-2030 ($ million)
Data Table on Australia - Market size and forecast 2025-2030 ($ million)
Chart on Australia - Year-over-year growth 2025-2030 (%)
Data Table on Australia - Year-over-year growth 2025-2030 (%)

12.6.2 Brazil - Market size and forecast 2025-2030

Chart on Brazil - Market size and forecast 2025-2030 ($ million)
Data Table on Brazil - Market size and forecast 2025-2030 ($ million)
Chart on Brazil - Year-over-year growth 2025-2030 (%)
Data Table on Brazil - Year-over-year growth 2025-2030 (%)

12.6.3 South Africa - Market size and forecast 2025-2030

Chart on South Africa - Market size and forecast 2025-2030 ($ million)
Data Table on South Africa - Market size and forecast 2025-2030 ($ million)
Chart on South Africa - Year-over-year growth 2025-2030 (%)
Data Table on South Africa - Year-over-year growth 2025-2030 (%)

12.6.4 UAE - Market size and forecast 2025-2030

Chart on UAE - Market size and forecast 2025-2030 ($ million)
Data Table on UAE - Market size and forecast 2025-2030 ($ million)
Chart on UAE - Year-over-year growth 2025-2030 (%)
Data Table on UAE - Year-over-year growth 2025-2030 (%)

12.6.5 Saudi Arabia - Market size and forecast 2025-2030

Chart on Saudi Arabia - Market size and forecast 2025-2030 ($ million)
Data Table on Saudi Arabia - Market size and forecast 2025-2030 ($ million)
Chart on Saudi Arabia - Year-over-year growth 2025-2030 (%)
Data Table on Saudi Arabia - Year-over-year growth 2025-2030 (%)

12.6.6 Turkey - Market size and forecast 2025-2030

Chart on Turkey - Market size and forecast 2025-2030 ($ million)
Data Table on Turkey - Market size and forecast 2025-2030 ($ million)
Chart on Turkey - Year-over-year growth 2025-2030 (%)
Data Table on Turkey - Year-over-year growth 2025-2030 (%)

12.7 Market opportunity by geography

Market opportunity by geography ($ million)
Data Tables on Market opportunity by geography ($ million)

13. Drivers, Challenges, and Opportunity

13.1 Market drivers

Integration of internet of things and laboratory automation
Expansion of pharmaceutical research and development activities
Stringent regulatory standards and good manufacturing practices

13.2 Market challenges

High initial capital investment and maintenance costs
Shortage of skilled laboratory personnel
Equipment longevity and market saturation

13.3 Impact of drivers and challenges

Impact of drivers and challenges in 2025 and 2030

13.4 Market opportunities

Integration of advanced connectivity in laboratory weighing
Prioritization of sustainability and energy efficiency in lab equipment
Enhanced precision for high-potency API and biotech applications

14. Competitive Landscape

14.1 Overview

14.2

Overview on criticality of inputs and factors of differentiation

14.3 Landscape disruption

Overview on factors of disruption

14.4 Industry risks

Impact of key risks on business

15. Competitive Analysis

15.1 Companies profiled

Companies covered

15.2 Company ranking index

15.3 Market positioning of companies

Matrix on companies position and classification

15.4 A and D HOLON HC Ltd.

A and D HOLON HC Ltd. - Overview
A and D HOLON HC Ltd. - Business segments
A and D HOLON HC Ltd. - Key offerings
A and D HOLON HC Ltd. - Segment focus
SWOT

15.5 Adam Equipment Inc.

Adam Equipment Inc. - Overview
Adam Equipment Inc. - Product / Service
Adam Equipment Inc. - Key offerings
SWOT

15.6 Avantor Inc.

Avantor Inc. - Overview
Avantor Inc. - Business segments
Avantor Inc. - Key news
Avantor Inc. - Key offerings
Avantor Inc. - Segment focus
SWOT

15.7 BEL Engineering srl

BEL Engineering srl - Overview
BEL Engineering srl - Product / Service
BEL Engineering srl - Key offerings
SWOT

15.8 Cole Parmer

Cole Parmer - Overview
Cole Parmer - Product / Service
Cole Parmer - Key offerings
SWOT

15.9 KERN and SOHN GmbH

KERN and SOHN GmbH - Overview
KERN and SOHN GmbH - Product / Service
KERN and SOHN GmbH - Key offerings
SWOT

15.10 METTLER TOLEDO

METTLER TOLEDO - Overview
METTLER TOLEDO - Business segments
METTLER TOLEDO - Key news
METTLER TOLEDO - Key offerings
METTLER TOLEDO - Segment focus
SWOT

15.11 OHAUS Corp.

OHAUS Corp. - Overview
OHAUS Corp. - Product / Service
OHAUS Corp. - Key offerings
SWOT

15.12 Precisa Gravimetrics AG

Precisa Gravimetrics AG - Overview
Precisa Gravimetrics AG - Product / Service
Precisa Gravimetrics AG - Key offerings
SWOT

15.13 Radwag Wagi Elektroniczne

Radwag Wagi Elektroniczne - Overview
Radwag Wagi Elektroniczne - Product / Service
Radwag Wagi Elektroniczne - Key offerings
SWOT

15.14 Rice Lake weighing systems

Rice Lake weighing systems - Overview
Rice Lake weighing systems - Product / Service
Rice Lake weighing systems - Key offerings
SWOT

15.15 Sartorius AG

Sartorius AG - Overview
Sartorius AG - Business segments
Sartorius AG - Key news
Sartorius AG - Key offerings
Sartorius AG - Segment focus
SWOT

15.16 Scientific Industries Inc.

Scientific Industries Inc. - Overview
Scientific Industries Inc. - Product / Service
Scientific Industries Inc. - Key offerings
SWOT

15.17 Shimadzu Corp.

Shimadzu Corp. - Overview
Shimadzu Corp. - Business segments
Shimadzu Corp. - Key news
Shimadzu Corp. - Key offerings
Shimadzu Corp. - Segment focus
SWOT

15.18 Shinko Denshi Co. Ltd

Shinko Denshi Co. Ltd - Overview
Shinko Denshi Co. Ltd - Product / Service
Shinko Denshi Co. Ltd - Key offerings
SWOT

16. Appendix

16.1 Scope of the report

Market definition
Objectives
Notes and caveats

16.2 Inclusions and exclusions checklist

Inclusions checklist
Exclusions checklist

16.3 Currency conversion rates for US$

16.4 Research methodology

16.5 Data procurement

Information sources

16.6 Data validation

16.7 Validation techniques employed for market sizing

16.8 Data synthesis

16.9 360 degree market analysis

16.10 List of abbreviations

Research Methodology

Technavio presents a detailed picture of the market by way of study, synthesis, and summation of data from multiple sources. The analysts have presented the various facets of the market with a particular focus on identifying the key industry influencers. The data thus presented is comprehensive, reliable, and the result of extensive research, both primary and secondary.

INFORMATION SOURCES

Primary sources

  • Manufacturers and suppliers
  • Channel partners
  • Industry experts
  • Strategic decision makers

Secondary sources

  • Industry journals and periodicals
  • Government data
  • Financial reports of key industry players
  • Historical data
  • Press releases

DATA ANALYSIS

Data Synthesis

  • Collation of data
  • Estimation of key figures
  • Analysis of derived insights

Data Validation

  • Triangulation with data models
  • Reference against proprietary databases
  • Corroboration with industry experts

REPORT WRITING

Qualitative

  • Market drivers
  • Market challenges
  • Market trends
  • Five forces analysis

Quantitative

  • Market size and forecast
  • Market segmentation
  • Geographical insights
  • Competitive landscape

Interested in this report?

Get your sample now to see our research methodology and insights!

Download Now

Frequently Asked Questions

Laboratory Balances Scales market growth will increase by USD 246.0 million during 2026-2030 .

The Laboratory Balances Scales market is expected to grow at a CAGR of 3.5% during 2026-2030 .

Laboratory Balances Scales market is segmented by Product (Analytical balance, Micro balance, Compact scale, Moisture balance, Others) Capacity (Medium capacity, High capacity, Micro capacity) End-user (Manufacturers, Research and diagnostic lab, Academic institutes)

A and D HOLON HC Ltd., Adam Equipment Inc., Avantor Inc., AXIS, BEL Engineering srl, Cole Parmer, Gibertini Elettronica s.r.l., GRAM GROUP, KERN and SOHN GmbH, METTLER TOLEDO, OHAUS Corp., PCE Holding GmbH, Precisa Gravimetrics AG, Radwag Wagi Elektroniczne, Rice Lake weighing systems, Sartorius AG, Scientific Industries Inc., Setra Systems, Shimadzu Corp., Shinko Denshi Co. Ltd are a few of the key vendors in the Laboratory Balances Scales market.

Asia will register the highest growth rate of 35.7% among the other regions. Therefore, the Laboratory Balances Scales market in Asia is expected to garner significant business opportunities for the vendors during the forecast period.

US, Canada, Mexico, China, India, Japan, South Korea, Indonesia, Thailand, Singapore, Germany, UK, France, The Netherlands, Italy, Spain, Russia, Australia, Brazil, South Africa, UAE, Saudi Arabia, Turkey

  • Integration of internet of things and laboratory automation is the driving factor this market.

The Laboratory Balances Scales market vendors should focus on grabbing business opportunities from the Product segment as it accounted for the largest market share in the base year.