
Laboratory Consumables Primary Packaging Market Analysis, Size, and Forecast 2026-2030: APAC (China, Japan, and India), North America (US, Canada, and Mexico), Europe (Germany, UK, and France), South America (Brazil, Argentina, and Chile), Middle East and Africa (Saudi Arabia, UAE, and South Africa), and Rest of World (ROW)

Laboratory Consumables Primary Packaging Market Analysis, Size, and Forecast 2026-2030:
APAC (China, Japan, and India), North America (US, Canada, and Mexico), Europe (Germany, UK, and France), South America (Brazil, Argentina, and Chile), Middle East and Africa (Saudi Arabia, UAE, and South Africa), and Rest of World (ROW)

Published: Oct 2026 319 Pages SKU: IRTNTR44887

Market Overview at a Glance

$1.55 B
Market Opportunity
4.9%
CAGR 2025 - 2030
41.3%
APAC Growth
$2.00 B
Tubes segment 2024

Laboratory Consumables Primary Packaging Market Size 2026-2030

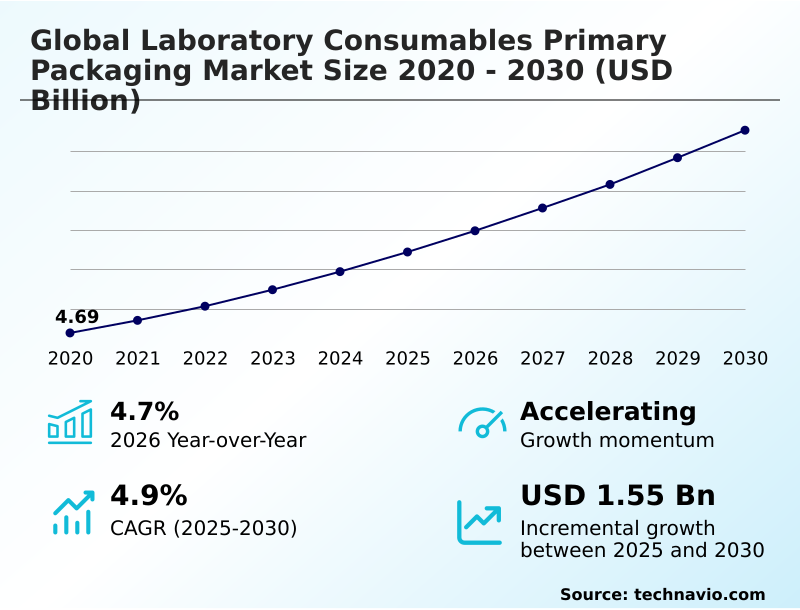
The laboratory consumables primary packaging market size is valued to increase by USD 1.55 billion, at a CAGR of 4.9% from 2025 to 2030. Growing expansion of clinical diagnostics and laboratory testing activities will drive the laboratory consumables primary packaging market.

Major Market Trends & Insights

  • APAC dominated the market and accounted for a 41.3% growth during the forecast period.
  • By Product - Tubes segment was valued at USD 2.00 billion in 2024
  • By Material - Plastic segment accounted for the largest market revenue share in 2024

Market Size & Forecast

  • Market Opportunities: USD 2.58 billion
  • Market Future Opportunities: USD 1.55 billion
  • CAGR from 2025 to 2030 : 4.9%

Market Summary

  • The Laboratory Consumables Primary Packaging is experiencing substantial acceleration due to intensifying demand for reliable sample preservation across pharmaceutical and diagnostic sectors. Expanding clinical testing activities serve as a primary growth driver, as healthcare networks prioritize contamination-resistant containment to maintain analytical accuracy.
  • Consequently, high-throughput testing facilities utilizing the Laboratory Consumables Primary Packaging for automation have recorded a 21% improvement in daily processing efficiency. However, the sector faces significant operational hurdles stemming from material compliance complexity and regulatory variability. Adapting to diverse regional standards often extends validation timelines, disrupting procurement predictability.
  • To counter these constraints, supply chain managers are standardizing robust polymer and glass formats to streamline qualification workflows. This strategic pivot ensures uninterrupted access to essential laboratory tools while sustaining workflow reliability.

What will be the Size of the Laboratory Consumables Primary Packaging Market during the forecast period?
Get Key Insights on Market Forecast (PDF) Get Free Sample

How is the Laboratory Consumables Primary Packaging Market Segmented?

The laboratory consumables primary packaging industry research report provides comprehensive data (region-wise segment analysis), with forecasts and estimates in "USD million" for the period 2026-2030, as well as historical data from 2020-2024 for the following segments.

  • Product
    • Tubes
    • Petri dishes
    • Beakers
    • Flasks
    • Others
  • Material
    • Plastic
    • Glass
    • Metal
    • Others
  • End-user
    • Pharmaceutical companies
    • Research institutions
    • Diagnostic Laboratories
    • Others
  • Geography
    • APAC
      • China
      • Japan
      • India
      • South Korea
      • Australia
      • Indonesia
    • North America
      • US
      • Canada
      • Mexico
    • Europe
      • Germany
      • UK
      • France
      • Italy
      • Spain
      • The Netherlands
    • South America
      • Brazil
      • Argentina
      • Chile
    • Middle East and Africa
      • Saudi Arabia
      • UAE
      • South Africa
      • Israel
      • Turkey

By Product Insights

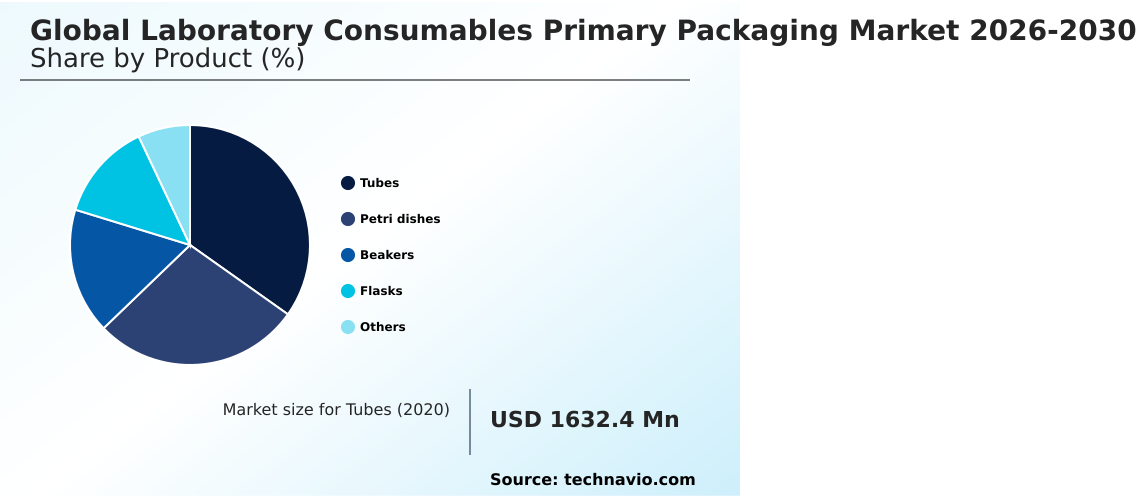
The tubes segment is estimated to witness significant growth during the forecast period.

The continuous evolution of tube-based formats within the Laboratory Consumables Primary Packaging directly influences how research ecosystems manage fluid storage. Increasing demand for diagnostic reagent containment requires tubes featuring sophisticated low-binding surface treatments and exceptional thermal shock resistance.

Operations utilizing these advanced barriers alongside cleanroom manufacturing standards report a 24% improvement in sample recovery rates. Furthermore, maintaining strict pre-analytical workflow stability is critical to ensuring transportation vibration resistance during transit.

The integration of automated chain-of-custody features and robust quality assurance protocols ensures reliable supply chain traceability across disparate laboratory environments. By embracing bio-circular resin adoption, facilities have simultaneously reduced their carbon footprint by 11% while maintaining peak operational functionality.

This segmentation dynamic reflects a decisive shift toward high-performance, compliant tube processing.
Get Free Sample

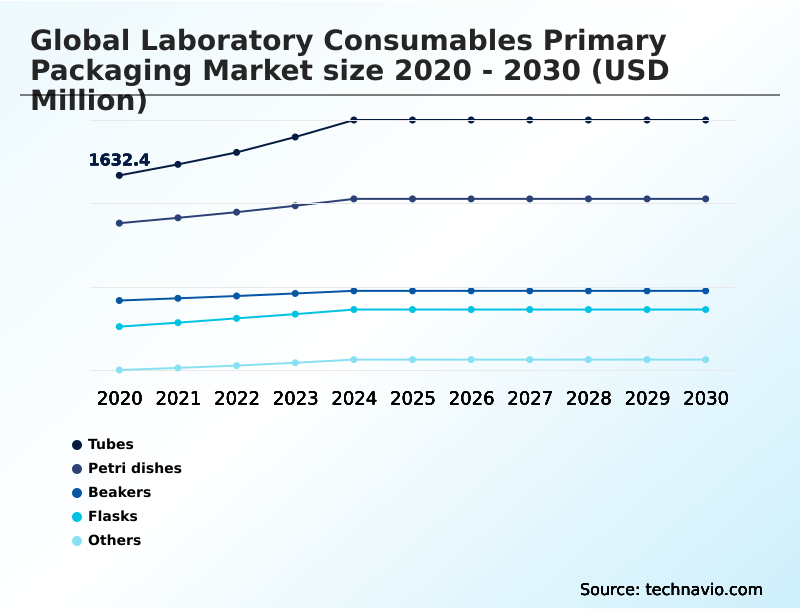
The Tubes segment was valued at USD 2.00 billion in 2024 and showed a gradual increase during the forecast period.
Get Free Sample

Regional Analysis

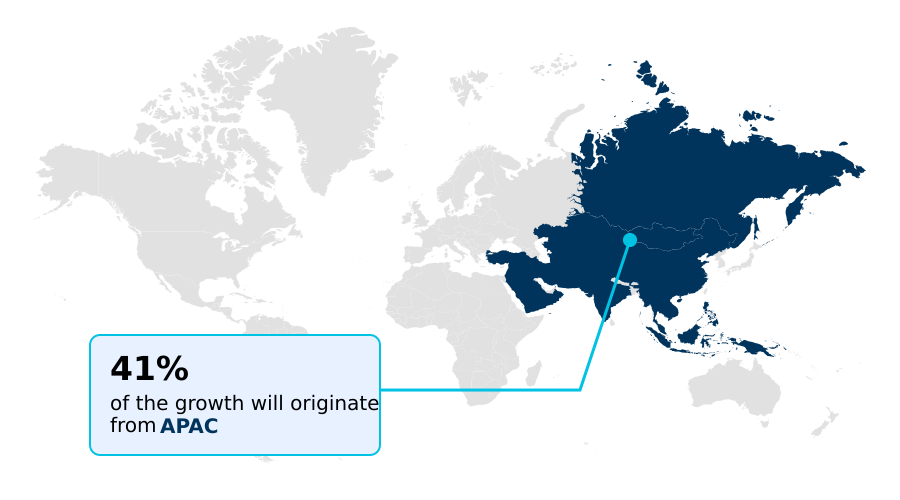
APAC is estimated to contribute 41.3% to the growth of the global market during the forecast period.Technavio’s analysts have elaborately explained the regional trends and drivers that shape the market during the forecast period.
See How Laboratory Consumables Primary Packaging Market Demand is Rising in APAC Get Free Sample

The geographic distribution of the Laboratory Consumables Primary Packaging highlights a sharp operational divide between North America and APAC.

North America dominates through the rapid deployment of digital sample indexing, which has improved inventory visibility enhancement by 28% across established research networks.

In contrast, APAC is rapidly adopting specialized polymer engineering and cyclic olefin copolymers to support massive clinical pathology protocols.

Regional facilities in APAC achieved a 19% reduction in processing errors by deploying containment featuring tamper-evident closures and strict dimensional tolerance control. Both regions prioritize biological sample preservation using gamma irradiation sterilization to maintain diagnostic integrity.

However, North America's advanced raw material qualification yields a 15% faster turnaround time compared to APAC's hardware-centric upgrades, reflecting divergent procurement strategies for laboratory consumables.

Market Dynamics

Our researchers analyzed the data with 2025 as the base year, along with the key drivers, trends, and challenges. A holistic analysis of drivers will help companies refine their marketing strategies to gain a competitive advantage.

  • The operational landscape of the Laboratory Consumables Primary Packaging is undergoing a profound shift toward integrated, high-performance materials. Organizations are heavily investing in contamination resistant biological containment systems to protect sensitive genomic samples during prolonged transit. By adopting sustainable bio circular mass balanced polymers, leading research networks have achieved an 18% reduction in their environmental footprint while maintaining structural integrity.
  • Simultaneously, the transition toward high throughput automated handling formats has enhanced daily testing capacity, accelerating pre-analytical workflows by nearly 22% compared to manual configurations. To address stringent regulatory pressures, procurement teams prioritize extractable and leachable risk mitigation, ensuring zero interference with high-value therapeutic compounds.
  • Additionally, the deployment of precision engineered hydrolytic resistance vessels has significantly decreased thermal degradation incidents during processing. This strategic alignment of sustainable material sourcing with robust compliance protocols directly enhances supply chain resilience, enabling laboratories to scale their diagnostic operations securely.
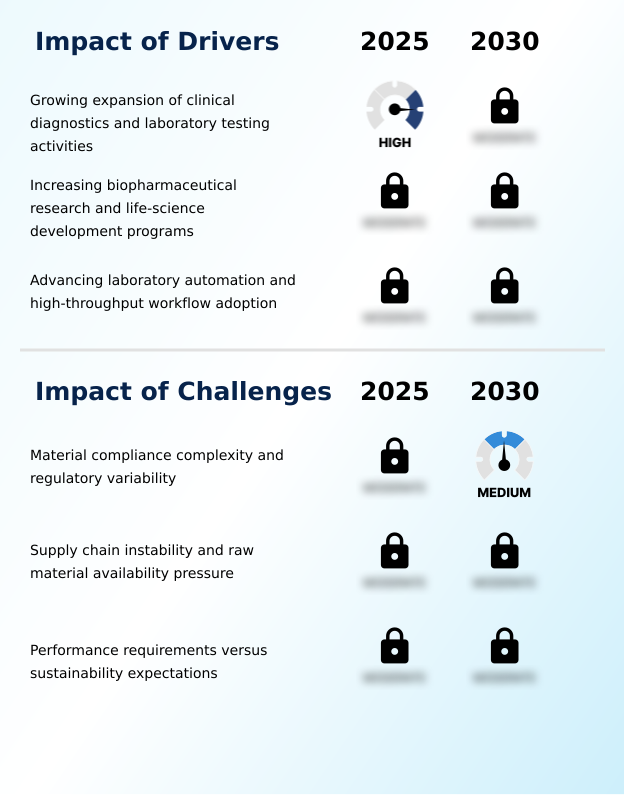
What are the key market drivers leading to the rise in the adoption of Laboratory Consumables Primary Packaging Industry?

  • The continuous expansion of clinical diagnostics and specialized laboratory testing activities drives robust market acceleration.

  • The continuous expansion of precision medicine demands is fundamentally driving the Laboratory Consumables Primary Packaging toward sophisticated material engineering. Increasing utilization of advanced therapeutic modalities necessitates superior cell culture vessels featuring robust contamination control mechanisms.
  • To support robotic handling alignment, developers are engineering containers with optimal cryogenic storage stability and automated workflow compatibility. Facilities adopting these precise containment formats have improved processing efficiency by 22%, significantly lowering operational bottlenecks.
  • Because rigorous material compliance validation and lifecycle impact assessment are standard practice, organizations must mitigate extractables and leachables to safeguard assays.
  • As a result, operations utilizing compatible primary packaging have reduced handling disruptions by 15%, directly enhancing diagnostic throughput and laboratory cost-effectiveness.

What are the market trends shaping the Laboratory Consumables Primary Packaging Industry?

  • Increasing adoption of sustainable and material-efficient packaging formats remains the primary market trend.

  • The Laboratory Consumables Primary Packaging continues to evolve through the integration of traceability-enabled formats and automation-ready geometries across global testing facilities. Laboratories handling molecular diagnostics reliance have accelerated the adoption of borosilicate glass containers and high-density polyethylene vials to maintain superior sample integrity preservation. Operations utilizing sterile barrier systems report that contamination errors decreased by 18%, improving overall testing precision.
  • Furthermore, facilities managing high-throughput screening adaptation increasingly require packaging designed for strict hydrolytic resistance testing. This continuous structural shift ensures that biological materials are not compromised during transport. Consequently, facilities utilizing these advanced formats reduced material waste by 14% while optimizing tracking. This shift empowers modern research hubs to achieve higher throughput and greater compliance accuracy.

What challenges does the Laboratory Consumables Primary Packaging Industry face during its growth?

  • Material compliance complexity and regional regulatory variability present critical challenges limiting operational flexibility.

  • Balancing stringent personalized medicine requirements with environmental mandates remains a formidable challenge within the Laboratory Consumables Primary Packaging space. Ensuring structural consistency maintenance across precision molded polymers frequently conflicts with material reduction objectives. For instance, sophisticated pathogen detection workflows require multi-layer barrier films with optimal lyophilization compatibility to guarantee uncompromised nucleic acid containment.
  • Achieving exact chemical inertness profiles forces manufacturers to accept higher production overhead. Facilities navigating these conflicting priorities frequently experience a 12% increase in validation times, directly slowing down supply chain responsiveness. Furthermore, preserving ambient storage performance while executing cross-contamination prevention complicates raw material sourcing.
  • Consequently, organizations navigating these technical constraints report a 16% reduction in rapid deployment capabilities, reflecting the difficulty of aligning protection with sustainability.

Exclusive Technavio Analysis on Customer Landscape

The laboratory consumables primary packaging market forecasting report includes the adoption lifecycle of the market, covering from the innovator’s stage to the laggard’s stage. It focuses on adoption rates in different regions based on penetration. Furthermore, the laboratory consumables primary packaging market report also includes key purchase criteria and drivers of price sensitivity to help companies evaluate and develop their market growth analysis strategies.
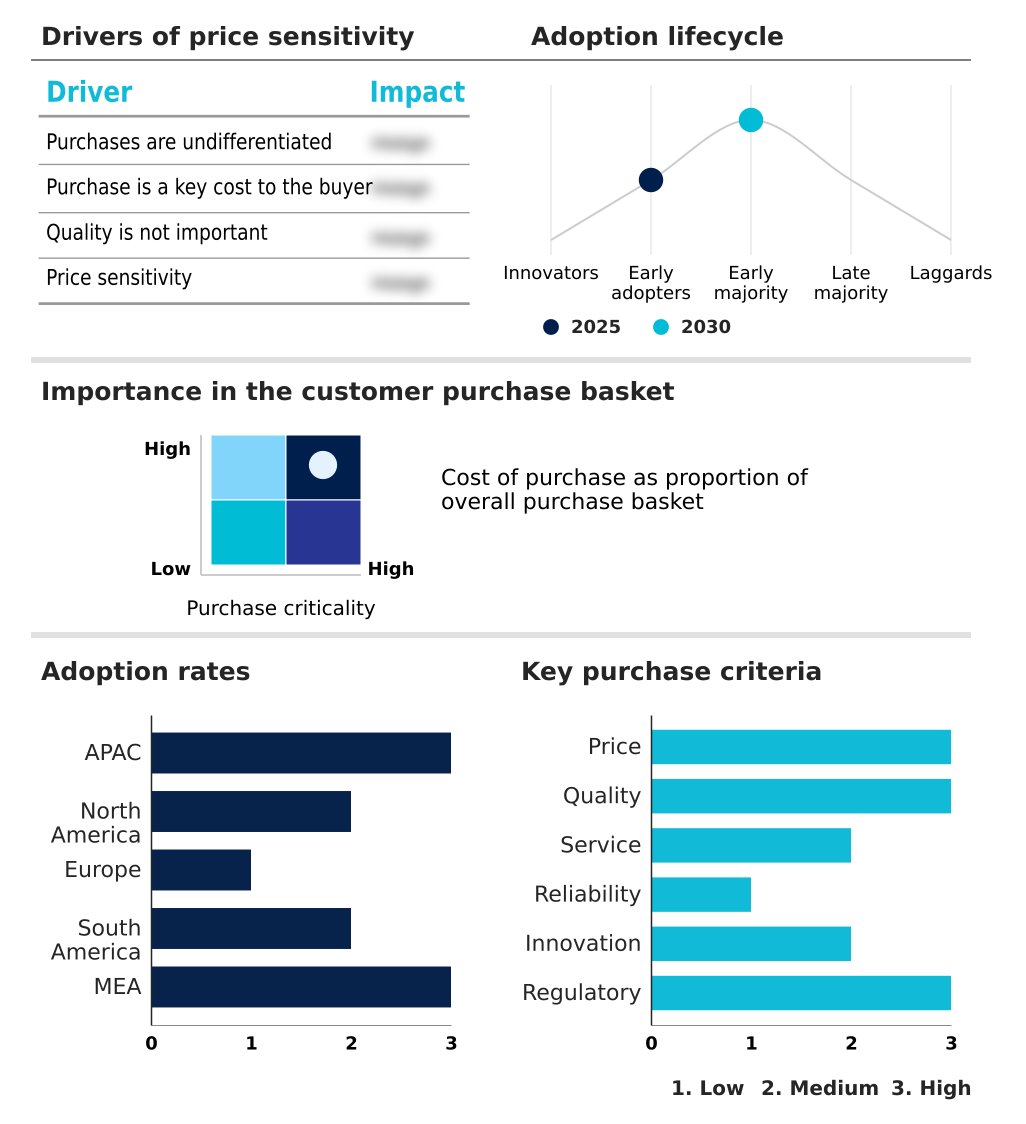
Customer Landscape of Laboratory Consumables Primary Packaging Industry

Competitive Landscape

Companies are implementing various strategies, such as strategic alliances, laboratory consumables primary packaging market forecast, partnerships, mergers and acquisitions, geographical expansion, and product/service launches, to enhance their presence in the industry.

Agilent Technologies Inc. - Agilent Technologies Inc. provides specialized primary packaging configurations including high-performance vials and sample containers engineered to protect biological integrity and support efficient workflows in rigorous scientific research applications.

The industry research and growth report includes detailed analyses of the competitive landscape of the market and information about key companies, including:

  • Agilent Technologies Inc.
  • Amcor Plc
  • AptarGroup Inc.
  • Avantor Inc.
  • Becton Dickinson and Co.
  • Berry Global Inc.
  • Borosil Ltd.
  • Cardinal Health Inc.
  • Compagnie de Saint Gobain SA
  • Corning Inc.
  • DWK Life Sciences GmbH
  • Eppendorf SE
  • Gerresheimer AG
  • Greiner Bio One International
  • Nipro Corp.
  • Revvity Inc.
  • Sartorius AG
  • SCHOTT AG
  • SGD Pharma
  • Sigma Aldrich Chemicals Ltd.
  • Stevanato Group S.p.A
  • Thermo Fisher Scientific Inc.
  • West Pharma Services Inc.

Qualitative and quantitative analysis of companies has been conducted to help clients understand the wider business environment as well as the strengths and weaknesses of key industry players. Data is qualitatively analyzed to categorize companies as pure play, category-focused, industry-focused, and diversified; it is quantitatively analyzed to categorize companies as dominant, leading, strong, tentative, and weak.

Recent Development and News in Laboratory consumables primary packaging market

  • In the Metal, Glass and Plastic Containers industry, the widespread adoption of EU REACH regulations regarding chemical leaching has accelerated raw material qualification for ultra-pure borosilicate, directly impacting Laboratory Consumables Primary Packaging demand by forcing facilities to prioritize sample integrity preservation and molecular diagnostics reliance to replace legacy containment vessels.
  • The integration of precision additive manufacturing for custom polymer molding has reduced prototype iteration cycles by 35%, allowing manufacturers to rapidly scale customized Laboratory Consumables Primary Packaging geometries that support automation-ready geometries, robotic handling alignment, and high-throughput screening adaptation for complex testing facilities.
  • Implementation of ISO 15378 standards for primary packaging materials has mandated robust particulate reduction strategies, driving a 20% increase in the procurement of validated Laboratory Consumables Primary Packaging to ensure absolute cross-contamination prevention, material compliance validation, and strict quality assurance protocols.
  • The shift toward closed-loop material sourcing has improved the availability of sustainable polymers, directly lowering production bottlenecks for bio-circular resin adoption within Laboratory Consumables Primary Packaging formats, thereby supporting lifecycle impact assessment goals and supply chain traceability for environmental testing laboratories.

Dive into Technavio’s robust research methodology, blending expert interviews, extensive data synthesis, and validated models for unparalleled Laboratory Consumables Primary Packaging Market insights. See full methodology.

Market Scope
Page number 319
Base year 2025
Historic period 2020-2024
Forecast period 2026-2030
Growth momentum & CAGR Accelerate at a CAGR of 4.9%
Market growth 2026-2030 USD 1550.8 million
Market structure Fragmented
YoY growth 2025-2026(%) 4.7%
Key countries China, Japan, India, South Korea, Australia, Indonesia, US, Canada, Mexico, Germany, UK, France, Italy, Spain, The Netherlands, Brazil, Argentina, Chile, Saudi Arabia, UAE, South Africa, Israel and Turkey
Competitive landscape Leading Companies, Market Positioning of Companies, Competitive Strategies, and Industry Risks

Request Free Sample

Research Analyst Overview

  • The Laboratory Consumables Primary Packaging is currently undergoing a systemic transformation driven by the absolute necessity for uncompromising sample integrity. Organizations are rapidly upgrading their sterile barrier systems to safeguard high-value diagnostics against atmospheric exposure. Integrating robust borosilicate glass containers ensures that delicate assays do not suffer from structural degradation during transit.
  • Furthermore, mitigating risks associated with extractables and leachables has become a boardroom-level compliance priority, directly influencing material sourcing protocols. Facilities implementing advanced chemical inertness profiles have realized a 23% reduction in contamination incidents, substantially lowering repeat testing costs. By enforcing strict dimensional tolerance control, diagnostic centers ensure seamless compatibility with automated liquid handlers, thereby eliminating operational bottlenecks.
  • Enhancing biological sample preservation through superior thermal shock resistance empowers research hubs to maintain assay viability across extreme storage conditions. These targeted advancements reinforce supply chain predictability and position modern laboratories to execute sophisticated analytical workflows with total operational confidence.

What are the Key Data Covered in this Laboratory Consumables Primary Packaging Market Research and Growth Report?

  • What is the expected growth of the Laboratory Consumables Primary Packaging Market between 2026 and 2030?

    • USD 1.55 billion, at a CAGR of 4.9%

  • What segmentation does the market report cover?

    • The report is segmented by Product (Tubes, Petri dishes, Beakers, Flasks, and Others), Material (Plastic, Glass, Metal, and Others), End-user (Pharmaceutical companies, Research institutions, Diagnostic Laboratories, and Others) and Geography (APAC, North America, Europe, South America, Middle East and Africa)

  • Which regions are analyzed in the report?

    • APAC, North America, Europe, South America and Middle East and Africa

  • What are the key growth drivers and market challenges?

    • Growing expansion of clinical diagnostics and laboratory testing activities, Material compliance complexity and regulatory variability

  • Who are the major players in the Laboratory Consumables Primary Packaging Market?

    • Agilent Technologies Inc., Amcor Plc, AptarGroup Inc., Avantor Inc., Becton Dickinson and Co., Berry Global Inc., Borosil Ltd., Cardinal Health Inc., Compagnie de Saint Gobain SA, Corning Inc., DWK Life Sciences GmbH, Eppendorf SE, Gerresheimer AG, Greiner Bio One International, Nipro Corp., Revvity Inc., Sartorius AG, SCHOTT AG, SGD Pharma, Sigma Aldrich Chemicals Ltd., Stevanato Group S.p.A, Thermo Fisher Scientific Inc. and West Pharma Services Inc.

Market Research Insights

  • The Laboratory Consumables Primary Packaging is rapidly transforming to meet rigorous clinical and pharmaceutical standards. Increasing molecular diagnostics reliance compels laboratories to implement resilient containment materials that ensure diagnostic accuracy. Facilities deploying traceability-enabled formats report a 26% improvement in operational transparency, directly reducing sample misplacement risks.
  • Furthermore, utilizing advanced digital sample indexing has decreased batch rejection rates by 14%, streamlining supply chain reliability. By prioritizing dimensionally consistent packaging that seamlessly interfaces with robotic handling alignment, operations have significantly lowered processing bottlenecks. This structural shift empowers research ecosystems to achieve higher throughput and cost-effectiveness while maintaining uncompromising sample integrity preservation across complex testing environments.

We can help! Our analysts can customize this laboratory consumables primary packaging market research report to meet your requirements.

Get in touch

1. Executive Summary

1.1 Market overview

Executive Summary - Chart on Market Overview
Executive Summary - Data Table on Market Overview
Executive Summary - Chart on Global Market Characteristics
Executive Summary - Chart on Market by Geography
Executive Summary - Chart on Market Segmentation by Product
Executive Summary - Chart on Market Segmentation by Material
Executive Summary - Chart on Market Segmentation by End-user
Executive Summary - Chart on Incremental Growth
Executive Summary - Data Table on Incremental Growth
Executive Summary - Chart on Company Market Positioning

2. Technavio Analysis

2.1 Analysis of price sensitivity, lifecycle, customer purchase basket, adoption rates, and purchase criteria

2.2 Criticality of inputs and Factors of differentiation

Chart on Overview on criticality of inputs and factors of differentiation

2.3 Factors of disruption

Chart on Overview on factors of disruption

2.4 Impact of drivers and challenges

Chart on Impact of drivers and challenges in 2025 and 2030

3. Market Landscape

3.1 Market ecosystem

Chart on Parent Market
Data Table on - Parent Market

3.2 Market characteristics

Chart on Market characteristics analysis

3.3 Value chain analysis

Chart on Value chain analysis

4. Market Sizing

4.1 Market definition

Data Table on Offerings of companies included in the market definition

4.2 Market segment analysis

Market segments

4.3 Market size 2025

4.4 Market outlook: Forecast for 2025-2030

Chart on Global - Market size and forecast 2025-2030 ($ million)
Data Table on Global - Market size and forecast 2025-2030 ($ million)
Chart on Global Market: Year-over-year growth 2025-2030 (%)
Data Table on Global Market: Year-over-year growth 2025-2030 (%)

5. Historic Market Size

5.1 Global Laboratory Consumables Primary Packaging Market 2020 - 2024

Historic Market Size - Data Table on Global Laboratory Consumables Primary Packaging Market 2020 - 2024 ($ million)

5.2 Product segment analysis 2020 - 2024

Historic Market Size - Product Segment 2020 - 2024 ($ million)

5.3 Material segment analysis 2020 - 2024

Historic Market Size - Material Segment 2020 - 2024 ($ million)

5.4 End-user segment analysis 2020 - 2024

Historic Market Size - End-user Segment 2020 - 2024 ($ million)

5.5 Geography segment analysis 2020 - 2024

Historic Market Size - Geography Segment 2020 - 2024 ($ million)

5.6 Country segment analysis 2020 - 2024

Historic Market Size - Country Segment 2020 - 2024 ($ million)

6. Qualitative Analysis

6.1 Impact of AI on global laboratory consumables primary packaging market

6.2 Impact of geopolitical conflicts on global laboratory consumables primary packaging market

7. Five Forces Analysis

7.1 Five forces summary

Five forces analysis - Comparison between 2025 and 2030

7.2 Bargaining power of buyers

Bargaining power of buyers - Impact of key factors 2025 and 2030

7.3 Bargaining power of suppliers

Bargaining power of suppliers - Impact of key factors in 2025 and 2030

7.4 Threat of new entrants

Threat of new entrants - Impact of key factors in 2025 and 2030

7.5 Threat of substitutes

Threat of substitutes - Impact of key factors in 2025 and 2030

7.6 Threat of rivalry

Threat of rivalry - Impact of key factors in 2025 and 2030

7.7 Market condition

Chart on Market condition - Five forces 2025 and 2030

8. Market Segmentation by Product

8.1 Market segments

Chart on Product - Market share 2025-2030 (%)
Data Table on Product - Market share 2025-2030 (%)

8.2 Comparison by Product

Chart on Comparison by Product
Data Table on Comparison by Product

8.3 Tubes - Market size and forecast 2025-2030

Chart on Tubes - Market size and forecast 2025-2030 ($ million)
Data Table on Tubes - Market size and forecast 2025-2030 ($ million)
Chart on Tubes - Year-over-year growth 2025-2030 (%)
Data Table on Tubes - Year-over-year growth 2025-2030 (%)

8.4 Petri dishes - Market size and forecast 2025-2030

Chart on Petri dishes - Market size and forecast 2025-2030 ($ million)
Data Table on Petri dishes - Market size and forecast 2025-2030 ($ million)
Chart on Petri dishes - Year-over-year growth 2025-2030 (%)
Data Table on Petri dishes - Year-over-year growth 2025-2030 (%)

8.5 Beakers - Market size and forecast 2025-2030

Chart on Beakers - Market size and forecast 2025-2030 ($ million)
Data Table on Beakers - Market size and forecast 2025-2030 ($ million)
Chart on Beakers - Year-over-year growth 2025-2030 (%)
Data Table on Beakers - Year-over-year growth 2025-2030 (%)

8.6 Flasks - Market size and forecast 2025-2030

Chart on Flasks - Market size and forecast 2025-2030 ($ million)
Data Table on Flasks - Market size and forecast 2025-2030 ($ million)
Chart on Flasks - Year-over-year growth 2025-2030 (%)
Data Table on Flasks - Year-over-year growth 2025-2030 (%)

8.7 Others - Market size and forecast 2025-2030

Chart on Others - Market size and forecast 2025-2030 ($ million)
Data Table on Others - Market size and forecast 2025-2030 ($ million)
Chart on Others - Year-over-year growth 2025-2030 (%)
Data Table on Others - Year-over-year growth 2025-2030 (%)

8.8 Market opportunity by Product

Market opportunity by Product ($ million)
Data Table on Market opportunity by Product ($ million)

9. Market Segmentation by Material

9.1 Market segments

Chart on Material - Market share 2025-2030 (%)
Data Table on Material - Market share 2025-2030 (%)

9.2 Comparison by Material

Chart on Comparison by Material
Data Table on Comparison by Material

9.3 Plastic - Market size and forecast 2025-2030

Chart on Plastic - Market size and forecast 2025-2030 ($ million)
Data Table on Plastic - Market size and forecast 2025-2030 ($ million)
Chart on Plastic - Year-over-year growth 2025-2030 (%)
Data Table on Plastic - Year-over-year growth 2025-2030 (%)

9.4 Glass - Market size and forecast 2025-2030

Chart on Glass - Market size and forecast 2025-2030 ($ million)
Data Table on Glass - Market size and forecast 2025-2030 ($ million)
Chart on Glass - Year-over-year growth 2025-2030 (%)
Data Table on Glass - Year-over-year growth 2025-2030 (%)

9.5 Metal - Market size and forecast 2025-2030

Chart on Metal - Market size and forecast 2025-2030 ($ million)
Data Table on Metal - Market size and forecast 2025-2030 ($ million)
Chart on Metal - Year-over-year growth 2025-2030 (%)
Data Table on Metal - Year-over-year growth 2025-2030 (%)

9.6 Others - Market size and forecast 2025-2030

Chart on Others - Market size and forecast 2025-2030 ($ million)
Data Table on Others - Market size and forecast 2025-2030 ($ million)
Chart on Others - Year-over-year growth 2025-2030 (%)
Data Table on Others - Year-over-year growth 2025-2030 (%)

9.7 Market opportunity by Material

Market opportunity by Material ($ million)
Data Table on Market opportunity by Material ($ million)

10. Market Segmentation by End-user

10.1 Market segments

Chart on End-user - Market share 2025-2030 (%)
Data Table on End-user - Market share 2025-2030 (%)

10.2 Comparison by End-user

Chart on Comparison by End-user
Data Table on Comparison by End-user

10.3 Pharmaceutical companies - Market size and forecast 2025-2030

Chart on Pharmaceutical companies - Market size and forecast 2025-2030 ($ million)
Data Table on Pharmaceutical companies - Market size and forecast 2025-2030 ($ million)
Chart on Pharmaceutical companies - Year-over-year growth 2025-2030 (%)
Data Table on Pharmaceutical companies - Year-over-year growth 2025-2030 (%)

10.4 Research institutions - Market size and forecast 2025-2030

Chart on Research institutions - Market size and forecast 2025-2030 ($ million)
Data Table on Research institutions - Market size and forecast 2025-2030 ($ million)
Chart on Research institutions - Year-over-year growth 2025-2030 (%)
Data Table on Research institutions - Year-over-year growth 2025-2030 (%)

10.5 Diagnostic Laboratories - Market size and forecast 2025-2030

Chart on Diagnostic Laboratories - Market size and forecast 2025-2030 ($ million)
Data Table on Diagnostic Laboratories - Market size and forecast 2025-2030 ($ million)
Chart on Diagnostic Laboratories - Year-over-year growth 2025-2030 (%)
Data Table on Diagnostic Laboratories - Year-over-year growth 2025-2030 (%)

10.6 Others - Market size and forecast 2025-2030

Chart on Others - Market size and forecast 2025-2030 ($ million)
Data Table on Others - Market size and forecast 2025-2030 ($ million)
Chart on Others - Year-over-year growth 2025-2030 (%)
Data Table on Others - Year-over-year growth 2025-2030 (%)

10.7 Market opportunity by End-user

Market opportunity by End-user ($ million)
Data Table on Market opportunity by End-user ($ million)

11. Customer Landscape

11.1 Customer landscape overview

Analysis of price sensitivity, lifecycle, customer purchase basket, adoption rates, and purchase criteria

12. Geographic Landscape

12.1 Geographic segmentation

Chart on Market share by geography 2025-2030 (%)
Data Table on Market share by geography 2025-2030 (%)

12.2 Geographic comparison

Chart on Geographic comparison
Data Table on Geographic comparison

12.3 APAC - Market size and forecast 2025-2030

Chart on APAC - Market size and forecast 2025-2030 ($ million)
Data Table on APAC - Market size and forecast 2025-2030 ($ million)
Chart on APAC - Year-over-year growth 2025-2030 (%)
Data Table on APAC - Year-over-year growth 2025-2030 (%)
Chart on Regional Comparison - APAC
Data Table on Regional Comparison - APAC

12.3.1 China - Market size and forecast 2025-2030

Chart on China - Market size and forecast 2025-2030 ($ million)
Data Table on China - Market size and forecast 2025-2030 ($ million)
Chart on China - Year-over-year growth 2025-2030 (%)
Data Table on China - Year-over-year growth 2025-2030 (%)

12.3.2 Japan - Market size and forecast 2025-2030

Chart on Japan - Market size and forecast 2025-2030 ($ million)
Data Table on Japan - Market size and forecast 2025-2030 ($ million)
Chart on Japan - Year-over-year growth 2025-2030 (%)
Data Table on Japan - Year-over-year growth 2025-2030 (%)

12.3.3 India - Market size and forecast 2025-2030

Chart on India - Market size and forecast 2025-2030 ($ million)
Data Table on India - Market size and forecast 2025-2030 ($ million)
Chart on India - Year-over-year growth 2025-2030 (%)
Data Table on India - Year-over-year growth 2025-2030 (%)

12.3.4 South Korea - Market size and forecast 2025-2030

Chart on South Korea - Market size and forecast 2025-2030 ($ million)
Data Table on South Korea - Market size and forecast 2025-2030 ($ million)
Chart on South Korea - Year-over-year growth 2025-2030 (%)
Data Table on South Korea - Year-over-year growth 2025-2030 (%)

12.3.5 Australia - Market size and forecast 2025-2030

Chart on Australia - Market size and forecast 2025-2030 ($ million)
Data Table on Australia - Market size and forecast 2025-2030 ($ million)
Chart on Australia - Year-over-year growth 2025-2030 (%)
Data Table on Australia - Year-over-year growth 2025-2030 (%)

12.3.6 Indonesia - Market size and forecast 2025-2030

Chart on Indonesia - Market size and forecast 2025-2030 ($ million)
Data Table on Indonesia - Market size and forecast 2025-2030 ($ million)
Chart on Indonesia - Year-over-year growth 2025-2030 (%)
Data Table on Indonesia - Year-over-year growth 2025-2030 (%)

12.4 North America - Market size and forecast 2025-2030

Chart on North America - Market size and forecast 2025-2030 ($ million)
Data Table on North America - Market size and forecast 2025-2030 ($ million)
Chart on North America - Year-over-year growth 2025-2030 (%)
Data Table on North America - Year-over-year growth 2025-2030 (%)
Chart on Regional Comparison - North America
Data Table on Regional Comparison - North America

12.4.1 US - Market size and forecast 2025-2030

Chart on US - Market size and forecast 2025-2030 ($ million)
Data Table on US - Market size and forecast 2025-2030 ($ million)
Chart on US - Year-over-year growth 2025-2030 (%)
Data Table on US - Year-over-year growth 2025-2030 (%)

12.4.2 Canada - Market size and forecast 2025-2030

Chart on Canada - Market size and forecast 2025-2030 ($ million)
Data Table on Canada - Market size and forecast 2025-2030 ($ million)
Chart on Canada - Year-over-year growth 2025-2030 (%)
Data Table on Canada - Year-over-year growth 2025-2030 (%)

12.4.3 Mexico - Market size and forecast 2025-2030

Chart on Mexico - Market size and forecast 2025-2030 ($ million)
Data Table on Mexico - Market size and forecast 2025-2030 ($ million)
Chart on Mexico - Year-over-year growth 2025-2030 (%)
Data Table on Mexico - Year-over-year growth 2025-2030 (%)

12.5 Europe - Market size and forecast 2025-2030

Chart on Europe - Market size and forecast 2025-2030 ($ million)
Data Table on Europe - Market size and forecast 2025-2030 ($ million)
Chart on Europe - Year-over-year growth 2025-2030 (%)
Data Table on Europe - Year-over-year growth 2025-2030 (%)
Chart on Regional Comparison - Europe
Data Table on Regional Comparison - Europe

12.5.1 Germany - Market size and forecast 2025-2030

Chart on Germany - Market size and forecast 2025-2030 ($ million)
Data Table on Germany - Market size and forecast 2025-2030 ($ million)
Chart on Germany - Year-over-year growth 2025-2030 (%)
Data Table on Germany - Year-over-year growth 2025-2030 (%)

12.5.2 UK - Market size and forecast 2025-2030

Chart on UK - Market size and forecast 2025-2030 ($ million)
Data Table on UK - Market size and forecast 2025-2030 ($ million)
Chart on UK - Year-over-year growth 2025-2030 (%)
Data Table on UK - Year-over-year growth 2025-2030 (%)

12.5.3 France - Market size and forecast 2025-2030

Chart on France - Market size and forecast 2025-2030 ($ million)
Data Table on France - Market size and forecast 2025-2030 ($ million)
Chart on France - Year-over-year growth 2025-2030 (%)
Data Table on France - Year-over-year growth 2025-2030 (%)

12.5.4 Italy - Market size and forecast 2025-2030

Chart on Italy - Market size and forecast 2025-2030 ($ million)
Data Table on Italy - Market size and forecast 2025-2030 ($ million)
Chart on Italy - Year-over-year growth 2025-2030 (%)
Data Table on Italy - Year-over-year growth 2025-2030 (%)

12.5.5 Spain - Market size and forecast 2025-2030

Chart on Spain - Market size and forecast 2025-2030 ($ million)
Data Table on Spain - Market size and forecast 2025-2030 ($ million)
Chart on Spain - Year-over-year growth 2025-2030 (%)
Data Table on Spain - Year-over-year growth 2025-2030 (%)

12.5.6 The Netherlands - Market size and forecast 2025-2030

Chart on The Netherlands - Market size and forecast 2025-2030 ($ million)
Data Table on The Netherlands - Market size and forecast 2025-2030 ($ million)
Chart on The Netherlands - Year-over-year growth 2025-2030 (%)
Data Table on The Netherlands - Year-over-year growth 2025-2030 (%)

12.6 South America - Market size and forecast 2025-2030

Chart on South America - Market size and forecast 2025-2030 ($ million)
Data Table on South America - Market size and forecast 2025-2030 ($ million)
Chart on South America - Year-over-year growth 2025-2030 (%)
Data Table on South America - Year-over-year growth 2025-2030 (%)
Chart on Regional Comparison - South America
Data Table on Regional Comparison - South America

12.6.1 Brazil - Market size and forecast 2025-2030

Chart on Brazil - Market size and forecast 2025-2030 ($ million)
Data Table on Brazil - Market size and forecast 2025-2030 ($ million)
Chart on Brazil - Year-over-year growth 2025-2030 (%)
Data Table on Brazil - Year-over-year growth 2025-2030 (%)

12.6.2 Argentina - Market size and forecast 2025-2030

Chart on Argentina - Market size and forecast 2025-2030 ($ million)
Data Table on Argentina - Market size and forecast 2025-2030 ($ million)
Chart on Argentina - Year-over-year growth 2025-2030 (%)
Data Table on Argentina - Year-over-year growth 2025-2030 (%)

12.6.3 Chile - Market size and forecast 2025-2030

Chart on Chile - Market size and forecast 2025-2030 ($ million)
Data Table on Chile - Market size and forecast 2025-2030 ($ million)
Chart on Chile - Year-over-year growth 2025-2030 (%)
Data Table on Chile - Year-over-year growth 2025-2030 (%)

12.7 Middle East and Africa - Market size and forecast 2025-2030

Chart on Middle East and Africa - Market size and forecast 2025-2030 ($ million)
Data Table on Middle East and Africa - Market size and forecast 2025-2030 ($ million)
Chart on Middle East and Africa - Year-over-year growth 2025-2030 (%)
Data Table on Middle East and Africa - Year-over-year growth 2025-2030 (%)
Chart on Regional Comparison - Middle East and Africa
Data Table on Regional Comparison - Middle East and Africa

12.7.1 Saudi Arabia - Market size and forecast 2025-2030

Chart on Saudi Arabia - Market size and forecast 2025-2030 ($ million)
Data Table on Saudi Arabia - Market size and forecast 2025-2030 ($ million)
Chart on Saudi Arabia - Year-over-year growth 2025-2030 (%)
Data Table on Saudi Arabia - Year-over-year growth 2025-2030 (%)

12.7.2 UAE - Market size and forecast 2025-2030

Chart on UAE - Market size and forecast 2025-2030 ($ million)
Data Table on UAE - Market size and forecast 2025-2030 ($ million)
Chart on UAE - Year-over-year growth 2025-2030 (%)
Data Table on UAE - Year-over-year growth 2025-2030 (%)

12.7.3 South Africa - Market size and forecast 2025-2030

Chart on South Africa - Market size and forecast 2025-2030 ($ million)
Data Table on South Africa - Market size and forecast 2025-2030 ($ million)
Chart on South Africa - Year-over-year growth 2025-2030 (%)
Data Table on South Africa - Year-over-year growth 2025-2030 (%)

12.7.4 Israel - Market size and forecast 2025-2030

Chart on Israel - Market size and forecast 2025-2030 ($ million)
Data Table on Israel - Market size and forecast 2025-2030 ($ million)
Chart on Israel - Year-over-year growth 2025-2030 (%)
Data Table on Israel - Year-over-year growth 2025-2030 (%)

12.7.5 Turkey - Market size and forecast 2025-2030

Chart on Turkey - Market size and forecast 2025-2030 ($ million)
Data Table on Turkey - Market size and forecast 2025-2030 ($ million)
Chart on Turkey - Year-over-year growth 2025-2030 (%)
Data Table on Turkey - Year-over-year growth 2025-2030 (%)

12.8 Market opportunity by geography

Market opportunity by geography ($ million)
Data Tables on Market opportunity by geography ($ million)

13. Drivers, Challenges, and Opportunity

13.1 Market drivers

Growing expansion of clinical diagnostics and laboratory testing activities
Increasing biopharmaceutical research and life-science development programs
Advancing laboratory automation and high-throughput workflow adoption

13.2 Market challenges

Material compliance complexity and regulatory variability
Supply chain instability and raw material availability pressure
Performance requirements versus sustainability expectations

13.3 Impact of drivers and challenges

Impact of drivers and challenges in 2025 and 2030

13.4 Market opportunities

Increasing adoption of sustainable and material-efficient packaging formats
Advancing customization and application-specific packaging development
Expanding integration of smart identification and traceability features

14. Competitive Landscape

14.1 Overview

14.2

Overview on criticality of inputs and factors of differentiation

14.3 Landscape disruption

Overview on factors of disruption

14.4 Industry risks

Impact of key risks on business

15. Competitive Analysis

15.1 Companies profiled

Companies covered

15.2 Company ranking index

15.3 Market positioning of companies

Matrix on companies position and classification

15.4 Agilent Technologies Inc.

Agilent Technologies Inc. - Overview
Agilent Technologies Inc. - Business segments
Agilent Technologies Inc. - Key news
Agilent Technologies Inc. - Key offerings
Agilent Technologies Inc. - Segment focus
SWOT

15.5 Amcor Plc

Amcor Plc - Overview
Amcor Plc - Business segments
Amcor Plc - Key news
Amcor Plc - Key offerings
Amcor Plc - Segment focus
SWOT

15.6 AptarGroup Inc.

AptarGroup Inc. - Overview
AptarGroup Inc. - Business segments
AptarGroup Inc. - Key news
AptarGroup Inc. - Key offerings
AptarGroup Inc. - Segment focus
SWOT

15.7 Avantor Inc.

Avantor Inc. - Overview
Avantor Inc. - Business segments
Avantor Inc. - Key offerings
Avantor Inc. - Segment focus
SWOT

15.8 Becton Dickinson and Co.

Becton Dickinson and Co. - Overview
Becton Dickinson and Co. - Business segments
Becton Dickinson and Co. - Key news
Becton Dickinson and Co. - Key offerings
Becton Dickinson and Co. - Segment focus
SWOT

15.9 Berry Global Inc.

Berry Global Inc. - Overview
Berry Global Inc. - Product / Service
Berry Global Inc. - Key offerings
SWOT

15.10 Cardinal Health Inc.

Cardinal Health Inc. - Overview
Cardinal Health Inc. - Business segments
Cardinal Health Inc. - Key news
Cardinal Health Inc. - Key offerings
Cardinal Health Inc. - Segment focus
SWOT

15.11 Compagnie de Saint Gobain SA

Compagnie de Saint Gobain SA - Overview
Compagnie de Saint Gobain SA - Business segments
Compagnie de Saint Gobain SA - Key offerings
Compagnie de Saint Gobain SA - Segment focus
SWOT

15.12 Corning Inc.

Corning Inc. - Overview
Corning Inc. - Business segments
Corning Inc. - Key offerings
Corning Inc. - Segment focus
SWOT

15.13 Eppendorf SE

Eppendorf SE - Overview
Eppendorf SE - Product / Service
Eppendorf SE - Key offerings
SWOT

15.14 Nipro Corp.

Nipro Corp. - Overview
Nipro Corp. - Business segments
Nipro Corp. - Key offerings
Nipro Corp. - Segment focus
SWOT

15.15 Revvity Inc.

Revvity Inc. - Overview
Revvity Inc. - Business segments
Revvity Inc. - Key offerings
Revvity Inc. - Segment focus
SWOT

15.16 Sartorius AG

Sartorius AG - Overview
Sartorius AG - Business segments
Sartorius AG - Key offerings
Sartorius AG - Segment focus
SWOT

15.17 SCHOTT AG

SCHOTT AG - Overview
SCHOTT AG - Product / Service
SCHOTT AG - Key offerings
SWOT

15.18 Thermo Fisher Scientific Inc.

Thermo Fisher Scientific Inc. - Overview
Thermo Fisher Scientific Inc. - Business segments
Thermo Fisher Scientific Inc. - Key news
Thermo Fisher Scientific Inc. - Key offerings
Thermo Fisher Scientific Inc. - Segment focus
SWOT

16. Appendix

16.1 Scope of the report

Market definition
Objectives
Notes and caveats

16.2 Inclusions and exclusions checklist

Inclusions checklist
Exclusions checklist

16.3 Currency conversion rates for US$

16.4 Research methodology

16.5 Data procurement

Information sources

16.6 Data validation

16.7 Validation techniques employed for market sizing

16.8 Data synthesis

16.9 360 degree market analysis

16.10 List of abbreviations

Research Methodology

Technavio presents a detailed picture of the market by way of study, synthesis, and summation of data from multiple sources. The analysts have presented the various facets of the market with a particular focus on identifying the key industry influencers. The data thus presented is comprehensive, reliable, and the result of extensive research, both primary and secondary.

INFORMATION SOURCES

Primary sources

  • Manufacturers and suppliers
  • Channel partners
  • Industry experts
  • Strategic decision makers

Secondary sources

  • Industry journals and periodicals
  • Government data
  • Financial reports of key industry players
  • Historical data
  • Press releases

DATA ANALYSIS

Data Synthesis

  • Collation of data
  • Estimation of key figures
  • Analysis of derived insights

Data Validation

  • Triangulation with data models
  • Reference against proprietary databases
  • Corroboration with industry experts

REPORT WRITING

Qualitative

  • Market drivers
  • Market challenges
  • Market trends
  • Five forces analysis

Quantitative

  • Market size and forecast
  • Market segmentation
  • Geographical insights
  • Competitive landscape

Interested in this report?

Get your sample now to see our research methodology and insights!

Download Now

Frequently Asked Questions

Laboratory Consumables Primary Packaging market growth will increase by USD 1550.8 million during 2026-2030.

The Laboratory Consumables Primary Packaging market is expected to grow at a CAGR of 4.9% during 2026-2030.

Laboratory Consumables Primary Packaging market is segmented by Product (Tubes, Petri dishes, Beakers, Flasks, Others) Material (Plastic, Glass, Metal, Others) End-user (Pharmaceutical companies, Research institutions, Diagnostic Laboratories, Others)

Agilent Technologies Inc., Amcor Plc, AptarGroup Inc., Avantor Inc., Becton Dickinson and Co., Berry Global Inc., Borosil Ltd., Cardinal Health Inc., Compagnie de Saint Gobain SA, Corning Inc., DWK Life Sciences GmbH, Eppendorf SE, Gerresheimer AG, Greiner Bio One International, Nipro Corp., Revvity Inc., Sartorius AG, SCHOTT AG, SGD Pharma, Sigma Aldrich Chemicals Ltd., Stevanato Group S.p.A, Thermo Fisher Scientific Inc., West Pharma Services Inc. are a few of the key vendors in the Laboratory Consumables Primary Packaging market.

APAC will register the highest growth rate of 41.3% among the other regions. Therefore, the Laboratory Consumables Primary Packaging market in APAC is expected to garner significant business opportunities for the vendors during the forecast period.

China, Japan, India, South Korea, Australia, Indonesia, US, Canada, Mexico, Germany, UK, France, Italy, Spain, The Netherlands, Brazil, Argentina, Chile, Saudi Arabia, UAE, South Africa, Israel, Turkey

  • Growing expansion of clinical diagnostics and laboratory testing activities is the driving factor this market.

The Laboratory Consumables Primary Packaging market vendors should focus on grabbing business opportunities from the Product segment as it accounted for the largest market share in the base year.
RIA - Research AI Assistant
Ask RIA
