Landing String Equipment Market Analysis APAC, Middle East and Africa, Europe, North America, South America - US, Saudi Arabia, China, Germany, UK - Size and Forecast 2024-2028

Landing String Equipment Market Analysis APAC, Middle East and Africa, Europe, North America, South America - US, Saudi Arabia, China, Germany, UK - Size and Forecast 2024-2028

Published: Oct 2023 166 Pages SKU: IRTNTR46638

Market Overview at a Glance

$424.91 Mn
Market Opportunity
7.06%
CAGR
6.7
YoY growth 2023-2024(%)

Landing String Equipment Market Size 2024-2028

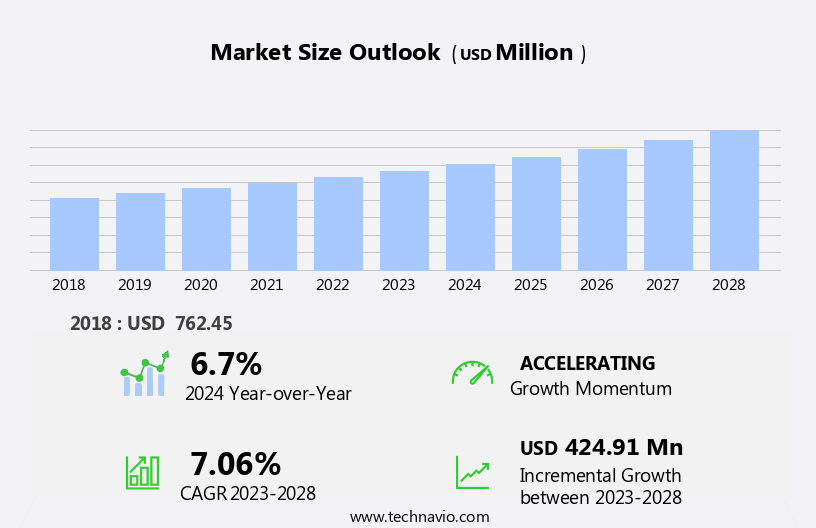
The landing string equipment market size is forecast to increase by USD 424.91 million at a CAGR of 7.06% between 2023 and 2028.

  • The market is experiencing significant growth, driven primarily by the increasing deep-water and ultra-deepwater Exploration and Production (E and P) activities. The demand for landing string equipment is surging due to the complexities involved in drilling and completing wells in deeper waters. Moreover, advancements in landing string control systems are enhancing operational efficiency and safety, making them an indispensable component of offshore drilling operations. Another key trend shaping the market is the rise of renewable energy. As the world shifts towards sustainable energy sources, the demand for equipment used in offshore wind energy projects is expected to increase.
  • Landing strings, which are essential components of wind turbine foundations, are expected to see significant demand in this sector. However, the market is not without challenges. The high capital investment required for the development and deployment of landing string technology, coupled with the volatile nature of oil prices, poses a significant challenge to market growth. Companies seeking to capitalize on the opportunities in this market must focus on cost reduction strategies, technological innovation, and strategic partnerships to navigate these challenges effectively.

What will be the Size of the Landing String Equipment Market during the forecast period?

Landing String Equipment Market Size

 Request Free Sample

  • The market in the US exhibits growth, driven by the increasing demand for crude oil and natural gas, particularly from shale formations and deepwater reserves. This market encompasses drill and completion strings, subsea wellheads, and related equipment used in deepwater drilling, subsea processing, and well intervention activities. Key factors fueling growth include the expansion of shale gas production in the US, the ongoing development of shallow and ultradeep water resources, and the rising consumption of crude oil and fuel demand. Additionally, the market is influenced by trends such as the construction and maintenance of offshore rigs, the increasing use of floating vessels for drilling in challenging environments, and the growing adoption of renewable resources for energy production.
  • Despite these opportunities, market growth may be hindered by adverse weather conditions and limited deck space on offshore rigs. Overall, the market is poised for continued expansion, driven by the dynamic interplay of oil demand, drilling activities, and technological innovation.

How is this Landing String Equipment Industry segmented?

The landing string equipment industry research report provides comprehensive data (region-wise segment analysis), with forecasts and estimates in "USD million" for the period 2024-2028, as well as historical data from 2018-2022 for the following segments.

  • Type
    • Equipment
    • Services
  • End-user
    • Deepwater
    • Ultra-deepwater
    • Shallow water
  • Geography
    • APAC
      • China
    • Middle East and Africa
      • Europe
        • Germany
        • UK
      • North America
        • US
      • South America

      By Type Insights

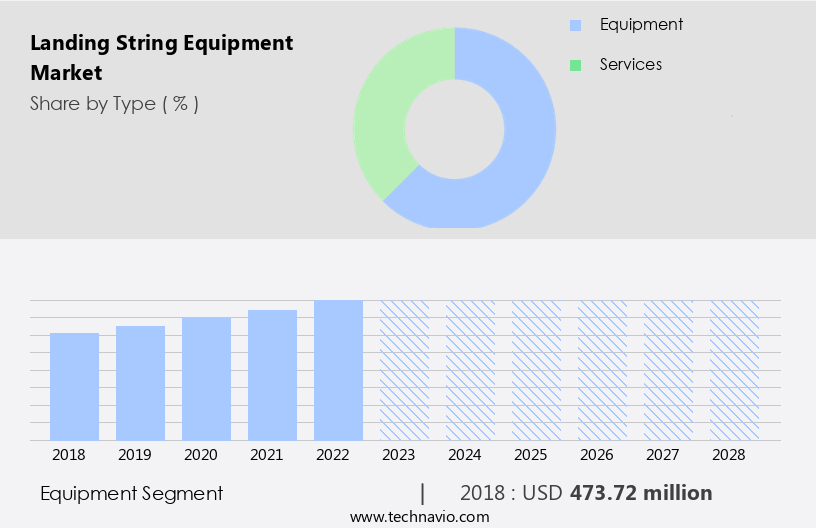
      The equipment segment is estimated to witness significant growth during the forecast period.

      The market encompasses various tools utilized in the construction and maintenance of landing strings, a crucial component in oil and gas industry well-completion and production processes. Landing strings, also known as completion strings, facilitate the transfer of fluids between the wellbore and the surface. Two essential components of landing strings are Tubing Hangers and Tubing Head Adapters. Tubing Hangers serve to seal off the wellhead from the tubing string, enabling the production or injection of fluids. They regulate flow through the wellbore and support the tubing string. Tubing Head Adapters facilitate the installation and removal of the landing string by joining the tubing hangers to the wellhead.

      Factors influencing the market include elevator capacity requirements, adverse weather conditions, oil demand, and drilling activities in deepwater, deepwater drilling, and offshore rigs. The equipment segment includes drill pipes, completion strings, and other tools used in subsea processing and well intervention. In offshore drilling projects, floating vessels are employed in UltraDeep Water drilling, while oil consumption and fuel demand are essential considerations. The market is driven by the need for efficient and reliable landing string equipment in various applications, including subsea wells and offshore oil rigs.

      Landing String Equipment Market Size

      Get a glance at the market report of share of various segments Request Free Sample

      The Equipment segment was valued at USD 473.72 million in 2018 and showed a gradual increase during the forecast period.

      Regional Analysis

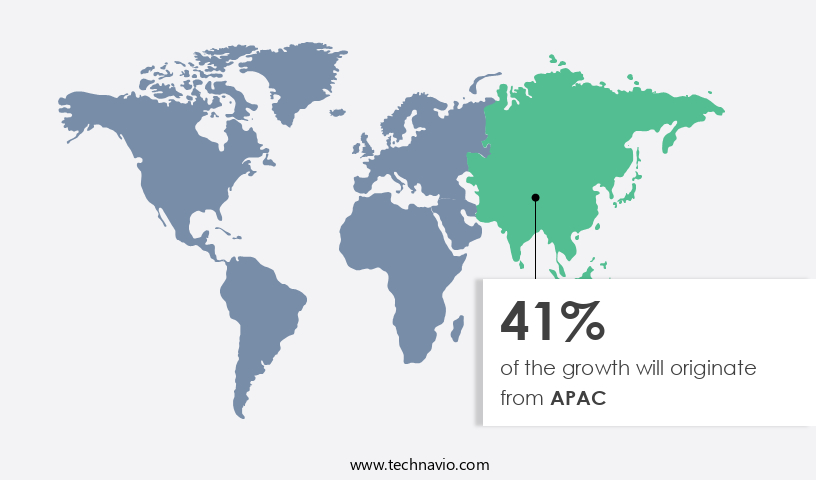
      APAC is estimated to contribute 41% to the growth of the global market during the forecast period.Technavio’s analysts have elaborately explained the regional trends and drivers that shape the market during the forecast period.

      Landing String Equipment Market Share by Geography

      For more insights on the market size of various regions, Request Free Sample

      The market in the Asia Pacific region is experiencing significant growth due to the increasing number of deep-water and ultra-deepwater oil and gas projects in countries like China, Australia, and several Southeast Asian nations. The International Energy Administration (IEA) reports that global oil demand has reached an all-time high, driven by factors such as increased summer air travel, higher oil consumption in power generation, and surging petrochemical activity in China. According to the IEA, global oil demand is projected to rise by 2.2 million barrels per day to 102.2 million barrels per day in 2023, with China contributing over 70% of the increase.

      In August 2023, Transocean's Dhirubhai Deep-water KG1 drillship received a binding notification of award from Oil and Natural Gas Corporation (ONGC) for a drilling assignment offshore India. Adverse weather conditions and the need for finishing and manufacturing of drilling and completion strings, as well as construction and maintenance of offshore rigs and subsea wellheads, further fuel the demand for landing string equipment in deep-water and offshore drilling activities. The oil industry's focus on subsea processing, deepwater drilling, and the use of floating vessels for crude oil production also contributes to the market's growth.

      Market Dynamics

      Our researchers analyzed the data with 2023 as the base year, along with the key drivers, trends, and challenges. A holistic analysis of drivers will help companies refine their marketing strategies to gain a competitive advantage.

      What are the key market drivers leading to the rise in the adoption of Landing String Equipment Industry?

      • Rise in deep-water and ultra-deepwater E and P activities is the key driver of the market. 

      • Offshore oil and gas exploration and production (E&P) have gained significant importance due to the vast reserves of deep-water and ultra-deepwater resources. Upstream oil and gas companies have been extracting resources from offshore wells for several decades, transitioning from shallow waters to more challenging deep-water and ultra-deepwater environments. The production of oil in subsea conditions is more expensive than conventional methods, necessitating advanced technologies and techniques. The harsh offshore environment poses unique challenges to drilling operations, making it a more complex process than onshore drilling. According to the US Energy Information Administration (EIA), global offshore deep-water oil production is projected to grow by 2% annually between 2021 and 2026.
      • This growth can be attributed to the increasing demand for oil and gas, advancements in technology, and the exploration of untapped deep-water reserves. Despite the challenges, offshore E&P remains a lucrative industry, offering substantial returns for companies that can navigate the complexities of deep-water drilling. The market dynamics of offshore E&P are influenced by various factors, including technological advancements, regulatory frameworks, and geopolitical risks. Companies must carefully evaluate these factors to ensure the success of their offshore E&P projects.

      What are the market trends shaping the Landing String Equipment Industry?

      • Growing advances in landing string control systems is the upcoming market trend. 

      • Landing string systems have gained significant traction in the oil and gas industry as an essential safety solution for subsea well interventions and completions. These systems interface with the subsea wellhead on the seabed, enabling operations from floating vessels with enhanced safety. reveals advancements in landing string technology, optimizing their usage in subsea wells. The landing string system incorporates a subsea test tree within a blow-out preventer. This test tree comprises large bore hydraulically operated valves, offering improved well control and sealing and cutting capabilities. In emergencies such as adverse weather conditions and drive-off scenarios, these features enable quick shut-in of the well and vessel disconnection, ensuring safety and efficiency.
      • Landing string systems play a crucial role in ensuring the successful execution of subsea drilling and production activities. Their ability to provide reliable well control and sealing capabilities, even in challenging conditions, makes them indispensable in the oil and gas industry.

      What challenges does the Landing String Equipment Industry face during its growth?

      • Rise of renewable energy is a key challenge affecting the industry growth. 

      • The market is experiencing significant shifts due to the increasing adoption of renewable energy sources. Renewable energy, including solar and wind power, is gaining popularity for its environmental benefits and government support. This transition from traditional fossil fuel-based power generation to cleaner, sustainable options has resulted in a growing demand for landing string equipment that can be utilized with renewable energy systems. Landing string equipment plays a crucial role in the construction and operation of offshore renewable energy installations, such as wind turbines and floating solar panels.
      • However, The market faces challenges in catering to the unique requirements of renewable energy projects. As the energy sector continues to evolve, it is essential for market participants to stay informed and adapt to these changing market dynamics.

      Exclusive Customer Landscape

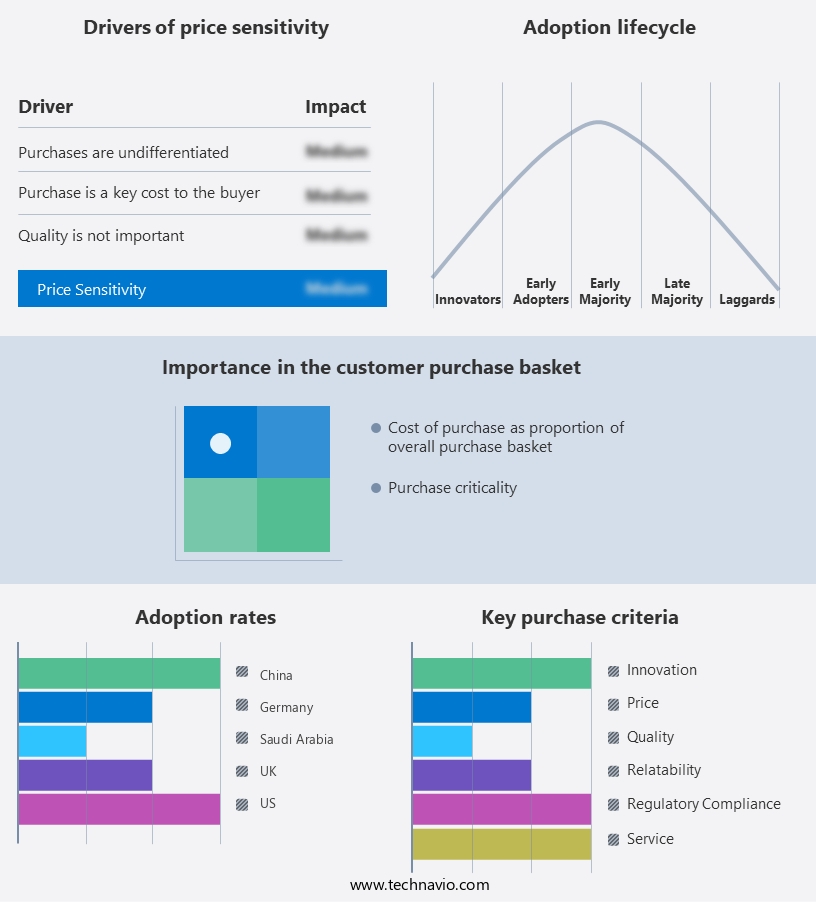
      The landing string equipment market forecasting report includes the adoption lifecycle of the market, covering from the innovator’s stage to the laggard’s stage. It focuses on adoption rates in different regions based on penetration. Furthermore, the landing string equipment market report also includes key purchase criteria and drivers of price sensitivity to help companies evaluate and develop their market growth analysis strategies.

      Landing String Equipment Market Share by Geography

       Customer Landscape

      Key Companies & Market Insights

      Companies are implementing various strategies, such as strategic alliances, landing string equipment market forecast, partnerships, mergers and acquisitions, geographical expansion, and product/service launches, to enhance their presence in the industry.

      Aker Solutions ASA - The company specializes in supplying advanced landing string equipment for oil and gas drilling applications. Equipped with a Subsea Test Tree, Retainer Valve, and Lubricator Valve, these solutions cater to the most challenging drilling environments. Designed for superior functionality and durability, these components ensure efficient drilling operations and enhanced safety standards.

      The industry research and growth report includes detailed analyses of the competitive landscape of the market and information about key companies, including:

      • Aker Solutions ASA
      • Drilltech Services North Sea Ltd.
      • ExPert E and P Co. LLC
      • Expro Group Holdings NV
      • Halliburton Co.
      • Interventek Subsea Engineering Ltd.
      • NOV Inc.
      • Quail Tools LP
      • Schlumberger Ltd.
      • Superior Energy Services Inc.
      • TechnipFMC plc
      • Vallourec SA
      • WellPartner AS
      • Yantai Enerserva Machinery Co. Ltd.

      Qualitative and quantitative analysis of companies has been conducted to help clients understand the wider business environment as well as the strengths and weaknesses of key industry players. Data is qualitatively analyzed to categorize companies as pure play, category-focused, industry-focused, and diversified; it is quantitatively analyzed to categorize companies as dominant, leading, strong, tentative, and weak.

      Research Analyst Overview

      The market plays a crucial role in the oil and gas industry, particularly in offshore drilling operations. This market encompasses a range of components designed to facilitate the safe and efficient deployment and retrieval of drilling strings and completion tools in challenging deepwater environments. Renewable resources have gained significant attention in recent years, leading to a shift in focus away from traditional fossil fuels. However, the demand for crude oil continues to be , driven by industrial processes and fuel demand. Adverse weather conditions and the increasing trend towards deeper drilling in ultradeep water have necessitated advancements in landing string technology.

      Finishing and manufacturing processes have undergone significant improvements to enhance the durability and performance of landing strings. These strings are essential components of drill pipes, which enable the transfer of drilling fluid and the transmission of drilling parameters between the rig and the seabed. Deepwater drilling projects in offshore rigs require specialized landing control systems to ensure the safe and efficient deployment and retrieval of drill strings. These systems are critical for well intervention and well control, which are essential for maintaining production from subsea wells. Construction and maintenance activities associated with offshore drilling projects necessitate the use of landing strings.

      These strings are also used in drilling activities in shallow water, where the seabed may not be as stable as in deeper waters. The use of floating vessels for offshore drilling has increased in recent years, leading to an increased demand for landing string equipment. Subsea processing and completion strings are essential components of these operations, as they enable the processing of crude oil and natural gas at the seabed before it is transported to the surface. The deepwater drilling market is expected to grow significantly in the coming years, driven by the increasing demand for crude oil and the availability of new technologies that enable drilling in ultradeep water.

      The equipment segment, which includes landing strings, is expected to benefit from this growth. Adverse weather conditions can pose significant challenges to offshore drilling operations, particularly in deepwater environments. Landing strings are essential for ensuring the safe and efficient deployment and retrieval of drill strings and completion tools in these conditions. The use of landing strings is not limited to drilling activities. They are also used in well intervention operations, which are essential for maintaining production from subsea wells. These operations involve the injection of chemicals, water, or gas into the wellbore to enhance production or address production issues.

      The seabed plays a crucial role in the successful deployment and retrieval of landing strings. Advanced technologies, such as dynamic positioning systems and remotely operated vehicles, are used to ensure that the rig remains in the correct position above the seabed during these operations. In , the market plays a vital role in the offshore drilling industry. These components are essential for enabling the safe and efficient deployment and retrieval of drill strings and completion tools in deepwater environments. The market is expected to grow significantly in the coming years, driven by the increasing demand for crude oil and the availability of new technologies that enable drilling in ultradeep water.

      Market Scope

      Report Coverage

      Details

      Page number

      166

      Base year

      2023

      Historic period

      2018-2022

      Forecast period

      2024-2028

      Growth momentum & CAGR

      Accelerate at a CAGR of 7.06%

      Market growth 2024-2028

      USD 424.91 million

      Market structure

      Concentrated

      YoY growth 2023-2024(%)

      6.7

      Key countries

      US, Saudi Arabia, China, Germany, and UK

      Competitive landscape

      Leading Companies, Market Positioning of Companies, Competitive Strategies, and Industry Risks

      Request Free Sample

      What are the Key Data Covered in this Landing String Equipment Market Research and Growth Report?

      • CAGR of the Landing String Equipment industry during the forecast period
      • Detailed information on factors that will drive the growth and forecasting between 2024 and 2028
      • Precise estimation of the size of the market and its contribution of the industry in focus to the parent market
      • Accurate predictions about upcoming growth and trends and changes in consumer behaviour
      • Growth of the market across APAC, Middle East and Africa, Europe, North America, and South America
      • Thorough analysis of the market’s competitive landscape and detailed information about companies
      • Comprehensive analysis of factors that will challenge the landing string equipment market growth of industry companies

      We can help! Our analysts can customize this landing string equipment market research report to meet your requirements.

      Get in touch


      1 Executive Summary

      • 1.1 Market overview
        • Exhibit 01: Executive Summary – Chart on Market Overview
        • Exhibit 02: Executive Summary – Data Table on Market Overview
        • Exhibit 03: Executive Summary – Chart on Global Market Characteristics
        • Exhibit 04: Executive Summary – Chart on Market by Geography
        • Exhibit 05: Executive Summary – Chart on Market Segmentation by Type
        • Exhibit 06: Executive Summary – Chart on Market Segmentation by End-user
        • Exhibit 07: Executive Summary – Chart on Incremental Growth
        • Exhibit 08: Executive Summary – Data Table on Incremental Growth
        • Exhibit 09: Executive Summary – Chart on Vendor Market Positioning

      2 Market Landscape

      • 2.1 Market ecosystem
        • Exhibit 10: Parent market
        • Exhibit 11: Market Characteristics

      3 Market Sizing

      • 3.1 Market definition
        • Exhibit 12: Offerings of vendors included in the market definition
      • 3.2 Market segment analysis
        • Exhibit 13: Market segments
      • 3.3 Market size 2023
        • 3.4 Market outlook: Forecast for 2023-2028
          • Exhibit 14: Chart on Global - Market size and forecast 2023-2028 ($ million)
          • Exhibit 15: Data Table on Global - Market size and forecast 2023-2028 ($ million)
          • Exhibit 16: Chart on Global Market: Year-over-year growth 2023-2028 (%)
          • Exhibit 17: Data Table on Global Market: Year-over-year growth 2023-2028 (%)

        4 Historic Market Size

        • 4.1 Global landing string equipment market 2018 - 2022
          • Exhibit 18: Historic Market Size – Data Table on global landing string equipment market 2018 - 2022 ($ million)
        • 4.2 Type Segment Analysis 2018 - 2022
          • Exhibit 19: Historic Market Size – Type Segment 2018 - 2022 ($ million)
        • 4.3 End-user Segment Analysis 2018 - 2022
          • Exhibit 20: Historic Market Size – End-user Segment 2018 - 2022 ($ million)
        • 4.4 Geography Segment Analysis 2018 - 2022
          • Exhibit 21: Historic Market Size – Geography Segment 2018 - 2022 ($ million)
        • 4.5 Country Segment Analysis 2018 - 2022
          • Exhibit 22: Historic Market Size – Country Segment 2018 - 2022 ($ million)

        5 Five Forces Analysis

        • 5.1 Five forces summary
          • Exhibit 23: Five forces analysis - Comparison between 2023 and 2028
        • 5.2 Bargaining power of buyers
          • Exhibit 24: Chart on Bargaining power of buyers – Impact of key factors 2023 and 2028
        • 5.3 Bargaining power of suppliers
          • Exhibit 25: Bargaining power of suppliers – Impact of key factors in 2023 and 2028
        • 5.4 Threat of new entrants
          • Exhibit 26: Threat of new entrants – Impact of key factors in 2023 and 2028
        • 5.5 Threat of substitutes
          • Exhibit 27: Threat of substitutes – Impact of key factors in 2023 and 2028
        • 5.6 Threat of rivalry
          • Exhibit 28: Threat of rivalry – Impact of key factors in 2023 and 2028
        • 5.7 Market condition
          • Exhibit 29: Chart on Market condition - Five forces 2023 and 2028

        6 Market Segmentation by Type

        • 6.1 Market segments
          • Exhibit 30: Chart on Type - Market share 2023-2028 (%)
          • Exhibit 31: Data Table on Type - Market share 2023-2028 (%)
        • 6.2 Comparison by Type
          • Exhibit 32: Chart on Comparison by Type
          • Exhibit 33: Data Table on Comparison by Type
        • 6.3 Equipment - Market size and forecast 2023-2028
          • Exhibit 34: Chart on Equipment - Market size and forecast 2023-2028 ($ million)
          • Exhibit 35: Data Table on Equipment - Market size and forecast 2023-2028 ($ million)
          • Exhibit 36: Chart on Equipment - Year-over-year growth 2023-2028 (%)
          • Exhibit 37: Data Table on Equipment - Year-over-year growth 2023-2028 (%)
        • 6.4 Services - Market size and forecast 2023-2028
          • Exhibit 38: Chart on Services - Market size and forecast 2023-2028 ($ million)
          • Exhibit 39: Data Table on Services - Market size and forecast 2023-2028 ($ million)
          • Exhibit 40: Chart on Services - Year-over-year growth 2023-2028 (%)
          • Exhibit 41: Data Table on Services - Year-over-year growth 2023-2028 (%)
        • 6.5 Market opportunity by Type
          • Exhibit 42: Market opportunity by Type ($ million)
          • Exhibit 43: Data Table on Market opportunity by Type ($ million)

        7 Market Segmentation by End-user

        • 7.1 Market segments
          • Exhibit 44: Chart on End-user - Market share 2023-2028 (%)
          • Exhibit 45: Data Table on End-user - Market share 2023-2028 (%)
        • 7.2 Comparison by End-user
          • Exhibit 46: Chart on Comparison by End-user
          • Exhibit 47: Data Table on Comparison by End-user
        • 7.3 Deepwater - Market size and forecast 2023-2028
          • Exhibit 48: Chart on Deepwater - Market size and forecast 2023-2028 ($ million)
          • Exhibit 49: Data Table on Deepwater - Market size and forecast 2023-2028 ($ million)
          • Exhibit 50: Chart on Deepwater - Year-over-year growth 2023-2028 (%)
          • Exhibit 51: Data Table on Deepwater - Year-over-year growth 2023-2028 (%)
        • 7.4 Ultra-deepwater - Market size and forecast 2023-2028
          • Exhibit 52: Chart on Ultra-deepwater - Market size and forecast 2023-2028 ($ million)
          • Exhibit 53: Data Table on Ultra-deepwater - Market size and forecast 2023-2028 ($ million)
          • Exhibit 54: Chart on Ultra-deepwater - Year-over-year growth 2023-2028 (%)
          • Exhibit 55: Data Table on Ultra-deepwater - Year-over-year growth 2023-2028 (%)
        • 7.5 Shallow water - Market size and forecast 2023-2028
          • Exhibit 56: Chart on Shallow water - Market size and forecast 2023-2028 ($ million)
          • Exhibit 57: Data Table on Shallow water - Market size and forecast 2023-2028 ($ million)
          • Exhibit 58: Chart on Shallow water - Year-over-year growth 2023-2028 (%)
          • Exhibit 59: Data Table on Shallow water - Year-over-year growth 2023-2028 (%)
        • 7.6 Market opportunity by End-user
          • Exhibit 60: Market opportunity by End-user ($ million)
          • Exhibit 61: Data Table on Market opportunity by End-user ($ million)

        8 Customer Landscape

        • 8.1 Customer landscape overview
          • Exhibit 62: Analysis of price sensitivity, lifecycle, customer purchase basket, adoption rates, and purchase criteria

        9 Geographic Landscape

        • 9.1 Geographic segmentation
          • Exhibit 63: Chart on Market share by geography 2023-2028 (%)
          • Exhibit 64: Data Table on Market share by geography 2023-2028 (%)
        • 9.2 Geographic comparison
          • Exhibit 65: Chart on Geographic comparison
          • Exhibit 66: Data Table on Geographic comparison
        • 9.3 APAC - Market size and forecast 2023-2028
          • Exhibit 67: Chart on APAC - Market size and forecast 2023-2028 ($ million)
          • Exhibit 68: Data Table on APAC - Market size and forecast 2023-2028 ($ million)
          • Exhibit 69: Chart on APAC - Year-over-year growth 2023-2028 (%)
          • Exhibit 70: Data Table on APAC - Year-over-year growth 2023-2028 (%)
        • 9.4 Middle East and Africa - Market size and forecast 2023-2028
          • Exhibit 71: Chart on Middle East and Africa - Market size and forecast 2023-2028 ($ million)
          • Exhibit 72: Data Table on Middle East and Africa - Market size and forecast 2023-2028 ($ million)
          • Exhibit 73: Chart on Middle East and Africa - Year-over-year growth 2023-2028 (%)
          • Exhibit 74: Data Table on Middle East and Africa - Year-over-year growth 2023-2028 (%)
        • 9.5 Europe - Market size and forecast 2023-2028
          • Exhibit 75: Chart on Europe - Market size and forecast 2023-2028 ($ million)
          • Exhibit 76: Data Table on Europe - Market size and forecast 2023-2028 ($ million)
          • Exhibit 77: Chart on Europe - Year-over-year growth 2023-2028 (%)
          • Exhibit 78: Data Table on Europe - Year-over-year growth 2023-2028 (%)
        • 9.6 North America - Market size and forecast 2023-2028
          • Exhibit 79: Chart on North America - Market size and forecast 2023-2028 ($ million)
          • Exhibit 80: Data Table on North America - Market size and forecast 2023-2028 ($ million)
          • Exhibit 81: Chart on North America - Year-over-year growth 2023-2028 (%)
          • Exhibit 82: Data Table on North America - Year-over-year growth 2023-2028 (%)
        • 9.7 South America - Market size and forecast 2023-2028
          • Exhibit 83: Chart on South America - Market size and forecast 2023-2028 ($ million)
          • Exhibit 84: Data Table on South America - Market size and forecast 2023-2028 ($ million)
          • Exhibit 85: Chart on South America - Year-over-year growth 2023-2028 (%)
          • Exhibit 86: Data Table on South America - Year-over-year growth 2023-2028 (%)
        • 9.8 US - Market size and forecast 2023-2028
          • Exhibit 87: Chart on US - Market size and forecast 2023-2028 ($ million)
          • Exhibit 88: Data Table on US - Market size and forecast 2023-2028 ($ million)
          • Exhibit 89: Chart on US - Year-over-year growth 2023-2028 (%)
          • Exhibit 90: Data Table on US - Year-over-year growth 2023-2028 (%)
        • 9.9 China - Market size and forecast 2023-2028
          • Exhibit 91: Chart on China - Market size and forecast 2023-2028 ($ million)
          • Exhibit 92: Data Table on China - Market size and forecast 2023-2028 ($ million)
          • Exhibit 93: Chart on China - Year-over-year growth 2023-2028 (%)
          • Exhibit 94: Data Table on China - Year-over-year growth 2023-2028 (%)
        • 9.10 Saudi Arabia - Market size and forecast 2023-2028
          • Exhibit 95: Chart on Saudi Arabia - Market size and forecast 2023-2028 ($ million)
          • Exhibit 96: Data Table on Saudi Arabia - Market size and forecast 2023-2028 ($ million)
          • Exhibit 97: Chart on Saudi Arabia - Year-over-year growth 2023-2028 (%)
          • Exhibit 98: Data Table on Saudi Arabia - Year-over-year growth 2023-2028 (%)
        • 9.11 Germany - Market size and forecast 2023-2028
          • Exhibit 99: Chart on Germany - Market size and forecast 2023-2028 ($ million)
          • Exhibit 100: Data Table on Germany - Market size and forecast 2023-2028 ($ million)
          • Exhibit 101: Chart on Germany - Year-over-year growth 2023-2028 (%)
          • Exhibit 102: Data Table on Germany - Year-over-year growth 2023-2028 (%)
        • 9.12 UK - Market size and forecast 2023-2028
          • Exhibit 103: Chart on UK - Market size and forecast 2023-2028 ($ million)
          • Exhibit 104: Data Table on UK - Market size and forecast 2023-2028 ($ million)
          • Exhibit 105: Chart on UK - Year-over-year growth 2023-2028 (%)
          • Exhibit 106: Data Table on UK - Year-over-year growth 2023-2028 (%)
        • 9.13 Market opportunity by geography
          • Exhibit 107: Market opportunity by geography ($ million)
          • Exhibit 108: Data Tables on Market opportunity by geography ($ million)

        10 Drivers, Challenges, and Trends

        • 10.1 Market drivers
          • 10.2 Market challenges
            • 10.3 Impact of drivers and challenges
              • Exhibit 109: Impact of drivers and challenges in 2023 and 2028
            • 10.4 Market trends

              11 Vendor Landscape

              • 11.1 Overview
                • 11.2 Vendor landscape
                  • Exhibit 110: Overview on Criticality of inputs and Factors of differentiation
                • 11.3 Landscape disruption
                  • Exhibit 111: Overview on factors of disruption
                • 11.4 Industry risks
                  • Exhibit 112: Impact of key risks on business

                12 Vendor Analysis

                • 12.1 Vendors covered
                  • Exhibit 113: Vendors covered
                • 12.2 Market positioning of vendors
                  • Exhibit 114: Matrix on vendor position and classification
                • 12.3 Aker Solutions ASA
                  • Exhibit 115: Aker Solutions ASA - Overview
                  • Exhibit 116: Aker Solutions ASA - Business segments
                  • Exhibit 117: Aker Solutions ASA - Key news
                  • Exhibit 118: Aker Solutions ASA - Key offerings
                  • Exhibit 119: Aker Solutions ASA - Segment focus
                • 12.4 Drilltech Services North Sea Ltd.
                  • Exhibit 120: Drilltech Services North Sea Ltd. - Overview
                  • Exhibit 121: Drilltech Services North Sea Ltd. - Product / Service
                  • Exhibit 122: Drilltech Services North Sea Ltd. - Key offerings
                • 12.5 ExPert E and P Co. LLC
                  • Exhibit 123: ExPert E and P Co. LLC - Overview
                  • Exhibit 124: ExPert E and P Co. LLC - Product / Service
                  • Exhibit 125: ExPert E and P Co. LLC - Key offerings
                • 12.6 Expro Group Holdings NV
                  • Exhibit 126: Expro Group Holdings NV - Overview
                  • Exhibit 127: Expro Group Holdings NV - Business segments
                  • Exhibit 128: Expro Group Holdings NV - Key offerings
                  • Exhibit 129: Expro Group Holdings NV - Segment focus
                • 12.7 Halliburton Co.
                  • Exhibit 130: Halliburton Co. - Overview
                  • Exhibit 131: Halliburton Co. - Business segments
                  • Exhibit 132: Halliburton Co. - Key news
                  • Exhibit 133: Halliburton Co. - Key offerings
                  • Exhibit 134: Halliburton Co. - Segment focus
                • 12.8 Interventek Subsea Engineering Ltd.
                  • Exhibit 135: Interventek Subsea Engineering Ltd. - Overview
                  • Exhibit 136: Interventek Subsea Engineering Ltd. - Product / Service
                  • Exhibit 137: Interventek Subsea Engineering Ltd. - Key offerings
                • 12.9 NOV Inc.
                  • Exhibit 138: NOV Inc. - Overview
                  • Exhibit 139: NOV Inc. - Business segments
                  • Exhibit 140: NOV Inc. - Key offerings
                  • Exhibit 141: NOV Inc. - Segment focus
                • 12.10 Quail Tools LP
                  • Exhibit 142: Quail Tools LP - Overview
                  • Exhibit 143: Quail Tools LP - Product / Service
                  • Exhibit 144: Quail Tools LP - Key offerings
                • 12.11 Schlumberger Ltd.
                  • Exhibit 145: Schlumberger Ltd. - Overview
                  • Exhibit 146: Schlumberger Ltd. - Business segments
                  • Exhibit 147: Schlumberger Ltd. - Key news
                  • Exhibit 148: Schlumberger Ltd. - Key offerings
                  • Exhibit 149: Schlumberger Ltd. - Segment focus
                • 12.12 Superior Energy Services Inc.
                  • Exhibit 150: Superior Energy Services Inc. - Overview
                  • Exhibit 151: Superior Energy Services Inc. - Business segments
                  • Exhibit 152: Superior Energy Services Inc. - Key offerings
                  • Exhibit 153: Superior Energy Services Inc. - Segment focus
                • 12.13 TechnipFMC plc
                  • Exhibit 154: TechnipFMC plc - Overview
                  • Exhibit 155: TechnipFMC plc - Business segments
                  • Exhibit 156: TechnipFMC plc - Key news
                  • Exhibit 157: TechnipFMC plc - Key offerings
                  • Exhibit 158: TechnipFMC plc - Segment focus
                • 12.14 Vallourec SA
                  • Exhibit 159: Vallourec SA - Overview
                  • Exhibit 160: Vallourec SA - Business segments
                  • Exhibit 161: Vallourec SA - Key offerings
                  • Exhibit 162: Vallourec SA - Segment focus
                • 12.15 WellPartner AS
                  • Exhibit 163: WellPartner AS - Overview
                  • Exhibit 164: WellPartner AS - Product / Service
                  • Exhibit 165: WellPartner AS - Key offerings
                • 12.16 Yantai Enerserva Machinery Co. Ltd.
                  • Exhibit 166: Yantai Enerserva Machinery Co. Ltd. - Overview
                  • Exhibit 167: Yantai Enerserva Machinery Co. Ltd. - Product / Service
                  • Exhibit 168: Yantai Enerserva Machinery Co. Ltd. - Key offerings

                13 Appendix

                • 13.1 Scope of the report
                  • 13.2 Inclusions and exclusions checklist
                    • Exhibit 169: Inclusions checklist
                    • Exhibit 170: Exclusions checklist
                  • 13.3 Currency conversion rates for US$
                    • Exhibit 171: Currency conversion rates for US$
                  • 13.4 Research methodology
                    • Exhibit 172: Research methodology
                    • Exhibit 173: Validation techniques employed for market sizing
                    • Exhibit 174: Information sources
                  • 13.5 List of abbreviations
                    • Exhibit 175: List of abbreviations

                  Research Methodology

                  Technavio presents a detailed picture of the market by way of study, synthesis, and summation of data from multiple sources. The analysts have presented the various facets of the market with a particular focus on identifying the key industry influencers. The data thus presented is comprehensive, reliable, and the result of extensive research, both primary and secondary.

                  INFORMATION SOURCES

                  Primary sources

                  • Manufacturers and suppliers
                  • Channel partners
                  • Industry experts
                  • Strategic decision makers

                  Secondary sources

                  • Industry journals and periodicals
                  • Government data
                  • Financial reports of key industry players
                  • Historical data
                  • Press releases

                  DATA ANALYSIS

                  Data Synthesis

                  • Collation of data
                  • Estimation of key figures
                  • Analysis of derived insights

                  Data Validation

                  • Triangulation with data models
                  • Reference against proprietary databases
                  • Corroboration with industry experts

                  REPORT WRITING

                  Qualitative

                  • Market drivers
                  • Market challenges
                  • Market trends
                  • Five forces analysis

                  Quantitative

                  • Market size and forecast
                  • Market segmentation
                  • Geographical insights
                  • Competitive landscape

                  Interested in this report?

                  Get your sample now to see our research methodology and insights!

                  Download Now

                  Frequently Asked Questions

                  Landing String Equipment market growth will increase by $ 424.91 mn during 2024-2028.

                  The Landing String Equipment market is expected to grow at a CAGR of 7.06% during 2024-2028.

                  Landing String Equipment market is segmented by Type( Equipment, Services, shallow water) End-user( Deepwater, Ultra-deepwater, Shallow water, North America, South America)

                  Aker Solutions ASA, Drilltech Services North Sea Ltd., ExPert E and P Co. LLC, Expro Group Holdings NV, Halliburton Co., Interventek Subsea Engineering Ltd., NOV Inc., Quail Tools LP, Schlumberger Ltd., Superior Energy Services Inc., TechnipFMC plc, Vallourec SA, WellPartner AS, Yantai Enerserva Machinery Co. Ltd. are a few of the key vendors in the Landing String Equipment market.

                  APAC will register the highest growth rate of 41% among the other regions. Therefore, the Landing String Equipment market in APAC is expected to garner significant business opportunities for the vendors during the forecast period.

                  US, Saudi Arabia, China, Germany, UK

                  • Rise in deep-water and ultra-deepwater E and P activitiesUpstream oil and gas companies have been recovering oil and natural gas from onshore wells for many decades. Offshore wells are also popular sources of oil and gas E and P. In offshore E and P is the driving factor this market.
                  • oil and gas companies shifted their focus from shallow waters to deep-water and ultra-deepwater resources due to large untapped reserves. The production of oil is the driving factor this market.
                  • particularly in a subsea environment is the driving factor this market.
                  • is more expensive than the conventional methods of oil production. Drilling in offshore locations is a more challenging task compared with drilling in onshore locations due to the harsh environment. As per the US Energy Information Administration (EIA) is the driving factor this market.
                  • global offshore deep-water oil production will increase by 2.7 million barrels per day (mbpd) between 2017 and 2040. The offshore investments are expected to grow at a CAGR of 11.50% during 2018-2024. In addition is the driving factor this market.
                  • the future of deep-water and ultra-deepwater projects is expected to be bright because of the rising crude oil prices. Due to the recovery in crude oil prices is the driving factor this market.
                  • companies have increased their E and P operations in places with large oil reserves is the driving factor this market.
                  • such as GoM and Brazil. Deep-water and ultra-deepwater oil and gas projects have been increasing over the past few years. The main Pecan field is the driving factor this market.
                  • which lies in the deep-water block is the driving factor this market.
                  • will be developed with floating production storage and offloading (FPSO) for central processing and export and a subsea production system that serves up to 26 subsea wells. In December 2018 is the driving factor this market.
                  • Transocean announced that the company signed a rig design and construction management contract and a five-year offshore drilling contract with Chevron. As per the IEA is the driving factor this market.
                  • Brazil is a primary location for offshore oil and gas investments in the New Policies Scenario is the driving factor this market.
                  • where annual capital expenditure is expected to reach $60 billion by 2040. In GoM is the driving factor this market.
                  • combined investments made by the US and Mexico are expected to increase by the mid-2020s to approximately $20 billion per year and are likely to rise to more than $30 billion by 2040. The rise in investments in offshore drilling will propel E and P activities in offshore wells is the driving factor this market.
                  • including subsea wells is the driving factor this market.
                  • which will stimulate the need for landing strings for drilling and the safe landing of casing strings onto the seabed. Hence is the driving factor this market.
                  • the rise in E and P activities in deep-water and ultra-deepwater resources will drive the global landing string equipment market during the forecast period. is the driving factor this market.

                  The Landing String Equipment market vendors should focus on grabbing business opportunities from the Equipment segment as it accounted for the largest market share in the base year.