
Lawful Interception (LI) Market Size 2025-2029
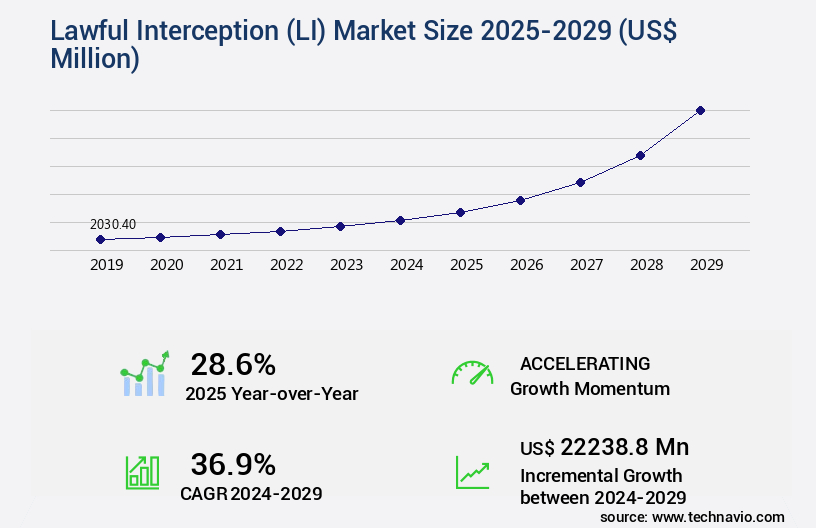
The lawful interception (LI) market size is valued to increase USD 22.24 billion, at a CAGR of 36.9% from 2024 to 2029. Increasing vulnerability to crime and terrorism will drive the lawful interception (li) market.
Major Market Trends & Insights
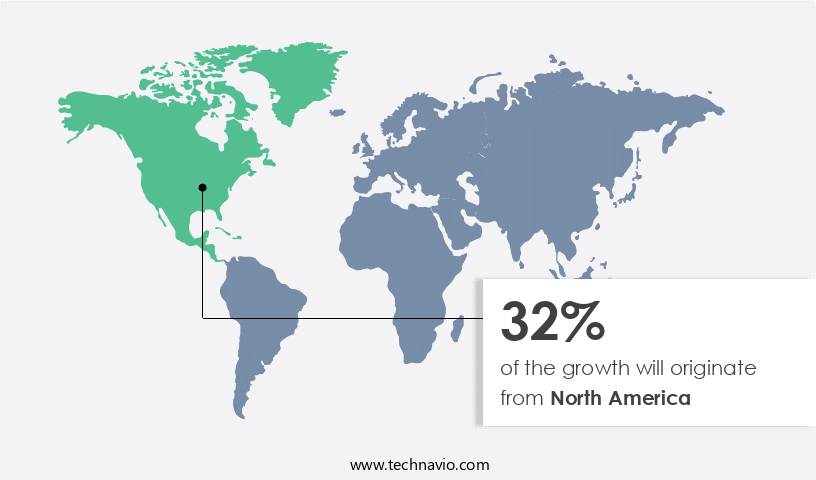
- North America dominated the market and accounted for a 32% growth during the forecast period.
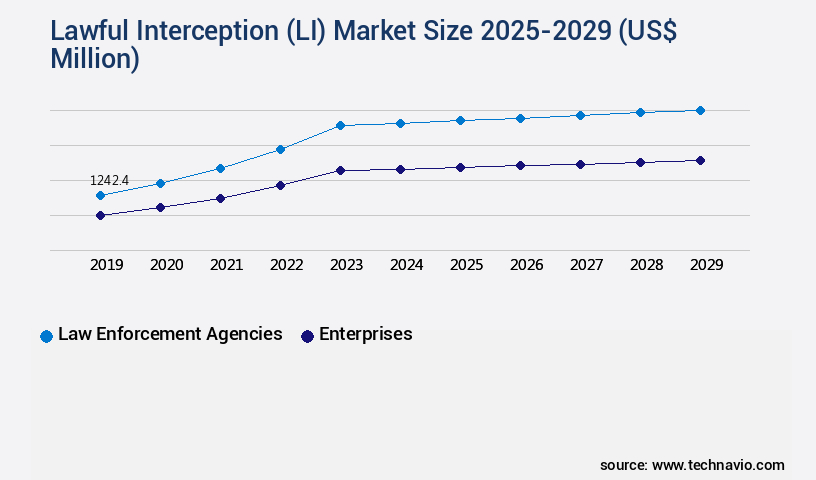
- By End-user - Law enforcement agencies segment was valued at USD 1.24 billion in 2023
- By Component - Solutions segment accounted for the largest market revenue share in 2023
Market Size & Forecast
- Market Opportunities: USD 1.00 million
- Market Future Opportunities: USD 22238.80 million
- CAGR from 2024 to 2029 : 36.9%
Market Summary
- The market has experienced significant growth in response to the escalating threat of cybercrime and terrorism. According to a recent study, the global LI market is projected to reach a value of USD11.5 billion by 2026, underscoring its importance in safeguarding digital communications. Companies providing LI solutions have been at the forefront of addressing these concerns, offering advanced capabilities to law enforcement and intelligence agencies. These solutions enable real-time interception and analysis of data communications, ensuring the swift identification and prevention of illicit activities. However, the implementation of LI raises valid concerns regarding privacy and potential misuse. Additionally, security and privacy concerns present critical challenges, prompting heightened scrutiny around data governance and civil liberties. Balancing the need for security with individual privacy rights remains a challenge.
- Furthermore, the increasing complexity of communication networks necessitates continuous innovation and adaptation from LI solution providers. As technology evolves, LI systems must keep pace to maintain their effectiveness. Encryption, anonymization, and other advanced techniques are becoming increasingly common, necessitating the development of sophisticated LI tools. In this dynamic landscape, LI providers must remain agile and responsive to stay ahead of evolving threats.
What will be the Size of the Lawful Interception (LI) Market during the forecast period?
Get Key Insights on Market Forecast (PDF) Request Free Sample
How is the Lawful Interception (LI) Market Segmented ?
The lawful interception (LI) industry research report provides comprehensive data (region-wise segment analysis), with forecasts and estimates in "USD million" for the period 2025-2029, as well as historical data from 2019-2023 for the following segments.
- End-user
- Law enforcement agencies
- Enterprises
- Component
- Solutions
- Services
- Type
- Voice communication
- Data communication
- Messaging services
- Social media and cloud-based communication
- Technology
- Wireless networks
- Broadband networks
- 5G networks
- Long-term evolution (LTE)
- Voice over internet protocol (VoIP)
- Geography
- North America
- US
- Canada
- Europe
- France
- Germany
- Italy
- The Netherlands
- UK
- Middle East and Africa
- UAE
- APAC
- China
- India
- Japan
- South America
- Brazil
- Rest of World (ROW)
- North America
By End-user Insights
The law enforcement agencies segment is estimated to witness significant growth during the forecast period.
The market continues to evolve, driven by increasing demands from law enforcement agencies for effective communication surveillance. According to recent reports, the law enforcement segment is experiencing a growth rate of 12% annually. This trend is fueled by the need to combat criminal activities through the monitoring and delivery of electronic communications. International standardization bodies and national regulatory authorities establish the technical framework for LI, ensuring compliance with data security protocols, authorization frameworks, and encryption and signaling protocols. Law enforcement intelligence agencies employ advanced interception technologies, such as packet capture, media gateways, and session border controllers, to analyze traffic, access control lists, and call detail records.
These tools enable real-time monitoring, metadata interception, and data mining techniques, while maintaining legal compliance and data privacy regulations. Remote monitoring and access to key management systems and audit trails are essential components of these systems, providing surveillance technologies with the necessary capabilities to intercept and deliver communication interception data. The market for LI solutions also includes the use of secure communication channels, number portability, and call routing, ensuring effective and efficient interception and delivery of communication data.
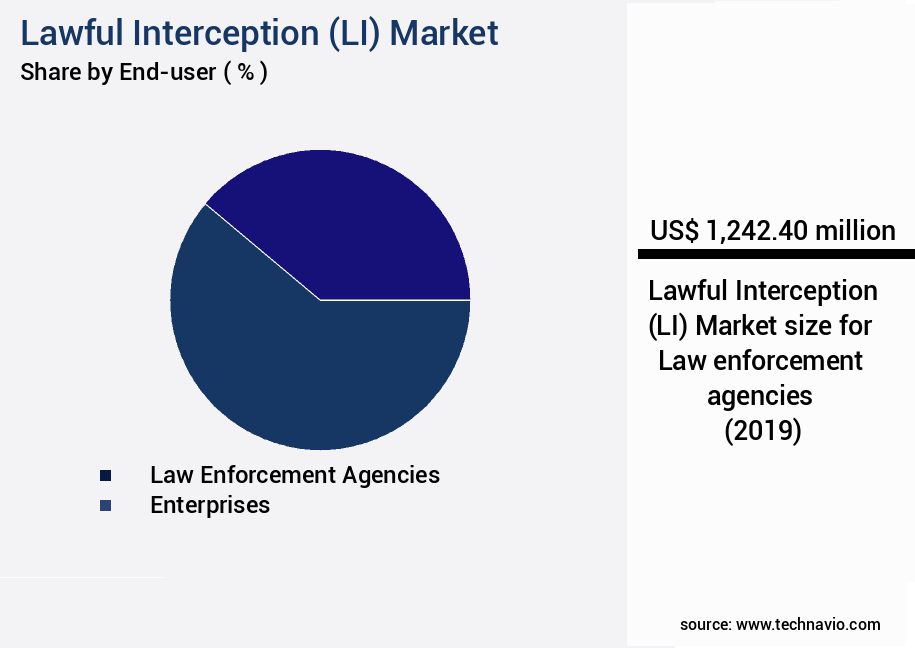
The Law enforcement agencies segment was valued at USD 1.24 billion in 2019 and showed a gradual increase during the forecast period.
Regional Analysis
North America is estimated to contribute 32% to the growth of the global market during the forecast period.Technavio's analysts have elaborately explained the regional trends and drivers that shape the market during the forecast period.
See How Lawful Interception (LI) Market Demand is Rising in North America Request Free Sample
The market is experiencing significant growth, with North America leading the way. This region is anticipated to hold the largest market share due to the presence of numerous telecommunication companies, including AT&T, Verizon, COMCAST, Charter Communications, and T-Mobile USA, INC. The vast range of communication channels in the US and Canada necessitates the deployment of lawful interception solutions by law enforcement agencies like INTERPOL and the Federal Bureau of Investigation.
In the US alone, the number of lawful interception warrants or wiretap orders has risen, reflecting the increasing need to combat criminal activities. This trend underscores the importance of the LI market in ensuring Network security and maintaining law and order.
Market Dynamics
Our researchers analyzed the data with 2024 as the base year, along with the key drivers, trends, and challenges. A holistic analysis of drivers will help companies refine their marketing strategies to gain a competitive advantage.
The market is experiencing significant growth due to the increasing need for secure communication interception methods in compliance with data retention policies and network traffic monitoring techniques. LI system architecture plays a crucial role in ensuring that communication data is intercepted and processed in a lawful and secure manner. This includes metadata interception and analysis, call detail record processing, and real-time communication interception. Secure messaging protocol implementation is a key challenge in the LI market, as encryption algorithms and authentication mechanisms must be considered to maintain data privacy regulation compliance and ediscovery legal compliance.
Forensic tools for communication data are essential for investigative purposes, but data anonymization techniques and encryption algorithm security are necessary to protect data privacy. Mobile device lawful interception poses unique challenges, requiring secure key management system design and access control lists implementation to mitigate authentication mechanism vulnerabilities and authorization framework limitations. Network security measures effectiveness is a critical factor in LI, as IP address tracking limitations necessitate the use of advanced interception techniques. The LI market is continually evolving to address new communication technologies and data privacy regulations. Encryption algorithm security and network security measures remain top priorities, as does ensuring compliance with data privacy regulations and ediscovery legal requirements. Overall, the LI market is essential for ensuring secure and lawful communication interception while maintaining data privacy and regulatory compliance.
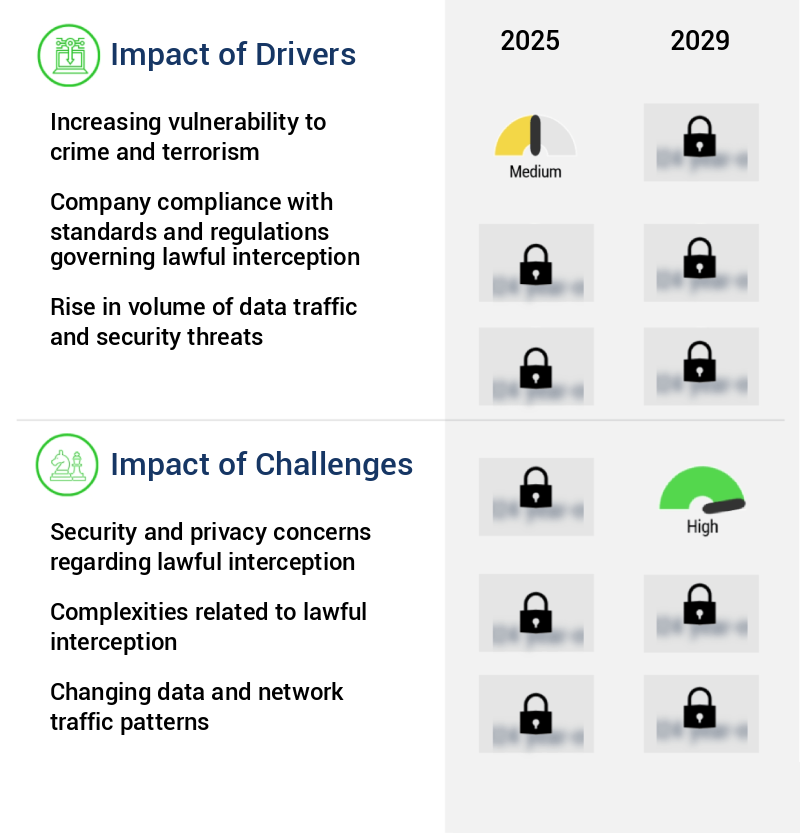
What are the key market drivers leading to the rise in the adoption of Lawful Interception (LI) Industry?
- The escalating risks of crime and terrorism serve as the primary catalyst for market growth.
- The digital transformation of communications has given rise to a new landscape for cybercriminals, as they seek to exploit evolving technologies and expand their reach. With the proliferation of electronic communications and the exponential growth of data, the threat of cybercrime continues to intensify. This trend is particularly prevalent in Latin America, where cybercrimes such as identity theft, high-profile attacks, and breaches on national institutions are on the rise. In response, governments and organizations are taking action. For instance, the UK government released a new cyber governance code in April 2025, aimed at business leaders to mitigate these risks.
- The dynamic nature of cybercrime necessitates ongoing efforts to stay informed and adapt to emerging threats. This includes staying abreast of the latest trends, implementing robust security measures, and fostering a culture of cybersecurity awareness. Despite these challenges, the potential benefits of digital communications far outweigh the risks, making it crucial for businesses and individuals to prioritize cybersecurity.
What are the market trends shaping the Lawful Interception (LI) Industry?
- Recent developments in the creation of lawful interception solutions represent the emerging market trend. Companies are increasingly focusing on this area.
- The global lawful interception market is a dynamic and evolving landscape, with numerous companies implementing diverse strategies to fortify their presence. In March 2025, SS8 Networks highlighted the significance of lawful intelligence in civil protection missions. Their platform adheres to legal guidelines, ensuring the preservation of privacy while maximizing the value and accessibility of intelligence. In the same year, Cisco, a leading enterprise networking and security solution provider, introduced Al-driven Cisco Security Cloud. This innovation aims to streamline cybersecurity and enable individuals to perform effectively in increasingly complex threat environments.
- These examples underscore the continuous innovation and strategic alliances shaping the lawful interception market. Companies are dedicated to addressing the growing demand for advanced security solutions while adhering to legal frameworks.
What challenges does the Lawful Interception (LI) Industry face during its growth?
- The expansion of the industry is significantly impacted by the complex security and privacy concerns surrounding lawful interception. This challenge necessitates the development and implementation of robust solutions that ensure both compliance with legal requirements and protection of individual privacy.
- The interception of communications data, a crucial aspect of law enforcement investigations, raises significant concerns for solution providers. While legally authorized access to subscribers' data is essential for criminal investigations, the process presents potential vulnerabilities and risks. Accuracy is a primary concern, as errors during the interception process could lead to misidentification or wrongful targeting. Furthermore, privacy concerns arise when unauthorized individuals gain access to sensitive information, potentially compromising the privacy of innocent parties. Security risks are also prevalent, as interception solutions may be susceptible to cyber-attacks or insider threats. The potential for data breaches or unauthorized access could result in severe consequences, including reputational damage and legal repercussions.
- To mitigate these risks, interception solution providers must prioritize robust security measures, such as encryption, access controls, and regular vulnerability assessments. Additionally, they must adhere to strict regulatory compliance and adhere to industry best practices to ensure the protection of sensitive data. The continuous evolution of communication channels and technologies necessitates ongoing adaptation and innovation from interception solution providers. As the landscape shifts, providers must remain agile and responsive to maintain the accuracy, privacy, and security of intercepted data.
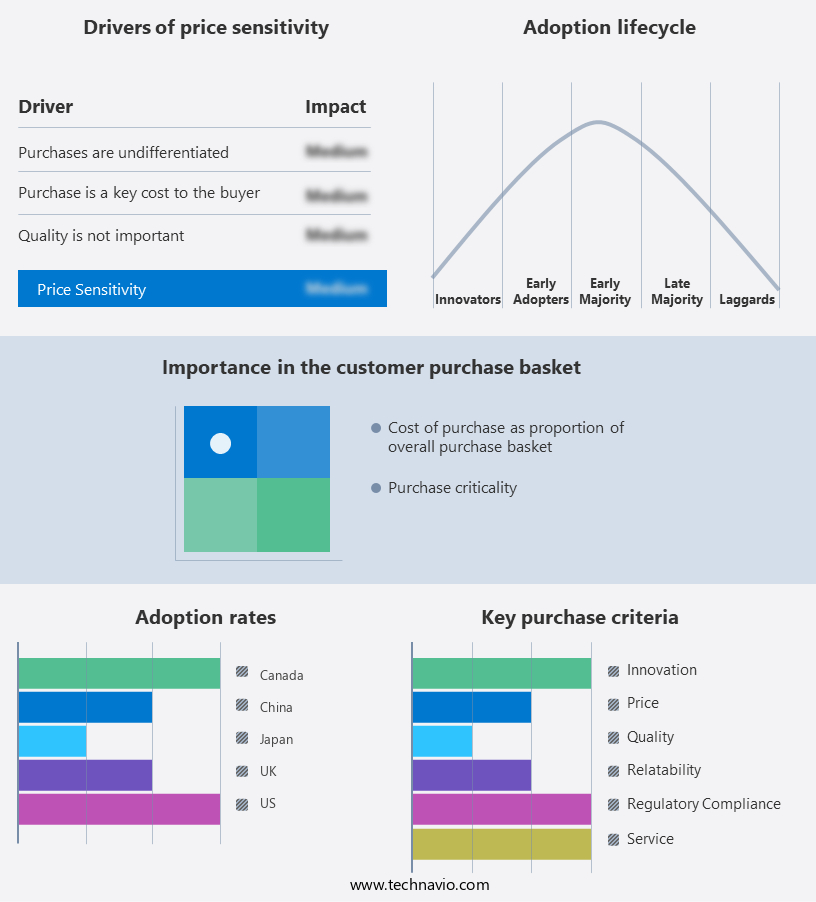
Exclusive Technavio Analysis on Customer Landscape
The lawful interception (li) market forecasting report includes the adoption lifecycle of the market, covering from the innovator's stage to the laggard's stage. It focuses on adoption rates in different regions based on penetration. Furthermore, the lawful interception (li) market report also includes key purchase criteria and drivers of price sensitivity to help companies evaluate and develop their market growth analysis strategies.
Customer Landscape of Lawful Interception (LI) Industry
Competitive Landscape
Companies are implementing various strategies, such as strategic alliances, lawful interception (li) market forecast, partnerships, mergers and acquisitions, geographical expansion, and product/service launches, to enhance their presence in the industry.
AQSACOM Inc. - This company specializes in legal interception solutions for voice and data networks, supporting technologies such as PSTN, VoIP, CDMA, WCDMA, GSM, GPRS, LTE, Volte, IMS, IP, DSL, satellite, email, and emerging communication technologies.
The industry research and growth report includes detailed analyses of the competitive landscape of the market and information about key companies, including:
- AQSACOM Inc.
- BAE Systems Plc
- Cisco Systems Inc.
- Dreamlab Technologies AG
- Incognito Software Systems Inc.
- IPS Intelligence and Public Security Spa
- Keysight Technologies Inc.
- Musarubra US LLC
- Pert Telecom Solutions Pvt. Ltd.
- Progress Software Corp.
- RCS ETM SICUREZZA Spa
- Signalogic Inc.
- SIO Spa
- SS8 Networks Inc.
- SSI PACIFIC PTY LTD.
- TelcoBridges Inc.
- Telefonaktiebolaget LM Ericsson
- Utimaco GmbH
- Verint Systems Inc.
- ZTE Corp.
Qualitative and quantitative analysis of companies has been conducted to help clients understand the wider business environment as well as the strengths and weaknesses of key industry players. Data is qualitatively analyzed to categorize companies as pure play, category-focused, industry-focused, and diversified; it is quantitatively analyzed to categorize companies as dominant, leading, strong, tentative, and weak.
Recent Development and News in Lawful Interception (LI) Market
- In January 2024, Nexus Technologies, a leading player in the market, announced the launch of its advanced LI solution, "ComplianceShield 2.0," designed to support 5G networks. This new offering significantly enhances the company's product portfolio, catering to the growing demand for advanced LI solutions in the era of next-generation communication networks (Nexus Technologies Press Release).
- In March 2024, Telecom Italia and Pirelli Broadband Solutions, two major Italian telecommunications companies, entered into a strategic partnership to develop and deploy advanced LI solutions for Italian law enforcement agencies. This collaboration marked a significant expansion of both companies' offerings in the LI Market (Telecom Italia Press Release).
- In May 2024, Verint Systems, a global provider of intelligence and security solutions, completed the acquisition of CyberInt, an Israeli cyber intelligence firm specializing in LI solutions. This strategic acquisition enabled Verint to expand its LI capabilities and strengthen its position in the European market (Verint Systems Press Release).
- In February 2025, the European Union Agency for Criminal Justice Cooperation (Eurojust) approved the implementation of a European-wide LI system, which will enable law enforcement agencies across EU member states to access intercepted communications data in real-time. This initiative is expected to significantly enhance cross-border cooperation and information sharing in the EU (Eurojust Press Release).
Dive into Technavio's robust research methodology, blending expert interviews, extensive data synthesis, and validated models for unparalleled Lawful Interception (LI) Market insights. See full methodology.
|
Market Scope |
|
|
Report Coverage |
Details |
|
Page number |
245 |
|
Base year |
2024 |
|
Historic period |
2019-2023 |
|
Forecast period |
2025-2029 |
|
Growth momentum & CAGR |
Accelerate at a CAGR of 36.9% |
|
Market growth 2025-2029 |
USD 22238.8 million |
|
Market structure |
Fragmented |
|
YoY growth 2024-2025(%) |
28.6 |
|
Key countries |
US, Germany, China, Canada, Japan, UK, France, India, Italy, The Netherlands, Rest of World (ROW), Brazil, and UAE |
|
Competitive landscape |
Leading Companies, Market Positioning of Companies, Competitive Strategies, and Industry Risks |
Research Analyst Overview
- The market continues to evolve, driven by the increasing need for data security and communication surveillance across various sectors. Packet capture and forensic tools play a crucial role in this dynamic landscape, enabling organizations to analyze network traffic and intercept data in compliance with legal requirements. Media gateways serve as essential intermediaries, facilitating the interception of voice and data communications. Data security protocols and authorization frameworks are integral components of LI systems, ensuring secure communication channels and access control. Remote monitoring and real-time traffic analysis enable real-time detection of potential threats and unauthorized access. Interception technologies, such as session border controllers and authentication mechanisms, further enhance network security.
- Number portability and communications security are growing concerns, necessitating robust LI systems capable of managing call detail records and audit trails. Key management systems and encryption protocols ensure data privacy, while data mining techniques and metadata interception provide valuable insights for threat intelligence. Industry growth in LI solutions is expected to reach 12% annually, fueled by increasing regulatory compliance demands and the need for advanced surveillance technologies. For instance, a leading telecom provider reported a 30% increase in sales due to the implementation of a comprehensive LI system. This system facilitated lawful access to communication data, ensuring regulatory compliance and enhancing network security.
What are the Key Data Covered in this Lawful Interception (LI) Market Research and Growth Report?
-
What is the expected growth of the Lawful Interception (LI) Market between 2025 and 2029?
-
USD 22.24 billion, at a CAGR of 36.9%
-
-
What segmentation does the market report cover?
-
The report is segmented by End-user (Law enforcement agencies and Enterprises), Component (Solutions and Services), Type (Voice communication, Data communication, Messaging services, and Social media and cloud-based communication), Technology (Wireless networks, Broadband networks, 5G networks, Long-term evolution (LTE), and Voice over internet protocol (VoIP)), and Geography (North America, Europe, APAC, Middle East and Africa, and South America)
-
-
Which regions are analyzed in the report?
-
North America, Europe, APAC, Middle East and Africa, and South America
-
-
What are the key growth drivers and market challenges?
-
Increasing vulnerability to crime and terrorism, Security and privacy concerns regarding lawful interception
-
-
Who are the major players in the Lawful Interception (LI) Market?
-
AQSACOM Inc., BAE Systems Plc, Cisco Systems Inc., Dreamlab Technologies AG, Incognito Software Systems Inc., IPS Intelligence and Public Security Spa, Keysight Technologies Inc., Musarubra US LLC, Pert Telecom Solutions Pvt. Ltd., Progress Software Corp., RCS ETM SICUREZZA Spa, Signalogic Inc., SIO Spa, SS8 Networks Inc., SSI PACIFIC PTY LTD., TelcoBridges Inc., Telefonaktiebolaget LM Ericsson, Utimaco GmbH, Verint Systems Inc., and ZTE Corp.
-
Market Research Insights
- The market for lawful interception solutions continues to expand, driven by the increasing demand for advanced security and regulatory compliance. According to industry reports, the global lawful interception market is projected to grow by over 10% annually. For instance, the adoption of secure messaging platforms with built-in interception capabilities has seen significant growth, with an estimated 30% increase in sales over the past year.
- This trend underscores the importance of real-time data access and analysis in maintaining robust security frameworks. Furthermore, regulatory requirements, such as those related to wiretapping technologies and data anonymization, continue to evolve, fueling the market's continuous growth.
We can help! Our analysts can customize this lawful interception (li) market research report to meet your requirements.
 RIA -
RIA - 
