Liner Hanger Systems Market Size 2024-2028
The liner hanger systems market size is estimated to grow by USD 561.2 million at a CAGR of 3.27% between 2023 and 2028. The global Liner Hanger Systems market is experiencing significant growth, driven by the increasing global consumption of liquid fuels and the expansion of deepwater and ultra-deepwater exploration projects. The market is expected to witness growth due to the rising demand for enhanced oil recovery techniques and the depletion of conventional oil reserves. However, the cessation of World Bank funding for Exploration and Production (E&P) activities may pose a challenge to market growth. Additionally, the market is witnessing trends such as the integration of advanced technologies like smart hanger systems and the increasing preference for localized manufacturing to reduce costs and ensure timely delivery. The market is expected to continue its growth trajectory, driven by these trends and the increasing demand for efficient and cost-effective liner hanger systems.
What will be the Size of the Market During the Forecast Period?

For More Highlights About this Report, Request Free Sample
Market Dynamic and Customer Landscape
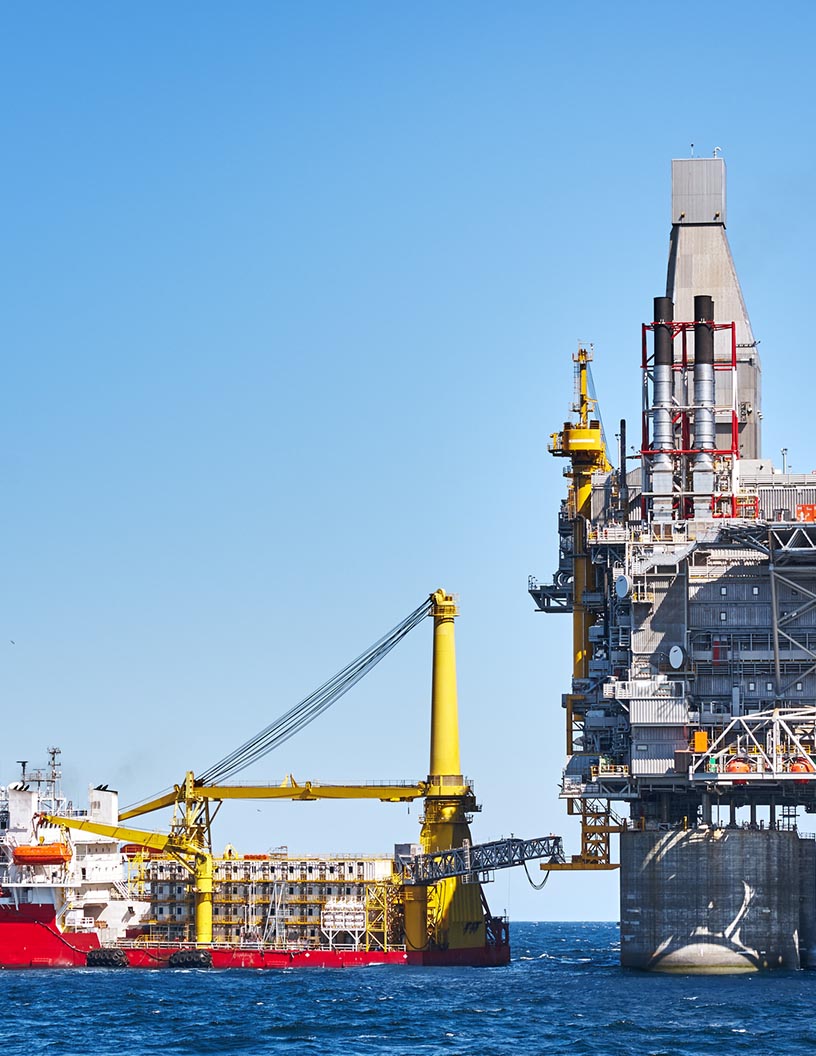
Liner hanger systems play a crucial role in the oil and gas industry, particularly during drilling operations in reservoir formations such as offshore exploration and production activities. These systems consist of slips, casing strings, and various running tools like hanger, liner-top packer, polished bore receptacle, and setting tool. The hanger is a critical component that secures the liner in place within the wellbore. During drilling, the hanger is lowered to the desired depth and engaged with the casing string. Once the liner is in position, the hanger is locked in place using high-strength materials like steel or aluminum. Rubber components may also be used to ensure a tight seal and prevent leakage. Hydraulic fracturing and horizontal drilling are common drilling techniques that utilize liner hanger systems in oilfield drilling. Deep-water exploration and offshore projects require specialized liner hanger systems due to the unique challenges of drilling in these environments. The use of advanced materials and technologies continues to drive innovation in the liner hanger market, ensuring efficient and reliable operations in various reservoir formations. Our researchers analyzed the data with 2023 as the base year, along with the key drivers, trends, and challenges. A holistic analysis of drivers will help companies refine their marketing strategies to gain a competitive advantage.
Key Market Driver
Global growth in liquid fuel consumption is notably driving market growth. The global energy landscape is undergoing significant shifts due to changing consumption patterns and economic conditions. According to the US Energy Information Administration (EIA), global petroleum and liquid fuels consumption decreased by 5.8 million barrels per day (b/d) in the first quarter of 2020, with expectations of averaging 8.1 million b/d less in 2020 compared to 2019. This decline is primarily attributed to disruptions in economic activities and reduced travel plans due to COVID-19. However, developing economies, such as China and India, continue to exhibit increasing demand for fuel. In the oil and gas industry, the demand for hydraulic liner hangers is anticipated to remain the demand, especially in well completions, interventions, and abandonment operations.
Furthermore, these systems play a crucial role in maintaining the stability of the wellbore and preventing fluid migration. Hydraulic liner hangers consist of a hanger, running tool, and setting tool, often made of high-strength materials such as steel and aluminum, or advanced materials like high-strength alloys, composite materials, and polymers, which offer resistance to wear and tear. Offshore activities, multizone wells, and shallow waters further expand the application scope of hydraulic liner hangers. These systems are essential in the production of oil and gas from challenging environments, ensuring the efficient and safe operation of wells. Despite the current market challenges, the future of the hydraulic liner hanger market remains promising, with ongoing technological advancements and the increasing demand for oil and gas production. Thus, such factors are driving the growth of the market during the forecast period.
Significant Market Trends
An increase in deepwater and ultra-deepwater exploration is the key trend in the market. In the oil and gas industry, liner hanger systems play a crucial role in well completions, interventions, and abandonment operations, particularly in offshore activities. These systems consist of hydraulic liner hangers, running tools, and setting tools, which ensure the proper positioning and sealing of liners and liner-top packers in the wellbore. Liner hangers are available in various materials, including high-strength steel, aluminum, rubber, and advanced materials such as high-strength alloys, composite materials, and polymers.
Furthermore, the selection of material depends on the specific requirements of the well, such as resistance to wear, fluid migration, and operating conditions in multizone wells. The use of liner hanger systems is essential in deepwater and ultra-deepwater projects, where the harsh environment and challenging drilling conditions necessitate the use of advanced materials and technologies. Despite the high costs associated with offshore projects, the potential for significant oil and gas reserves makes them an attractive investment for oil and gas companies. The shift towards high-strength materials and advanced technologies is expected to drive the growth of the market in the coming years. Thus, such trends will shape the growth of the market during the forecast period.
Major Market Challenge
The cessation of World Bank funding for E and P activities is the major challenge that affects the growth of the market. The market encompasses hydraulic liner hangers utilized in the oil and gas industry for securing liners in the wellbore during well completions, interventions, and abandonment operations. These hangers are essential components, ensuring the proper sealing of the wellbore with liner-top packers and polished bore receptacles. Hangers are available in various high-strength materials, including steel and aluminum, which offer resistance to wear and fluid migration in multizone wells. Advanced materials, such as high-strength alloys, composite materials, and polymers, are increasingly being adopted due to their superior properties.
Furthermore, offshore activities and deepwater drilling necessitate the use of advanced liner hanger systems. In shallow waters, rubber hanger systems are commonly employed due to their flexibility and cost-effectiveness. Hydraulic liner hangers are run using setting tools, which ensure the proper positioning and sealing of the liner. The market for liner hanger systems is expected to grow significantly due to the increasing demand for well completions and interventions, especially in complex well designs, such as those in multizone wells. The use of liner hanger systems aids in reducing operational costs and enhancing safety and efficiency in oil and gas production. Hence, the above factors will impede the growth of the market during the forecast period
Key Market Customer Landscape
The market forecasting report includes the adoption lifecycle of the market, covering from the innovator's stage to the laggard's stage. It focuses on adoption rates in different regions based on penetration. Furthermore, the report also includes key purchase criteria and drivers of price sensitivity to help companies evaluate and develop their market growth analysis strategies.

Customer Landscape
Key Companies & Market Insights
Companies are implementing various strategies, such as strategic alliances, partnerships, mergers and acquisitions, geographical expansion, and product/service launches, to enhance their presence in the market.
Allamon Tool Co Inc. - The company offers Liner hanger systems that provide liner and casing running equipment and services for drilling and completion operations onshore and offshore.
The market research and growth report also includes detailed analyses of the competitive landscape of the market and information about key companies, including:
- Allamon Tool Co Inc.
- Baker Hughes Co.
- BOTIL Oil Tools India Pvt. Ltd.
- DEW Wartungs und Reparatur GmbH
- Dril Quip Inc.
- Halliburton Co.
- Innovex
- Maximus Completion Systems
- NCS Multistage Holdings Inc
- NOV Inc.
- Packers Plus Energy Services Inc.
- Peak Completion Technologies Inc.
- Saga-PCE Pte. Ltd.
- SAZ Oilfield Services Pte. Ltd.
- Schlumberger Ltd.
- TANGENTOG EQUIPMENT AND SUPPLY PVT. Ltd.
- Tianjin Elegant Technology Co. Ltd.
- Weatherford International Plc
- Well Innovation AS
- Wellcare Oil Tools Pvt. Ltd.
Qualitative and quantitative analysis of companies has been conducted to help clients understand the wider business environment as well as the strengths and weaknesses of key market players. Data is qualitatively analyzed to categorize companies as pure play, category-focused, industry-focused, and diversified; it is quantitatively analyzed to categorize companies as dominant, leading, strong, tentative, and weak.
Market Segmentation
By Application
The onshore segment is estimated to witness significant growth during the forecast period. Liner hangers are essential mechanical components used in drilling operations for securing casing strings in wellbores during upstream oil and gas activities. These systems play a crucial role in offshore exploration and production activities, particularly in deepwater and ultra-deepwater projects. Mechanical liner hangers, expandable liner hangers, and conventional liner hangers are the primary types used in the industry.

Get a glance at the market share of various regions Download the PDF Sample
The onshore segment was the largest segment and was valued at USD 2.73 billion in 2018. Hydraulic fracturing, horizontal drilling, and directional drilling have revolutionized the oil and gas industry, enabling access to complex reservoir formations. The offshore industry has witnessed significant growth, with rigs being deployed in deep-water exploration and production. Crude oil production from offshore projects has increased, contributing to liquid fuel consumption and climate risk financing. Insurance solutions and the adoption of low-carbon fuels and clean energy fuels are becoming increasingly important in the industry. The US, Canada, Russia, and Middle Eastern countries are major contributors to onshore and offshore oil and gas explorations. Unconventional oil and gas production, such as three-high wells and three-low wells, have gained popularity in the US and Mexico. The use of durable materials and advanced production equipment is essential for optimizing petroleum product recovery and minimizing environmental impact. In conclusion, the liner hanger market is a critical component of the upstream offshore exploration industry. The market is driven by the increasing demand for crude oil and liquid fuels, deep-water exploration, and the adoption of advanced drilling technologies such as horizontal, directional, and unconventional drilling. The market is expected to grow significantly, with investments in offshore projects and the use of innovative materials and technologies.
By Region
For more insights on the market share of various regions Download PDF Sample now!
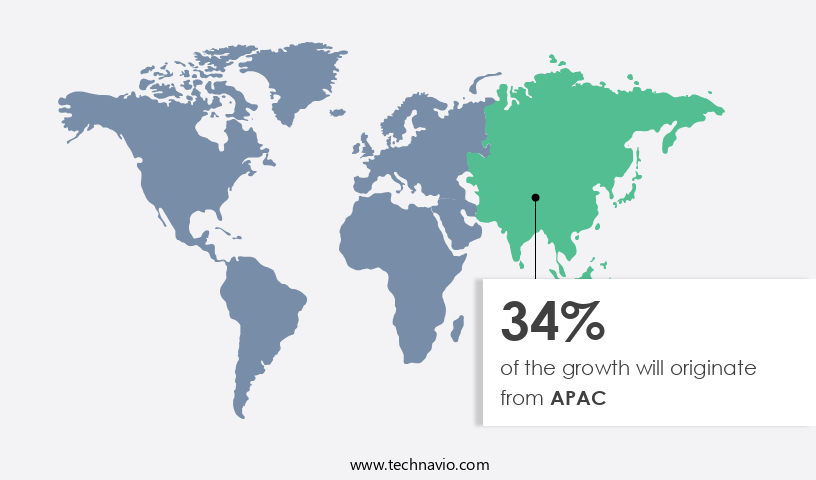
APAC is estimated to contribute 34% to the growth of the global market during the forecast period. Technavio's analysts have elaborately explained the regional trends and drivers that shape the market during the forecast period.
Liner hangers are essential mechanical components used in drilling operations for securing casing strings in wellbores during both onshore and offshore exploration and production activities. These systems play a crucial role in maintaining well integrity and ensuring the safe and efficient production of crude oil and liquid fuels. Mechanical liner hangers, such as expandable and conventional types, are commonly utilized in various drilling techniques, including horizontal, directional, and vertical drilling. Offshore exploration and production projects, particularly deepwater and ultra-deepwater, rely heavily on liner hanger systems due to the unique challenges posed by these environments. Hydraulic fracturing and cementing processes also necessitate the use of the liner hangers. Reservoir formations, whether conventional or unconventional, require reliable liner hanger systems to ensure optimal crude oil production. As the world transitions towards low-carbon fuels and clean energy, climate risk financing and insurance solutions are increasingly important for offshore projects. Liner hanger systems, being a critical component of oilfield drilling equipment, are subject to these considerations. Three-high wells and three-low wells, drilled using durable materials, benefit from the use of advanced liner hanger technologies. In summary, liner hanger systems are indispensable in drilling operations, from onshore to offshore, shallow to deep-water exploration, and various drilling techniques. Their role in ensuring well integrity, maintaining production efficiency, and adapting to the evolving energy landscape makes them a vital investment for petroleum companies.
Segment Overview
The market research report provides comprehensive data (region-wise segment analysis), with forecasts and estimates in "USD million " for the period 2024-2028, as well as historical data from 2018-2022 for the following segments.
- Application Outlook
- Onshore
- Ofshore
- Region Outlook
- APAC
- China
- India
- North America
- The U.S.
- Canada
- Europe
- The U.K.
- Germany
- France
- Rest of Europe
- South America
- Brazil
- Argentina
- Chile
- Middle East & Africa
- Saudi Arabia
- South Africa
- Rest of the Middle East & Africa
- APAC
Market Analyst Overview
Liner hangers are essential mechanical components used in drilling operations for securing casing strings in wellbores during both onshore and offshore exploration and production activities. These systems play a crucial role in maintaining the integrity of the wellbore and ensuring the safe and efficient operation of rigs. Liner hangers come in various types, including mechanical and expandable, designed to cater to different drilling techniques such as horizontal, directional, and vertical drilling. In the context of deep-water exploration, liner hangers are employed in three-high wells and three-low wells to ensure the secure installation of casing strings in ultra-deepwater reservoir formations.
Furthermore, the market encompasses a wide range of applications, from crude oil production to hydraulic fracturing and cementing. With the increasing focus on low-carbon fuels and clean energy fuels, the demand for liner hangers in offshore projects is expected to grow, especially in the context of climate risk financing and insurance solutions. The production equipment market for liner hangers is expected to witness significant growth due to the increasing demand for petroleum products and liquid fuels. The market for liner hangers is expected to remain dynamic, with ongoing advancements in materials and technologies. In summary, liner hangers are essential components in the upstream offshore exploration industry, ensuring the safe and efficient operation of rigs and the secure installation of casing strings in various drilling techniques and reservoir formations. The market for liner hangers is expected to grow in response to the increasing demand for crude oil, liquid fuels, and the transition towards low-carbon and clean energy fuels.
|
Market Scope |
|
|
Report Coverage |
Details |
|
Page number |
147 |
|
Base year |
2023 |
|
Historic period |
2018-2022 |
|
Forecast period |
2024-2028 |
|
Growth momentum & CAGR |
Accelerate at a CAGR of 3.27% |
|
Market growth 2024-2028 |
USD 561.2 million |
|
Market structure |
Fragmented |
|
YoY growth 2023-2024(%) |
3.13 |
|
Regional analysis |
North America, APAC, Middle East and Africa, Europe, and South America |
|
Performing market contribution |
APAC at 34% |
|
Key countries |
US, China, Russia, Canada, and Saudi Arabia |
|
Competitive landscape |
Leading Companies, Market Positioning of Companies, Competitive Strategies, and Industry Risks |
|
Key companies profiled |
Allamon Tool Co Inc., Baker Hughes Co., BOTIL Oil Tools India Pvt. Ltd., DEW Wartungs und Reparatur GmbH, Dril Quip Inc., Halliburton Co., Innovex, Maximus Completion Systems, NCS Multistage Holdings Inc, NOV Inc., Packers Plus Energy Services Inc., Peak Completion Technologies Inc., Saga-PCE Pte. Ltd., SAZ Oilfield Services Pte. Ltd., Schlumberger Ltd., TANGENTOG EQUIPMENT AND SUPPLY PVT. Ltd., Tianjin Elegant Technology Co. Ltd., Weatherford International Plc, Well Innovation AS, and Wellcare Oil Tools Pvt. Ltd. |
|
Market dynamics |
Parent market analysis, Market Forecasting, Market growth inducers and obstacles, Fast-growing and slow-growing segment analysis, Market growth and Forecasting, COVID 19 impact and recovery analysis and future consumer dynamics, Market condition analysis for market forecast period |
|
Customization purview |
If our report has not included the data that you are looking for, you can reach out to our analysts and get segments customized. |
What are the Key Data Covered in this Market Report?
- CAGR of the market during the forecast period
- Detailed information on factors that will drive the market growth and forecasting of the market between 2024 and 2028
- Precise estimation of the size of the market size and its contribution to the parent market
- Accurate predictions about upcoming market trends and analysis and changes in consumer behavior
- Growth of the market industry across Europe, North America, APAC, South America, and Middle East and Africa
- Thorough market growth analysis of the market's competitive landscape and detailed information about companies
- Comprehensive market analysis and report on the factors that will challenge the market research and growth of market companies
 RIA -
RIA - 
