
Machine Translation Market Size 2026-2030
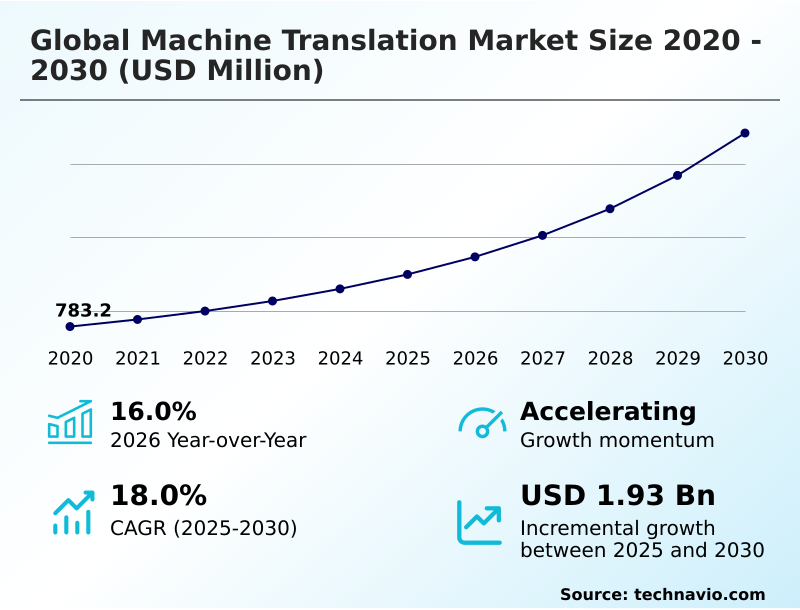
The machine translation market size is valued to increase by USD 1.93 billion, at a CAGR of 18% from 2025 to 2030. Institutionalization of LLM integration and multilingual content generation will drive the machine translation market.
Major Market Trends & Insights
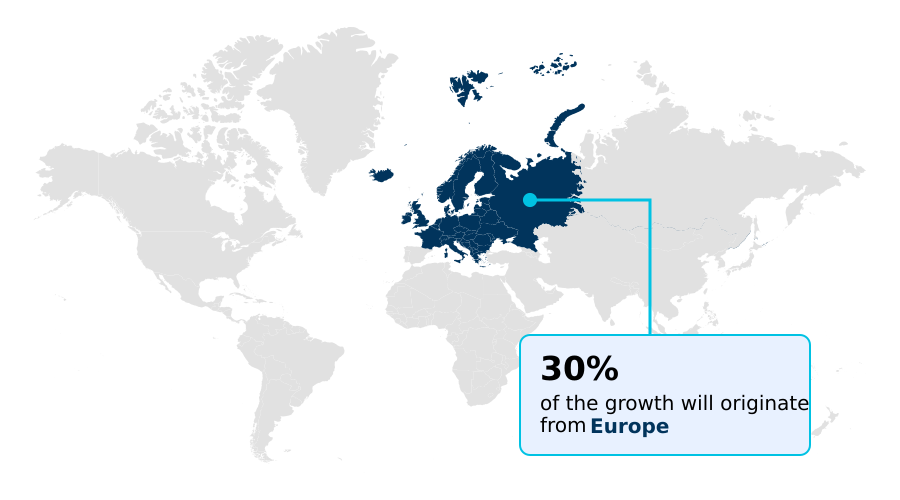
- Europe dominated the market and accounted for a 30% growth during the forecast period.
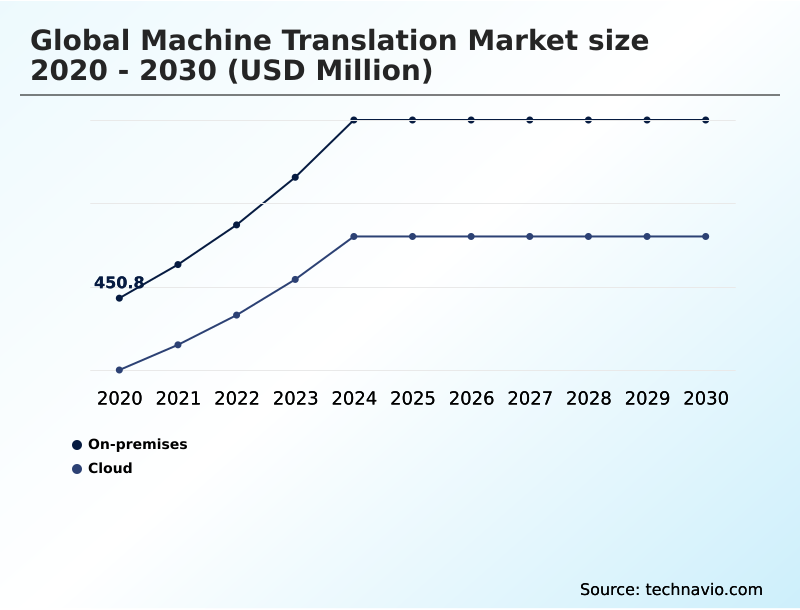
- By Deployment - On-premises segment was valued at USD 744.5 million in 2024
- By Application - Defense segment accounted for the largest market revenue share in 2024
Market Size & Forecast
- Market Opportunities: USD 2.64 billion
- Market Future Opportunities: USD 1.93 billion
- CAGR from 2025 to 2030 : 18%
Market Summary
- The machine translation market is undergoing a profound structural expansion, evolving from a basic tool for gist-based comprehension into a sophisticated enterprise asset. This growth is driven by the convergence of large language models and neural network architectures, which have significantly elevated the standard for linguistic fluency and contextual accuracy.
- This technology operates through computational linguistics, with Neural Machine Translation (NMT) utilizing deep learning to predict word sequences based on vast datasets. By processing entire sentences, these systems achieve high grammatical accuracy. This maturation is accelerated by adaptive artificial intelligence, which allows translation engines to learn from user edits.
- For instance, in cross-border e-commerce, real-time localization allows businesses to deliver culturally resonant content to a global audience, facilitating everything from legal documentation to multilingual collaboration. The integration of voice-to-voice translation and document-level coherence has expanded utility into high-stakes sectors like healthcare and defense, making machine translation a cornerstone of global communication infrastructure.
What will be the Size of the Machine Translation Market during the forecast period?
Get Key Insights on Market Forecast (PDF) Get Free Sample
How is the Machine Translation Market Segmented?
The machine translation industry research report provides comprehensive data (region-wise segment analysis), with forecasts and estimates in "USD million" for the period 2026-2030, as well as historical data from 2020-2024 for the following segments.
- Deployment
- On-premises
- Cloud
- Application
- Defense
- IT
- Automotive
- Healthcare
- Technology
- SMT
- NMT
- RBMT
- HMT
- EBMT
- Usage
- H2M translation
- M2M translation
- Geography
- North America
- US
- Canada
- Mexico
- Europe
- Germany
- UK
- France
- APAC
- China
- Japan
- South Korea
- South America
- Brazil
- Argentina
- Middle East and Africa
- Saudi Arabia
- UAE
- South Africa
- Rest of World (ROW)
- North America
By Deployment Insights
The on-premises segment is estimated to witness significant growth during the forecast period.
On-premise translation solutions are critical for organizations with stringent data sovereignty mandates.
This deployment, involving software installation on private servers, ensures all linguistic data remains within the corporate firewall, a non-negotiable requirement for sectors like defense and finance to mitigate intellectual property protection risks.
These air-gapped translation solutions provide absolute control, allowing for deep brand-specific customization of neural machine translation models without external data exposure. This enables enterprises to build highly specialized engines that reflect unique corporate terminologies and achieve over 95% terminology accuracy.
The focus on a secure translation pipeline and on-premise translation is crucial for digital single market compliance.
As international data privacy regulations tighten, these isolated, high-performance hubs, offering robust document-level coherence and an adaptive learning layer, remain a vital market segment for handling sensitive content.
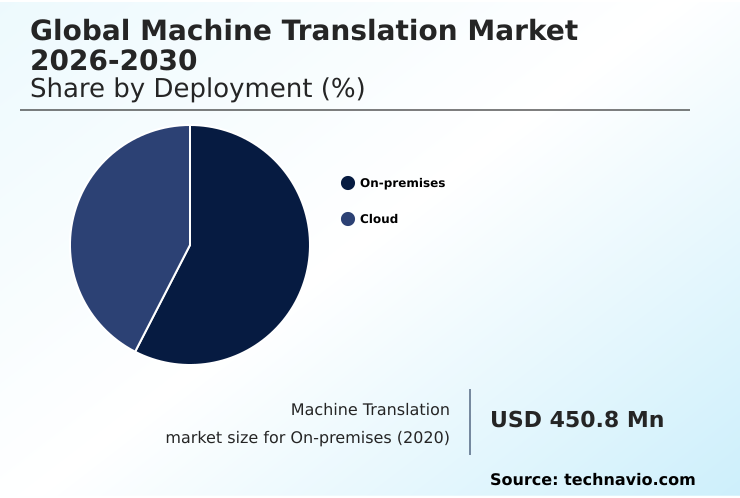
The On-premises segment was valued at USD 744.5 million in 2024 and showed a gradual increase during the forecast period.
Regional Analysis
Europe is estimated to contribute 30% to the growth of the global market during the forecast period.Technavio’s analysts have elaborately explained the regional trends and drivers that shape the market during the forecast period.
See How Machine Translation Market Demand is Rising in Europe Get Free Sample
The geographic landscape of the machine translation market is diverse, with North America, Europe, and APAC serving as the primary hubs.
North America, a leader in AI development, benefits from its concentration of hyperscale data centers and strong venture capital investment.
Europe represents a mature segment, where the need for multilingualism is embedded in its regulatory framework, driving demand for high-accuracy tools that meet strict data sovereignty requirements. Europe accounts for 30% of the market's incremental growth.
However, APAC is the fastest-growing region, with a 19.1% CAGR, fueled by rapid digital transformation and the expansion of cross-border e-commerce.
This region is a center for innovation in multimodal speech translation and on-device translation, driven by the need to support low-resource languages and a massive, mobile-first user base utilizing enterprise resource planning systems.
Market Dynamics
Our researchers analyzed the data with 2025 as the base year, along with the key drivers, trends, and challenges. A holistic analysis of drivers will help companies refine their marketing strategies to gain a competitive advantage.
- Strategic deployment decisions in the machine translation market increasingly balance multiple factors beyond simple text conversion. The debate over on-premise vs cloud machine translation security continues as organizations weigh the benefits of data control against the scalability of cloud platforms.
- Measuring machine translation quality with BLEU scores is standard, but enterprises now demand deeper insights into achieving contextual nuance in automated translation, which is crucial for brand voice. The impact of transformer models on translation has been profound, making the technology viable for complex tasks.
- This has led to the rise of specialized applications, such as customizing NMT for legal document review and deploying machine translation for global marketing, where terminological precision is paramount. Real-time speech translation for customer support and the use of multimodal translation for virtual meetings are now competitive differentiators.
- Consequently, improving translation quality with post-editing and leveraging machine translation for multilingual e-commerce have become core operational strategies, with some companies reporting a 30% reduction in time-to-market for localized products. The role of human-in-the-loop in AI translation remains vital for validating outputs and managing the ethical considerations in training translation models.
- As machine translation API integration strategies mature, the focus shifts to automated quality estimation in localization and effectively managing terminology in neural machine translation to tackle the challenges of translating low-resource languages and ensuring data sovereignty compliance in machine translation.
What are the key market drivers leading to the rise in the adoption of Machine Translation Industry?
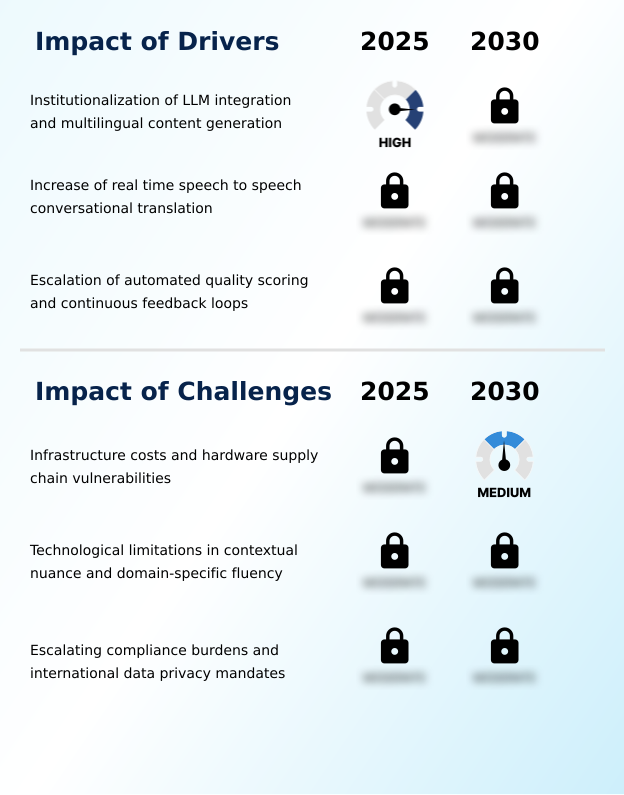
- The institutionalization of Large Language Model (LLM) integration for end-to-end multilingual content generation is a primary driver for the market.
- A primary market driver is the institutionalization of large language models (LLMs), which are transitioning the industry toward sophisticated, end-to-end multilingual content generation.
- Enterprise-level organizations are adopting generative and adaptive neural architectures that can adjust tone and style in real time, significantly reducing time-to-market for global product launches by over 30%. This shift integrates translation directly into content management systems and localization workflows.
- The ability of these models to process context beyond a single sentence has resolved historical issues related to linguistic consistency.
- As firms prioritize the automation of their content pipelines, the demand for these context-aware units, which facilitate unified communication and offer domain-specific fluency through computational linguistics, is growing exponentially.
- The use of a quality signal to automate reviews further enhances efficiency.
What are the market trends shaping the Machine Translation Industry?
- Advancements in real-time multimodal speech translation are emerging as a key market trend, integrating text, audio, and visual cues into a unified communication stream.
- The market is rapidly advancing toward real-time multimodal translation, integrating text, audio, and visual cues. Driven by the decline of hardware-based devices, this trend favors cloud-native and edge solutions that facilitate instantaneous multilingual dialogue with sub-second latency, a critical need for global conferences and customer support.
- For instance, the implementation of 5G-Standalone networks in Europe provides the low-latency infrastructure to support these data-heavy streams. Advances in natural language processing and automatic speech recognition are enabling not just linguistic accuracy but also the preservation of a speaker's vocal identity and emotional intent, with some end-to-end speech-to-speech models achieving this with less than three seconds of delay.
- This industrialization of multimodal capabilities, including human-to-machine translation and machine-to-machine translation, is becoming a fundamental requirement for enterprises, with a 40% increase in adoption for such integrated systems.
What challenges does the Machine Translation Industry face during its growth?
- The combination of high infrastructure costs and hardware supply chain vulnerabilities presents a key challenge affecting industry growth.
- A significant challenge is the escalating burden of regulatory compliance and protecting sensitive information across borders. The impending implementation of regulations like the European Union's AI Act, scheduled for August 2026, mandates unprecedented transparency and security for AI-powered systems.
- This forces providers to overhaul data handling practices and invest in localized server infrastructure to meet strict data sovereignty and international data privacy mandates. Maintaining a secure, end-to-end encrypted pipeline for language operations platform is significantly more expensive than standard cloud hosting, with costs increasing by up to 40% for compliant systems.
- The risk of training data containing personally identifiable information remains a major legal hurdle for developers of large language models, making verifiable credentials and human-in-the-loop oversight essential for mitigating risks in high-stakes sectors.
Exclusive Technavio Analysis on Customer Landscape
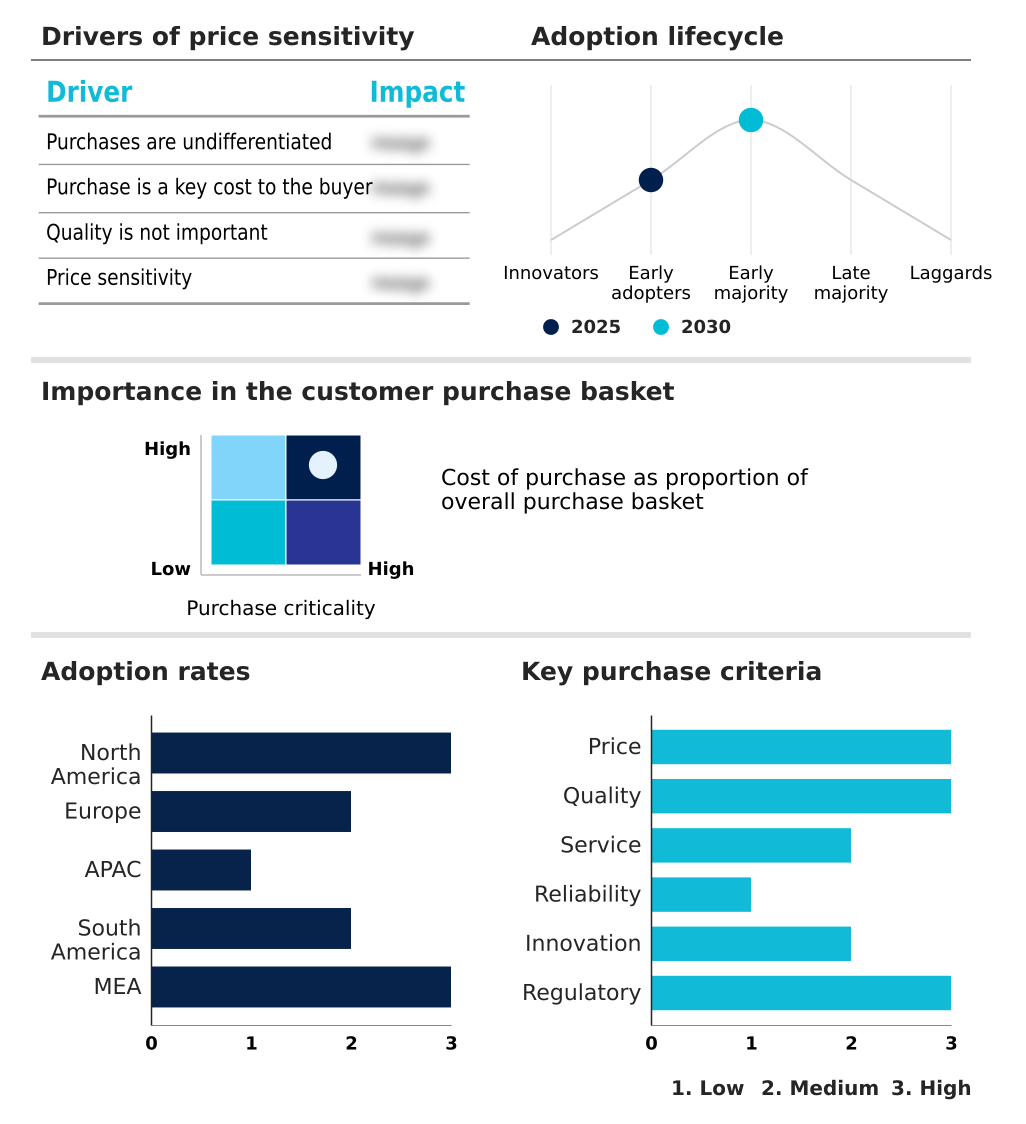
The machine translation market forecasting report includes the adoption lifecycle of the market, covering from the innovator’s stage to the laggard’s stage. It focuses on adoption rates in different regions based on penetration. Furthermore, the machine translation market report also includes key purchase criteria and drivers of price sensitivity to help companies evaluate and develop their market growth analysis strategies.
Customer Landscape of Machine Translation Industry
Competitive Landscape
Companies are implementing various strategies, such as strategic alliances, machine translation market forecast, partnerships, mergers and acquisitions, geographical expansion, and product/service launches, to enhance their presence in the industry.
Amazon.com Inc. - Delivering enterprise-grade neural machine translation solutions that enable secure, scalable, and real-time multilingual content workflows for global business operations.
The industry research and growth report includes detailed analyses of the competitive landscape of the market and information about key companies, including:
- Amazon.com Inc.
- AppTek
- Baidu Inc.
- DeepL SE
- Globalese
- Google LLC
- IBM Corp.
- KantanAI
- LILT Inc.
- Meta Platforms Inc.
- Microsoft Corp.
- Mirai Translate Inc.
- Nordicwise Ltd
- Omniscien Technologies
- Prompsit Language Engineering
- RWS Holdings PLC
- SYSTRAN SA
- Tencent Holdings Ltd.
- Translated S.r.l.
- Unbabel Inc.
- Yandex NV
Qualitative and quantitative analysis of companies has been conducted to help clients understand the wider business environment as well as the strengths and weaknesses of key industry players. Data is qualitatively analyzed to categorize companies as pure play, category-focused, industry-focused, and diversified; it is quantitatively analyzed to categorize companies as dominant, leading, strong, tentative, and weak.
Recent Development and News in Machine translation market
- In January 2025, Xiaohongshu launched an advanced real-time translation feature engineered to decode and explain complex internet slang and colloquialisms between Chinese and English, enhancing user engagement in social environments.
- In February 2025, Google LLC introduced AI-powered updates to its Translate ecosystem, providing an interactive, assistant-like experience that offers alternative phrasings and detailed explanations of tone and nuance.
- In March 2025, RWS Holdings PLC unveiled Language Weaver Pro, an enterprise-grade AI translation solution featuring over one hundred billion parameters, specifically engineered for business-critical and regulated content.
- In April 2025, DeepL SE announced the general release of DeepL Voice-to-Voice, a suite that facilitates seamless spoken communication across virtual and in-person settings by integrating real-time voice transcription with advanced neural translation.
Dive into Technavio’s robust research methodology, blending expert interviews, extensive data synthesis, and validated models for unparalleled Machine Translation Market insights. See full methodology.
| Market Scope | |
|---|---|
| Page number | 321 |
| Base year | 2025 |
| Historic period | 2020-2024 |
| Forecast period | 2026-2030 |
| Growth momentum & CAGR | Accelerate at a CAGR of 18% |
| Market growth 2026-2030 | USD 1927.9 million |
| Market structure | Fragmented |
| YoY growth 2025-2026(%) | 16.0% |
| Key countries | US, Canada, Mexico, Germany, UK, France, Italy, Spain, The Netherlands, China, Japan, South Korea, India, Indonesia, Australia, Brazil, Argentina, Chile, Saudi Arabia, UAE, South Africa, Israel and Turkey |
| Competitive landscape | Leading Companies, Market Positioning of Companies, Competitive Strategies, and Industry Risks |
Research Analyst Overview
- The machine translation market has transitioned from a utility to a strategic enterprise asset, driven by advancements in neural machine translation and large language models. The adoption of the transformer model has revolutionized linguistic fluency and enabled document-level coherence, while generative architectures are pushing the boundaries of contextual nuance and voice preservation.
- This technological shift is underpinned by high-performance GPUs and AI accelerators, making low-latency processing for multimodal speech translation a reality. However, this reliance creates challenges related to hardware costs. In response, on-device translation and edge-based translation are gaining traction, addressing both performance and data sovereignty concerns.
- Enterprises are implementing sophisticated post-editing workflows and agentic workflows that leverage an adaptive learning layer for continuous improvement. Key considerations now include model interpretability, mitigating algorithmic hallucinations, and ensuring terminology accuracy through quality estimation metrics.
- The strategic focus has moved toward zero-shot translation capabilities, supported by high-quality bilingual corpora and robust ethical AI governance to navigate the complexities of global data regulations, with private cloud translation, on-premise translation, and air-gapped translation solutions becoming essential for regulated industries.
What are the Key Data Covered in this Machine Translation Market Research and Growth Report?
-
What is the expected growth of the Machine Translation Market between 2026 and 2030?
-
USD 1.93 billion, at a CAGR of 18%
-
-
What segmentation does the market report cover?
-
The report is segmented by Deployment (On-premises, and Cloud), Application (Defense, IT, Automotive, and Healthcare), Technology (SMT, NMT, RBMT, HMT, and EBMT), Usage (H2M translation, and M2M translation) and Geography (North America, Europe, APAC, South America, Middle East and Africa)
-
-
Which regions are analyzed in the report?
-
North America, Europe, APAC, South America and Middle East and Africa
-
-
What are the key growth drivers and market challenges?
-
Institutionalization of LLM integration and multilingual content generation, Infrastructure costs and hardware supply chain vulnerabilities
-
-
Who are the major players in the Machine Translation Market?
-
Amazon.com Inc., AppTek, Baidu Inc., DeepL SE, Globalese, Google LLC, IBM Corp., KantanAI, LILT Inc., Meta Platforms Inc., Microsoft Corp., Mirai Translate Inc., Nordicwise Ltd, Omniscien Technologies, Prompsit Language Engineering, RWS Holdings PLC, SYSTRAN SA, Tencent Holdings Ltd., Translated S.r.l., Unbabel Inc. and Yandex NV
-
Market Research Insights
- The market is undergoing a structural expansion driven by the institutionalization of Large Language Models (LLMs) and the demand for sophisticated multilingual content generation. Organizations are transitioning to generative architectures that provide interactive refinement and adjust for cultural nuance in real time, a shift that improves localization workflows by over 25%.
- This evolution allows for high-quality content creation with minimal human-in-the-loop oversight. The proliferation of real-time, end-to-end speech-to-speech models, capable of sub-three-second latency, is removing linguistic barriers in global collaboration.
- The market's momentum is underscored by Europe's contribution, which accounts for 30% of the incremental growth, reflecting the region's high demand for unified communication platforms that comply with stringent data privacy rules.
We can help! Our analysts can customize this machine translation market research report to meet your requirements.
 RIA -
RIA - 
