
AI Accelerators Market Size 2026-2030
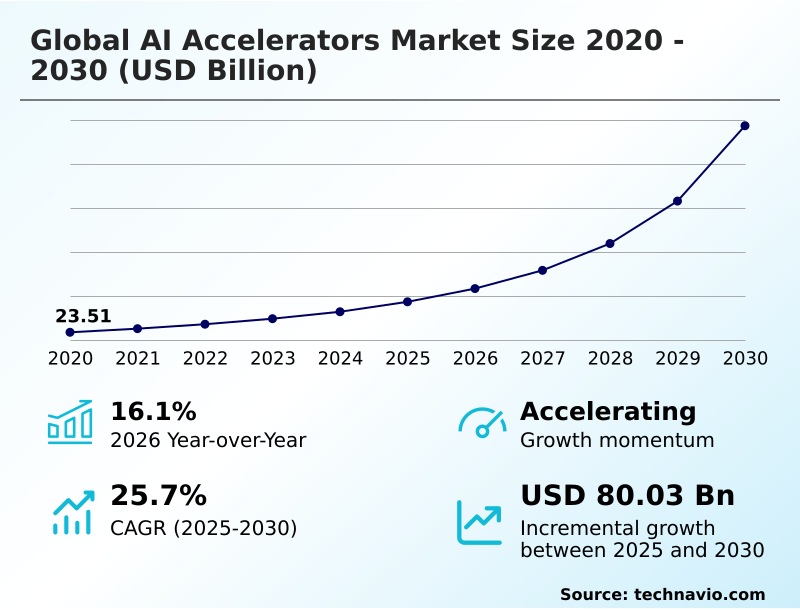
The ai accelerators market size is valued to increase by USD 80.03 billion, at a CAGR of 25.7% from 2025 to 2030. Increasing large language model complexity and parameter density will drive the ai accelerators market.
Major Market Trends & Insights
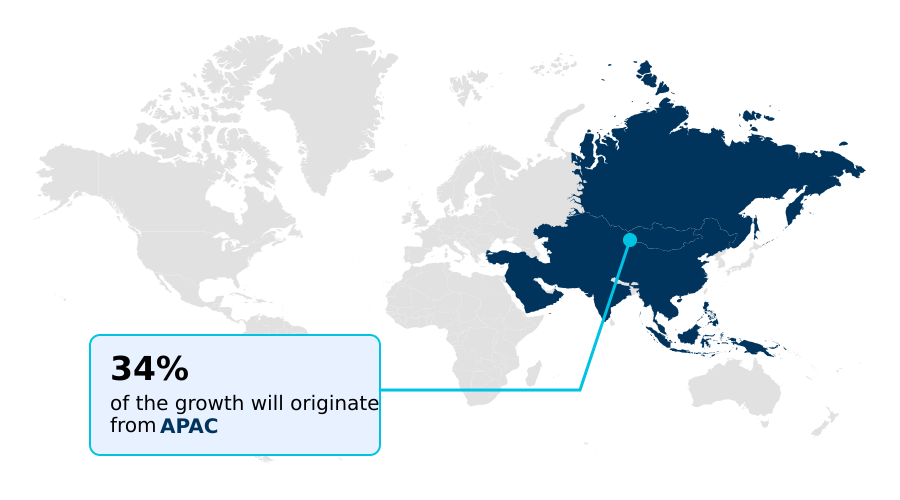
- APAC dominated the market and accounted for a 34.2% growth during the forecast period.
- By Product - ASIC segment was valued at USD 12.74 billion in 2024
- By Deployment - On-premises segment accounted for the largest market revenue share in 2024
Market Size & Forecast
- Market Opportunities: USD 93.89 billion
- Market Future Opportunities: USD 80.03 billion
- CAGR from 2025 to 2030 : 25.7%
Market Summary
- The AI accelerators market is undergoing a significant transformation as industries move beyond general-purpose processors to handle sophisticated computational tasks. This evolution is driven by the intensive requirements of neural network training and large language model training, which demand specialized hardware such as application-specific integrated circuits and field-programmable gate arrays.
- These technologies are engineered for parallel processing and tensor processing, delivering the high-performance computing necessary for deep learning workloads. For example, in logistics, a company can deploy edge AI processing on autonomous delivery drones, utilizing vision processing units for real-time object detection and navigation.
- This on-device AI processing not only reduces latency by eliminating the need for cloud communication but also enhances operational efficiency and safety.
- The market's trajectory is shaped by the continuous need for greater computational power, improved power usage effectiveness, and architectures like system-on-chip that can support complex AI hardware for robotics and scalable AI compute, moving towards a future of ubiquitous, accelerated intelligence. The development of AI accelerator benchmarks is also becoming critical for performance evaluation.
What will be the Size of the AI Accelerators Market during the forecast period?
Get Key Insights on Market Forecast (PDF) Get Free Sample
How is the AI Accelerators Market Segmented?
The ai accelerators industry research report provides comprehensive data (region-wise segment analysis), with forecasts and estimates in "USD million" for the period 2026-2030, as well as historical data from 2020-2024 for the following segments.
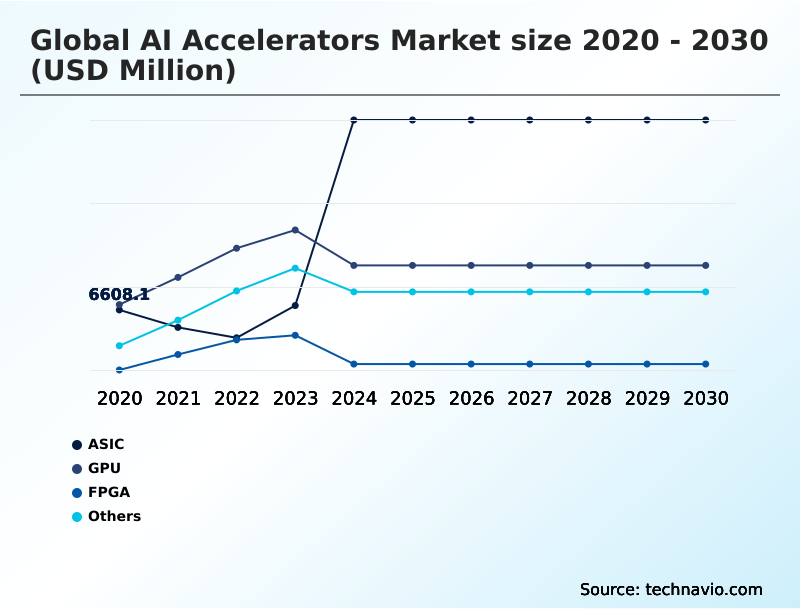
- Product
- ASIC
- GPU
- FPGA
- Others
- Deployment
- On-premises
- Cloud
- Edge AI
- System-on-chip (SoC)
- End-user
- Automotive
- IT and telecom
- Healthcare
- BFSI
- Others
- Geography
- North America
- US
- Canada
- Mexico
- APAC
- China
- Japan
- India
- Europe
- Germany
- UK
- France
- South America
- Brazil
- Argentina
- Colombia
- Middle East and Africa
- Saudi Arabia
- UAE
- Israel
- Rest of World (ROW)
- North America
By Product Insights
The asic segment is estimated to witness significant growth during the forecast period.
The AI accelerators market is segmented by product, deployment, and end-user, reflecting a dynamic shift toward specialized hardware.
In the product segment, application-specific integrated circuits (ASICs) represent a significant move toward custom silicon for AI, tailored for specific neural network workloads. This customization is crucial for AI inference at the edge, where firms are achieving superior performance.
For instance, the deployment of custom ASICs has led to a 4x efficiency improvement in processing recommendation algorithms. This trend underscores the move away from general-purpose hardware toward solutions optimized for deep learning workloads and low-latency inference.
Key technologies like digital signal processing and in-memory computing are defining the competitive landscape, influencing AI accelerator performance metrics and AI hardware for autonomous systems.
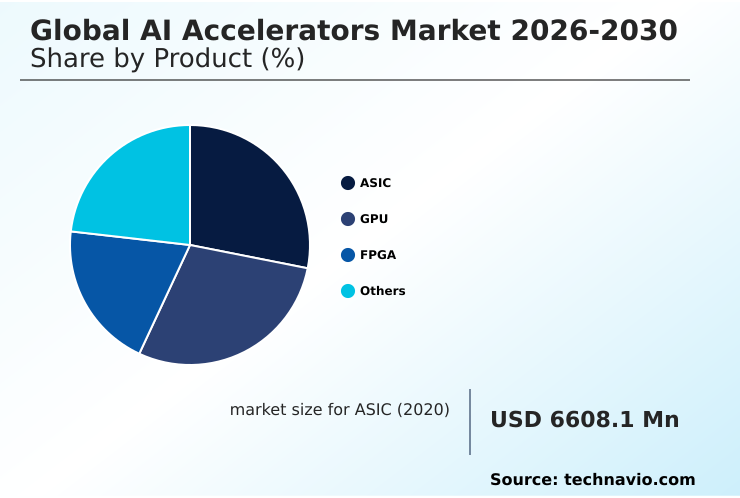
The ASIC segment was valued at USD 12.74 billion in 2024 and showed a gradual increase during the forecast period.
Regional Analysis
APAC is estimated to contribute 34.2% to the growth of the global market during the forecast period.Technavio’s analysts have elaborately explained the regional trends and drivers that shape the market during the forecast period.
See How AI Accelerators Market Demand is Rising in APAC Get Free Sample
The geographic landscape of the AI accelerators market is led by North America, which is a hub for high-performance computing and hyperscale data centers. This region benefits from a robust ecosystem supporting large language model training and generative AI inference.
Meanwhile, APAC is critical to the AI chip supply chain, housing the world's most advanced semiconductor fabrication facilities and expanding at a rate of 27.3%.
Europe is focused on achieving digital sovereignty, emphasizing sustainable and sovereign AI infrastructure with an expansion rate of 26.5%. This has led to investments in regional chip design and manufacturing capabilities, with a focus on hardware-software co-design.
This regional diversification highlights a global market where AI accelerator for smart cities and AI accelerator for IoT devices are becoming key application areas, driven by distinct regional priorities and strengths.
Market Dynamics
Our researchers analyzed the data with 2025 as the base year, along with the key drivers, trends, and challenges. A holistic analysis of drivers will help companies refine their marketing strategies to gain a competitive advantage.
- Strategic decision-making in the AI accelerators market is becoming increasingly complex as organizations weigh multiple technical and economic factors. The debate over FPGA versus GPU for real-time inference remains central for applications requiring low latency, while the high upfront cost of ASIC design for large language models presents a significant barrier for many.
- The challenges in the AI hardware supply chain, exacerbated by geopolitical shifts, force companies to rethink their sourcing strategies. A critical emerging consideration is the environmental impact of large-scale AI training, which is closely tied to the power consumption of AI training clusters.
- Consequently, businesses are exploring the benefits of liquid cooling for AI accelerators, which can improve thermal management and enable higher-density deployments. The impact of silicon photonics on data centers is another area of focus, promising to alleviate data transfer bottlenecks.
- For many, optimizing AI workloads on custom silicon is the ultimate goal, but this requires navigating the difficult issue of software compatibility for different AI accelerators. The role of AI accelerators in autonomous vehicles continues to expand, shaping the future of edge AI hardware.
- Firms that successfully integrate these technologies report significant competitive advantages, with some achieving up to a 20% reduction in model deployment times compared to those using general-purpose hardware.
What are the key market drivers leading to the rise in the adoption of AI Accelerators Industry?
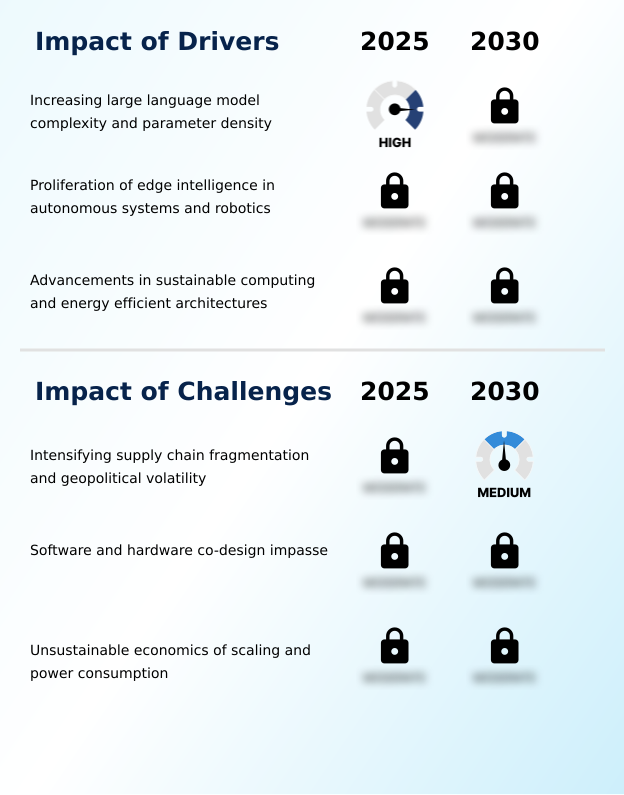
- The increasing complexity and parameter density of large language models is a key driver for the market.
- Market growth is primarily driven by the exponential expansion of generative AI and the proliferation of large language models, which demand specialized hardware for both training and inference.
- The need for energy-efficient AI hardware is a second major driver, pushing the industry toward sustainable computing and architectures that maximize operations per watt. This focus on efficiency reduces the total cost of ownership, a compelling value proposition for enterprises.
- For instance, new architectures can reduce the energy consumption of large-scale inference by a factor of 20. A third critical driver is the proliferation of edge intelligence in autonomous systems and robotics.
- The requirement for on-device AI processing with near-zero latency has led to the development of specialized chips capable of delivering over one thousand trillion operations per second within strict thermal limits, enabling AI hardware for industrial automation.
What are the market trends shaping the AI Accelerators Industry?
- A key market trend is the proliferation of vertical integration. This involves a strategic shift toward custom, application-specific integrated circuits to optimize performance.
- Key market trends are reshaping the AI hardware architecture landscape. The move toward vertical integration and custom silicon for AI allows hyperscalers to achieve superior performance, with some reporting a 4x efficiency gain in processing recommendation algorithms.
- This trend is coupled with a critical focus on AI accelerator thermal management as individual processors now exceed one kilowatt, making advanced liquid cooling infrastructure a standard requirement. Furthermore, the industry is transitioning toward silicon photonics and photonic accelerator technology to overcome data movement bottlenecks.
- This shift to optical interconnects is crucial for scaling large clusters, enabling massive increases in bandwidth and significant reductions in energy loss. These trends collectively address the core challenges of scaling AI hardware for generative models and improving AI accelerator performance metrics.
What challenges does the AI Accelerators Industry face during its growth?
- Intensifying supply chain fragmentation and geopolitical volatility represent a key challenge affecting industry growth.
- The market faces significant challenges, including escalating supply chain fragmentation and geopolitical volatility, which disrupt the intricate global semiconductor ecosystem. This creates strategic risks and can lead to a balkanized market with competing technological standards. A second formidable challenge is the software-hardware co-design impasse.
- The proliferation of diverse accelerator designs with proprietary instruction sets has created a fragmented AI accelerator software ecosystem, stifling portability and locking users into single-vendor platforms. The formal disbanding of a consortium after two years of effort highlights this deep-seated issue.
- Finally, the unsustainable economics of scaling, with fabrication facility costs reaching tens of billions, and escalating power consumption create a high barrier to entry and threaten the long-term viability of traditional scaling.
Exclusive Technavio Analysis on Customer Landscape
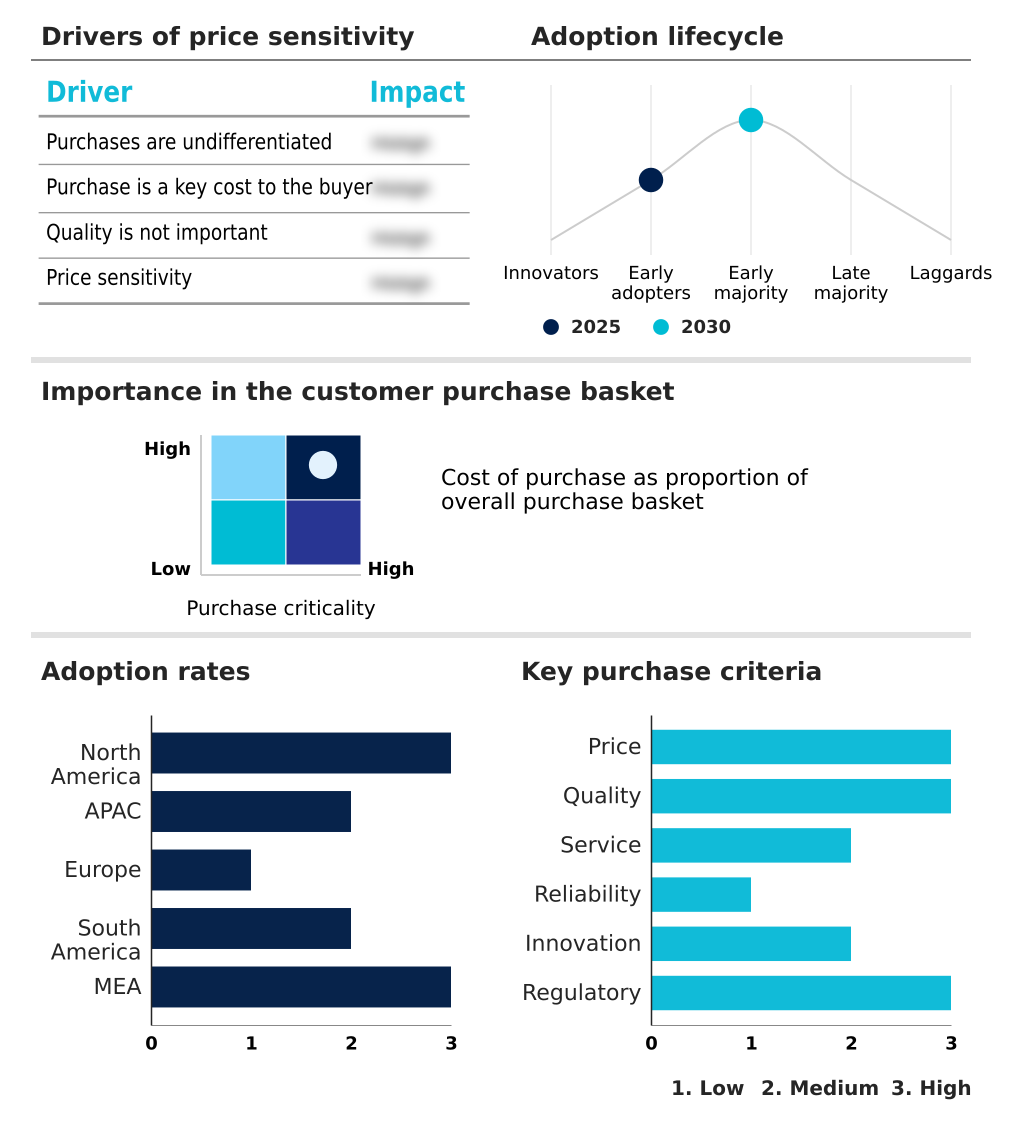
The ai accelerators market forecasting report includes the adoption lifecycle of the market, covering from the innovator’s stage to the laggard’s stage. It focuses on adoption rates in different regions based on penetration. Furthermore, the ai accelerators market report also includes key purchase criteria and drivers of price sensitivity to help companies evaluate and develop their market growth analysis strategies.
Customer Landscape of AI Accelerators Industry
Competitive Landscape
Companies are implementing various strategies, such as strategic alliances, ai accelerators market forecast, partnerships, mergers and acquisitions, geographical expansion, and product/service launches, to enhance their presence in the industry.
Advanced Micro Devices Inc. - The company offers specialized AI accelerators engineered for large-scale model training and high-throughput inference workloads, addressing complex computational demands.
The industry research and growth report includes detailed analyses of the competitive landscape of the market and information about key companies, including:
- Advanced Micro Devices Inc.
- Amazon Web Services Inc.
- Arm Ltd.
- Baidu Inc.
- Blaize
- Cerebras Systems Inc.
- d Matrix Corp.
- EnCharge AI Inc.
- Google LLC
- Graphcore Ltd.
- Groq Inc.
- Huawei Technologies Co. Ltd.
- Intel Corp.
- Microsoft Corp.
- Mythic Inc.
- NVIDIA Corp.
- Qualcomm Inc.
- Rebellions Inc.
- SambaNova Systems Inc.
- Tenstorrent Inc.
Qualitative and quantitative analysis of companies has been conducted to help clients understand the wider business environment as well as the strengths and weaknesses of key industry players. Data is qualitatively analyzed to categorize companies as pure play, category-focused, industry-focused, and diversified; it is quantitatively analyzed to categorize companies as dominant, leading, strong, tentative, and weak.
Recent Development and News in Ai accelerators market
- In August 2025, Schneider Electric entered a comprehensive strategic agreement with Advanced Micro Devices to standardize modular liquid cooling racks specifically designed for the Instinct MI400 series of accelerators.
- In May 2025, Microsoft Corporation announced the full operational deployment of its second-generation Maia AI accelerator across its North American data centers to reduce reliance on external hardware companies.
- In April 2025, Meta Platforms announced the full-scale deployment of the third-generation Meta Training and Inference Accelerator across its global infrastructure, achieving four times the efficiency of previous commercial offerings.
- In March 2025, NVIDIA Corporation officially commenced the global distribution of the Blackwell B200 Ultra architecture, a hardware platform engineered to support the training of models exceeding ten trillion parameters.
Dive into Technavio’s robust research methodology, blending expert interviews, extensive data synthesis, and validated models for unparalleled AI Accelerators Market insights. See full methodology.
| Market Scope | |
|---|---|
| Page number | 313 |
| Base year | 2025 |
| Historic period | 2020-2024 |
| Forecast period | 2026-2030 |
| Growth momentum & CAGR | Accelerate at a CAGR of 25.7% |
| Market growth 2026-2030 | USD 80028.3 million |
| Market structure | Fragmented |
| YoY growth 2025-2026(%) | 16.1% |
| Key countries | US, Canada, Mexico, China, Japan, India, South Korea, Singapore, Malaysia, Germany, UK, France, Italy, Spain, Russia, Brazil, Argentina, Colombia, Saudi Arabia, UAE, Israel, South Africa and Egypt |
| Competitive landscape | Leading Companies, Market Positioning of Companies, Competitive Strategies, and Industry Risks |
Research Analyst Overview
- The AI accelerators market is defined by a relentless pursuit of computational efficiency, moving decisively away from legacy processors toward specialized silicon. The industry is characterized by the widespread adoption of technologies like high-bandwidth memory and advanced optical interconnects, which are essential for managing increasingly complex inference workloads.
- Architectures such as wafer-scale engines and reconfigurable dataflow units are no longer theoretical, becoming central to strategies for achieving scalable AI compute.
- For boardroom consideration, the investment in custom silicon represents a pivotal decision; for example, developing proprietary application-specific integrated circuits has enabled some firms to achieve a 4x improvement in the efficiency of processing recommendation algorithms, directly impacting revenue-generating services.
- This shift necessitates a strategic balance between the high capital expenditure for semiconductor fabrication and the long-term benefits of optimized hardware-software co-design. The focus on metrics like power usage effectiveness and thermal design power reflects a maturing market where operational costs and sustainability are as important as raw performance, influencing everything from liquid cooling infrastructure to system-on-chip design.
What are the Key Data Covered in this AI Accelerators Market Research and Growth Report?
-
What is the expected growth of the AI Accelerators Market between 2026 and 2030?
-
USD 80.03 billion, at a CAGR of 25.7%
-
-
What segmentation does the market report cover?
-
The report is segmented by Product (ASIC, GPU, FPGA, and Others), Deployment (On-premises, Cloud, Edge AI, and System-on-chip (SoC)), End-user (Automotive, IT and telecom, Healthcare, BFSI, and Others) and Geography (North America, APAC, Europe, South America, Middle East and Africa)
-
-
Which regions are analyzed in the report?
-
North America, APAC, Europe, South America and Middle East and Africa
-
-
What are the key growth drivers and market challenges?
-
Increasing large language model complexity and parameter density, Intensifying supply chain fragmentation and geopolitical volatility
-
-
Who are the major players in the AI Accelerators Market?
-
Advanced Micro Devices Inc., Amazon Web Services Inc., Arm Ltd., Baidu Inc., Blaize, Cerebras Systems Inc., d Matrix Corp., EnCharge AI Inc., Google LLC, Graphcore Ltd., Groq Inc., Huawei Technologies Co. Ltd., Intel Corp., Microsoft Corp., Mythic Inc., NVIDIA Corp., Qualcomm Inc., Rebellions Inc., SambaNova Systems Inc. and Tenstorrent Inc.
-
Market Research Insights
- The market's dynamics are shaped by a strategic pivot to specialized hardware, where performance is paramount. Organizations are leveraging custom silicon for AI to enhance data center AI acceleration, with some achieving a 20x reduction in energy consumption for large-scale inference tasks. This focus on energy-efficient AI hardware addresses both cost and sustainability.
- Simultaneously, the proliferation of AI inference at the edge is driving demand for compact, low-power solutions. The development of AI hardware for industrial automation and AI hardware for medical imaging has resulted in operational efficiency gains exceeding 30% in certain applications. These advancements reflect a market where AI accelerator thermal management and on-device AI processing are critical considerations for deployment.
We can help! Our analysts can customize this ai accelerators market research report to meet your requirements.
 RIA -
RIA - 
